Categories
By ChartExpo Content Team
Risk analysis isn’t just a business process—it’s a survival tool. Every organization faces risks, from financial downturns to supply chain disruptions, that could throw operations off track. Knowing how to pinpoint, assess, and manage these risks can be the difference between resilience and chaos.
Risk analysis gives you a roadmap for protecting your business, helping you identify which threats are worth the attention and which ones can be managed with existing safeguards.


But what exactly makes risk analysis so crucial? It’s about control. Risk analysis lets you assess the likelihood and impact of various threats, helping you focus resources where they matter most. By weighing potential risks against possible rewards, risk analysis helps leaders make better choices, stay proactive, and protect their teams and stakeholders from the unknown.
So, how does risk analysis work in real-world settings? It’s not simply about flagging threats—it’s about using tools to visualize, prioritize, and communicate those risks effectively. Whether it’s a simple matrix, a heatmap, or a layered approach for different departments, risk analysis helps break down complex risk landscapes. You’ll get a clearer view of the risks that could hit hardest, enabling you to set up defenses before they even appear on the radar.
First…
Risk analysis isn’t just about spotting potential hiccups; it’s about understanding the big picture.
Imagine you’re playing a game of chess. Each move isn’t just about the next step, but also about foreseeing potential threats several moves ahead. Similarly, risk analysis in business requires you to think ahead and identify key risks that could throw your strategy off balance.
It’s easy to get overwhelmed when you’re staring down a laundry list of risks. But not all risks are created equal.
Think about when you’re cleaning your house for guests; you don’t need to scrub every corner, just the spots your guests are likely to notice. Similarly, in risk analysis, prioritize the risks that have the most impact on your financial goals.
Let’s talk Pareto chart. They’re not just fancy graphs; they’re your best buds when it comes to managing risks. They help you apply the 80/20 Rule—focusing on the 20% of risks that might cause 80% of your problems.
It’s like when you’re packing for a trip, and you focus on the few items that will serve most of your needs, rather than packing your entire closet.
Histograms are like those popularity contests in school. But instead of voting for the most popular kid, they help you spot the most common risks. By showing you how often each risk pops up, histograms let you focus on fixing the frequent flyers first.
It’s akin to fixing a leaky faucet in your house—the one that bothers you every day, rather than the door that squeaks just once in a while.
When handling multiple projects or overseeing various departments, it’s vital to pinpoint where the risks lie. Are some projects riskier than others? Do certain departments face more challenges? By setting these comparisons, organizations can allocate resources more effectively and mitigate risks before they balloon into bigger issues.
Imagine trying to juggle three balls at once — it’s tricky, right? Now think of each ball as a different project risk. Viewing them side by side often causes confusion. It’s like trying to watch multiple TV shows on the same screen.
To avoid this mess, breaking down the risks into simpler, individual components helps in understanding each one without the clutter.
Clustered bar charts are the superheroes of the data visualization world. They let you see all the risks faced by different departments at a glance. Think of a bar chart as a lineup of athletes — each bar represents a department, and its height shows the level of risk.
This visual setup helps managers quickly spot which teams are playing in the danger zone and which ones are scoring risk management goals.
Comparison bar charts work like a height chart at a doctor’s office. Each project gets its bar, showing how tall it stands in terms of risk.
This straightforward visual tool allows stakeholders to measure risks across different projects without mixing up the data. It’s a clear, direct way to see who’s the tallest on the risk chart and who’s not pulling their weight.
Understanding how risks are intertwined can be like untangling a knotted string of lights; each risk can impact or amplify other risks. This interconnected nature requires a careful approach to identify and manage potential issues effectively.
Thinking that risks stand alone is a common mistake. In reality, they often interact in ways that can either increase or decrease the overall risk landscape. Recognizing these relationships is crucial for effective risk management.
Co-occurrence charts are tools that help to visualize and understand these connections. By showing how often different risks occur together, these charts can highlight unexpected correlations that might not be obvious at first glance.
Scatter graphs provide a clear view of how two risk factors might relate to each other. By plotting one risk on the X-axis and another on the Y-axis, you can see patterns that reveal positive or negative relationships, helping to predict potential risk outcomes.
Are you keeping an eye on how risks shift as days fly by? It’s key to understand that what might seem a small blip today could turn into a storm tomorrow.
Monitoring risk isn’t just about looking at what’s knocking at the door; it’s also about watching for those changes that creep up on you over time. This isn’t just about being safe; it’s about being smart and proactive.
Let’s talk about risks—they’re sneaky. They don’t just sit still. As your business grows, as technology advances, and as new regulations come into play, these risks evolve.
What was a minor issue last year could be a major threat today. That’s why it’s critical to stay ahead, always keeping an eye on how these risks morph and grow over time. It’s not just about knowing them, but also understanding how they evolve.
Imagine tracking your risks on a graph that shows not just one, but multiple factors at once.
Multi-axis line charts are your best friend here. They let you plot different types of risks along various axes, showing you a clear picture over time. This visual approach isn’t just neat; it’s incredibly effective at giving you a bird’s-eye view of where things stand and where they might be heading.
Ever watched a suspense movie and noticed how the tension builds up, then suddenly there’s a spike in the action?
Control chart in Excel is somewhat similar. They help you set control limits—a safety threshold, if you will. When a risk crosses this threshold, it’s a red flag. It means you need to take action, pronto! These charts and graphs are fantastic for keeping risks in check and ensuring they don’t spiral out of control without your notice.
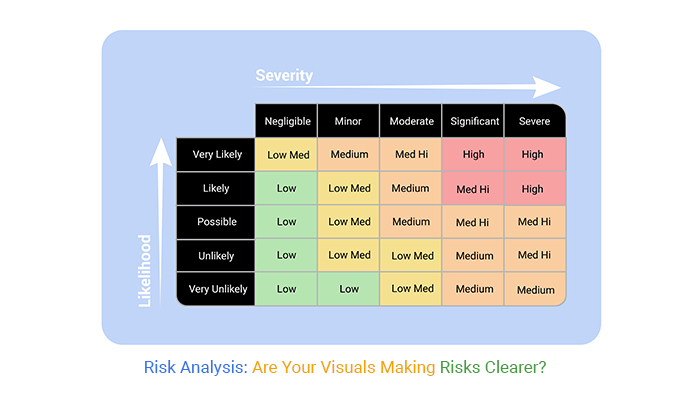
When you’re mapping out business processes, figuring out which risks to tackle first can make or break your project. But how do you decide which risks are the big bad wolves? Simple: look at their impact and how likely they are to happen. High impact plus high likelihood? That’s your top priority.
Let’s face it, not all risks are created equal, and deciding which ones deserve your immediate attention can feel like trying to solve a puzzle with a blindfold on. But don’t sweat it! By breaking down risks into categories of impact and likelihood, you can turn this tricky task into a more manageable one.
Ever tried getting a straight answer out of a room full of people? It’s like herding cats.
Likert Scale Charts let you visually capture how stakeholders feel about different risks. Each stakeholder rates the risk, and you get a clear chart that shows you what’s keeping everyone up at night.
Matrix charts are like the treasure maps of risk management. Draw a big grid, label one side “Impact” and the other “Likelihood,” and plot your risks. Where do most dots cluster? The top-right corner? Bingo, you’ve found your critical risks. Now you know exactly where to focus your energy, no guesswork needed.
When it comes to explaining risks to folks who aren’t tech-savvy, think simple. Break down the info into bite-sized pieces they can easily chew. Imagine explaining it to a friend who doesn’t work in your field. You wouldn’t throw jargon at them, right? Same deal here.
Keep it straightforward. Use plain language and avoid technical terms. If you must use a specific term, make sure to define it with an easy-to-understand explanation. Think of using analogies that relate to common experiences. It’s like explaining why you wouldn’t drive without a seatbelt – it’s about safety first!
Gauge charts are fantastic for showing just how serious a risk is at a glance. They work a bit like the fuel gauge in a car – showing whether risk levels are low, medium, or high. This makes it super easy for everyone to understand, no matter their expertise.
Heatmaps use color to show different levels of risk across various departments or areas in a business. They’re colorful and intuitive. If you see a lot of red, that’s a signal something needs attention, just like a stop sign.
This visual analytics helps stakeholders see where they need to focus without getting bogged down by details.
When we talk about risks in business, it’s not just about looking at the effects in one area. Imagine dropping a pebble in a pond and watching the ripples spread. That’s how risk impacts an entire company, not just where it first hits.
Businesses with multiple units need a solid plan to see not just where the risk starts but also where it might go. This means looking at all the parts of the business and seeing how they connect.
Risks are sneaky; they don’t stay put. They move around, affecting one area today and another tomorrow.
For example, a delay in delivery might not seem like a big deal to the customer service team at first, but if customers start complaining, it suddenly becomes a sales issue too. Every business unit might face different challenges from the same risk.
Mosaic plots are like the cool graphs you see in detective shows where they connect the dots to solve a case.
In business, these plots help us see how risks spread across different areas. Each block or color shows a different part of the company and how much risk it’s facing. It’s a handy tool for making big decisions because it shows you everything at one glance.
Sankey diagrams are not just fancy charts; they’re a roadmap of risk flow within a business.
These diagrams show the journey of a risk, from its start to its effects on different business units. The width of each line in the diagram can show how big the risk is, making it easier to spot where the major problems might be.
It’s like watching website traffic flow on roads; where you see a lot of it, you know there’s a potential traffic jam or, in our case, a business issue.
When you stack up all the risks in a project, it’s like watching a snowball roll down a hill, growing bigger as it goes. But how do you show this in a way that everyone gets it? That’s where visual tools come into play.
Think of total risk impact as the whole pie. Every risk you face in business is a slice of this pie. Some slices are bigger (think major financial risks), and some are tiny (like the risk of running out of coffee in the break room—still important for some of us!). To manage risks effectively, you need to see the whole pie, not just the slices.
Imagine you’re stacking blocks. Each block represents a risk. Stacked area charts work the same way. They show risks piling up over time, helping you see which periods will be the trickiest. It’s a fantastic snapshot for planning your moves in the business game.
Waterfall chart is the show-and-tell of risk management. They start at the top with your initial state (all good here!) and every step down the chart shows a new risk kicking in, altering your end state. It’s like tracking the domino effect in slow motion, showing exactly how each risk chips away at your project’s stability.
The following video will help you create a Radar Chart in Microsoft Excel.


Keeping up with shifts in risk levels is essential in any business. Think of it as keeping your eye on a moving target. Risks are not static; they change as conditions in and around your business evolve. Regular assessments are key. They help you spot new risks and reassess old ones, ensuring your strategies are up-to-date and effective.
To stay ahead, it’s vital to be proactive rather than reactive. Implement a system of regular check-ins on all fronts: market trends, internal operations, and external threats.
Use real-time data to your advantage; it can offer immediate insights into where your attention is needed most. This ongoing vigilance helps in promptly adjusting strategies, thus maintaining a strong defense against potential threats.
Slope charts are your go-to tool for visualizing changes in risk levels between two points in time. These charts are straightforward: they show the start point and the end point of your data, connected by a line. The slope of this line indicates the direction and steepness of change.
A steep upward slope? That’s a red flag signaling a significant increase in risk. A downward slope shows improvement. This visual aid helps in quickly pinpointing areas needing immediate action.
Radar charts provide a dynamic way of displaying risk profiles. Picture a spider web. Each axis represents a different risk area, extending from the center outwards. The further from the center, the higher the risk level.
This format allows you to compare multiple risk variables at once, observing how they change over time or in reaction to actions you’ve taken. It’s a comprehensive snapshot, perfect for spotting strengths and weaknesses in your risk management strategy.
When it comes to sorting out why things go wrong in business processes, it can feel like playing detective.
First off, you need a keen eye to spot where things are slipping up. Think of your business process as a busy kitchen—sometimes it’s the slick floor or the unmarked step that causes the mishaps, not the skill of your chefs.
So, how do you pinpoint these slippery spots? Start by mapping out every step of your process and watch closely for where things tend to pile up or slow down. This might reveal the hidden bumps in your workflow.
Now, don’t just stop at the first hiccup you see. Ask ‘why’ a few times. Like a curious kid who won’t stop questioning, drill down till you hit the core issue.
Maybe data entry errors are causing shipment delays. Why? Because the form is confusing. Why? It was set up in haste and never refined.
There you go, you’ve just traced a surface-level symptom to its root cause. It’s all about peeling back the layers of the onion to get to the smelly center.
Imagine a big old tree, each branch a different part of your business process.
Treemap help you visualize this network. Start with the trunk, the main problem, and branch out into all the factors contributing to it. This visualization isn’t just fancy; it’s functional. It helps you see not just what went wrong, but how different issues link up and prop each other up.
It’s like having a map of the fault lines that could trip up your process.
Picture a funnel: wide at the top, narrow at the bottom. This isn’t just for filtering coffee.
Funnel charts help you throw a bunch of potential risk factors into the wide end and see which ones make it out the narrow end as major issues. This way, you don’t spend time fixing minor glitches while big problems brew.
It’s about focusing your energy where it’ll make the most impact, ensuring you’re not just mopping the floor but also fixing the leak.
Evaluating the effectiveness of risk mitigations is key to making sure your business stays on track and safe from potential threats. How do you know your strategies are doing their job? Let’s find out!
First off, how do you check if the safeguards you put in place are working? It’s not just about setting them up and hoping for the best. You need a system to monitor and evaluate their performance regularly.
This means looking at the incidents or near-misses and asking, “Are these numbers going down? Are we seeing less risk since we started this plan?” If you’re nodding your head, you’re on the right track. If not, it might be time for a tweak or two.
Control charts are fantastic tools for this. They help you visualize whether the risk levels are staying within acceptable limits after you’ve implemented your mitigations. Imagine a graph where you plot the risk levels over time, both before and after the mitigations.
Are they staying within those upper and lower bounds you’ve set? If yes, give yourself a pat on the back. If they’re all over the place, it’s time to investigate why.
Double bar graphs can also be super helpful. They let you compare the risk levels before and after you’ve put your mitigation strategies into action.
Picture this: two bars for each risk point, one showing the level before mitigation and one after. This visual can quickly show you where you’ve made progress and where you might need to focus more effort. It’s like a before-and-after photo but for business risks!
When dealing with risk data, uncertainty is a big hurdle. Think of it as trying to predict the weather. You have a lot of data at your fingertips, but surprises can still pop up.
To handle this uncertainty, businesses use specific methods to ensure they’re prepared for various outcomes. They analyze past data, look for patterns, and make educated guesses about the future. This way, they can minimize risks and make smarter decisions.
Risk variability is like a box of chocolates—you never know what you’re going to get. However, unlike chocolates, surprises in risk can have serious repercussions.
Businesses tackle this by identifying how much risk levels can change over time. They use statistical tools to measure this variability, helping them understand potential highs and lows in risk. By doing this, they can better prepare for potential swings and protect their operations.
Box and whisker plots are not just fancy charts; they’re like X-ray vision for data analysts. They show the spread and skewness of data and highlight outliers. This is super helpful when you want to see how risk data behaves.
You can spot the norms and the exceptions at a glance. This visualization helps businesses make decisions based on not just the average but the extremes as well.
Histograms are like the pulse meter for risk data. They help you see the frequency of different risk levels in a visual format.
Imagine you’re looking at a mountain range—the height of each bar represents how often each risk level occurs. This helps businesses understand which risks are more common and which are rare. With histograms, it’s easier to gauge the landscape of risk and plan accordingly.
When we talk about probabilistic risk, we’re diving into the world of “What if?” It’s about understanding and communicating the chances of various risks occurring and the potential impacts they could have on a business. Think of it as trying to predict the weather for your company’s future!
Explaining probabilities to folks can be tricky. Not everyone thinks in percentages and odds! The challenge is making these probabilities clear and meaningful without making your audience scratch their heads in confusion.
It’s like trying to explain the rules of a board game right before game night; it needs to be simple and straightforward.
Scatter plots are your friends here. Imagine plotting points on a graph where one axis shows the likelihood of risks and the other shows the impact of these risks.
This visual helps people see where the big, scary risks lie and which ones are less likely to cause trouble. It’s a bit like looking at a star map, where each star’s brightness and position tell you something different about the night sky.
Now, let’s talk about spider charts. Picture a web with several axes, each representing a different risk category.
You plot points on each axis based on the likelihood and severity of risks in those categories. Connecting these points gives you a shape that quickly shows which areas might need more attention. It’s like drawing your own little risk constellation in the universe of business hazards!
When it comes to business process mapping, understanding how to manage overlapping risks is key. Think of your business as a ship navigating through a storm. Each risk might be a wave. When waves overlap, they can create bigger challenges or opportunities, depending on how you handle them.
Imagine two projects at risk of running late. If both are crucial to launching a new product, their overlap could magnify the issue. To manage this, plot each project’s timeline. Identify where they overlap. This visual overlap shows where you need focused efforts to mitigate risks.
Overlapping bar charts are like the secret sauce in a burger—they make the complex simple. Each bar represents a different risk. When bars overlap, it’s a visual cue. It shouts, “Hey, look here! These risks are mingling!” This clarity drives targeted actions to manage these overlapping areas effectively.
Tree maps are fantastic for showing how different risks stack up and intersect. Each box in a tree map is a risk category. Larger boxes mean bigger risks. When boxes nest within each other, it shows overlap.
This layout helps you see which risks might impact multiple areas of your project or business, guiding where to focus your risk management efforts.
When it comes to business, spotting risk patterns across various categories is key to maintaining a stable operation. How do you do it? Start by gathering data from all departments. This means pulling reports from sales, manufacturing, supply chain, and human resources. Once you’ve got the data, it’s time for analysis.
Look for commonalities or trends in the risk data. For instance, if injury reports increase during a specific time of year, you might pinpoint a recurring issue in workplace safety practices.
Similarly, if customer complaints spike when launching new products, there might be a flaw in your product development or customer service processes.
Matrix charts are a fantastic tool for visualizing risks across different business categories. Create a chart with categories as both rows and columns, then fill in the cells based on the level of risk between the intersecting categories.
This visual aid helps you quickly identify which combinations of categories pose the greatest risk.
Crosstab charts are another great visual tool, especially when you need to analyze risk occurrence patterns across multiple dimensions. They allow you to see how often specific risks occur within different segments of your business.
For example, you might discover that product defects are most common in items released during the third quarter, suggesting a possible rush in production or oversight in quality control during that period.
When managing multiple projects, balancing risks is vital. Each project carries its own set of risks, and overlooking one can impact all projects. It’s essential to identify and assess each risk.
Use tools like risk matrices to prioritize and allocate resources effectively. This approach ensures that no single project becomes a liability to others, maintaining an equilibrium that promotes overall project health.
Handling risks in multiple locations requires a keen eye and a sharp mind. You must keep tabs on different risk factors simultaneously.
Regular updates from each project site help in this process. Implement a centralized risk management system to track updates in real time. This system acts as a hub for all risk-related information, enabling quick decision-making and ensuring consistent risk management across all locations.
Clustered column charts are a brilliant tool for visualizing risks across multiple projects. They allow you to compare the risk levels of different projects at a glance. You can see which projects are riskier and might need more attention.
Adjust the colors and sizes of the columns to reflect the severity and type of risk, making the chart an intuitive snapshot of project health.
Multi-axis line charts are perfect for tracking changes in risk levels over time across multiple projects. They allow you to plot different risk metrics on separate axes, providing a clear view of trends and developments.
This method helps in identifying patterns or anomalies in risk exposure, enabling proactive risk management. Regularly updating these charts ensures that you stay ahead of potential issues, keeping project risks under control.
When tackling business process mapping, one pivotal task is spotting where risks clump together. These are your risk concentration points. Think of these as the “hot spots” in your process where if something goes wrong, it goes really wrong. Identifying these early can save you heaps of trouble down the line.
To zero in on these risk hot spots, start by mapping out every step of your business process. Look for stages where multiple risk factors align—like high financial stakes, regulatory compliance, and technical complexities. These are your red flags!
Heatmaps are fantastic visual tools for this job. They use colors to show where risk levels are highest. Brighter or darker colors indicate higher risk areas. This visual makes it super easy to spot trouble areas at a glance.
It’s like having a risk detector that highlights what to focus on fixing first.
Horizontal waterfall charts are another ace tool. They show how risks pile up across different stages of a business process. Each bar on the chart represents a process step, growing in size if the risk is higher. This chart paints a clear picture of where in the process risks start small but get big quickly.
It’s like watching risk accumulate in slow-motion, giving you a chance to stop it before it topples over.
Understanding how risk spreads across an organization can significantly impact decision-making and strategic planning. By visualizing these risks, companies can identify areas of high vulnerability and opportunities for improvement.
In many organizations, risk is not distributed evenly. Some departments might face higher risks due to their operational roles, while others might have minimal exposure. Recognizing this uneven spread is crucial for effective risk management. It allows leaders to allocate resources more efficiently and implement targeted risk mitigation strategies.
Mekko charts, also known as Marimekko charts, are an excellent tool for displaying complex risk data across different categories and dimensions. These charts combine qualities of a pie chart and a bar graph, showing both relative sizes and the distribution of risks across various organizational categories.
They help in pinpointing which areas contribute most to the overall risk profile and how these risks relate to one another.
Sunburst charts offer a hierarchical view of risk distribution, making them perfect for organizations with multiple layers of data. These charts display risk levels from the core (center of the chart) outward, representing deeper layers of the organization.
This data visualization helps stakeholders see not only the big picture but also how individual segments or departments contribute to overall risk levels.
When it comes to business, risks aren’t just scattered; they’re interconnected. Understanding these connections can help you manage them more effectively. Let’s explore how you can track these risk dependencies to keep your business processes smooth.
Think of risks in a business process as a river flowing through a landscape, changing directions and growing as it moves. By charting the path this ‘risk river’ takes, you can pinpoint where it starts, where it gathers strength, and where it might cause flooding. This mapping lets you step in with sandbags or diversions before small leaks become disasters.
Imagine drawing a map that shows how much traffic goes from one city to another.
Sankey diagrams do something similar for risks. They use arrows of different thicknesses to show you how risks move from one process to another. The thicker the arrow, the bigger the risk flow. This visual tool helps you see not just where risks originate, but how they grow and spread across your operations.
Tree diagrams are fantastic for seeing the ‘family tree’ of risks. Starting with a single risk at the root, they branch out to show all the related smaller risks that stem from it. This hierarchical layout helps you see the big picture and the details, ensuring you don’t miss the forest for the trees, or the risks for the branches!
Risk analysis is the process of identifying potential threats that could impact a project, business, or decision. It involves assessing each risk’s likelihood and possible effects on operations, finances, or reputation. By evaluating these factors, risk analysis helps leaders prioritize which risks need immediate attention and which can be monitored. This structured approach enables organizations to stay proactive, focusing resources on high-impact threats while making informed choices to reduce uncertainty.
Risk management is the strategic process of planning, controlling, and minimizing risks within an organization. It encompasses all steps from identifying risks to evaluating, monitoring, and addressing them. Effective risk management helps a business minimize potential negative impacts, allowing it to meet goals with greater stability and resilience. By implementing a risk management plan, organizations can anticipate threats, allocate resources more effectively, and build confidence in their overall strategy.
Risk mitigation involves taking actions to reduce the likelihood or impact of identified risks. Unlike risk analysis, which focuses on understanding threats, risk mitigation is all about putting strategies in place to address them. This could mean diversifying suppliers to reduce supply chain risk or investing in cybersecurity to protect against data breaches. Risk mitigation ensures that, even if a risk occurs, its effects are minimized, helping the business stay on course with minimal disruption.
Risk analysis is more than a checklist—it’s your guide to smarter decisions. By examining potential threats and understanding how they impact your business, you’re building a proactive defense that can prevent costly surprises. Through visual tools, like heatmaps and Pareto charts, you can pinpoint and prioritize risks, making it easier to focus on what really matters.
The process may sound straightforward, but it’s powerful. Risk analysis doesn’t stop at identifying risks; it’s also about effective communication. When your team and stakeholders clearly see the risks and understand the priorities, you create alignment and boost confidence across the board.
So, what’s next? Take action. Review your risk management approach, update your visuals, and get everyone on the same page. Start making risk analysis a regular part of your strategy, and you’ll find it’s one of the best investments in your business’s stability and growth. After all, staying prepared means staying strong.
How much did you enjoy this article?


Calculate accounts receivable turnover ratio to measure credit collection speed, improve cash flow, and strengthen your financial strategy. Read on!

Change Management KPIs are the key to tracking adoption, performance, and ROI during transitions. Find out which metrics matter. Read on!

Data collection methods and techniques determine the quality of every insight you act on. Explore key approaches for gathering reliable data. Read on!


