Categories

Google Forms to Google Sheets keeps your data organized and current with every submission. Learn the steps, methods, and tips now!

Fun Survey Questions can raise response rates, reveal patterns, and guide survey planning across teams, classrooms, and customer research. Read on!
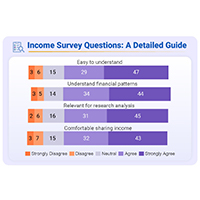
Income survey questions capture financial data while protecting privacy. Master bracket design, response analysis, and visualization tactics. Learn more!