ChartExpo Videos
Short how-to videos Short learning curve
Our how-to videos will help you to create insightful charts in less time.
Subscribe to our Youtube channel
5:25
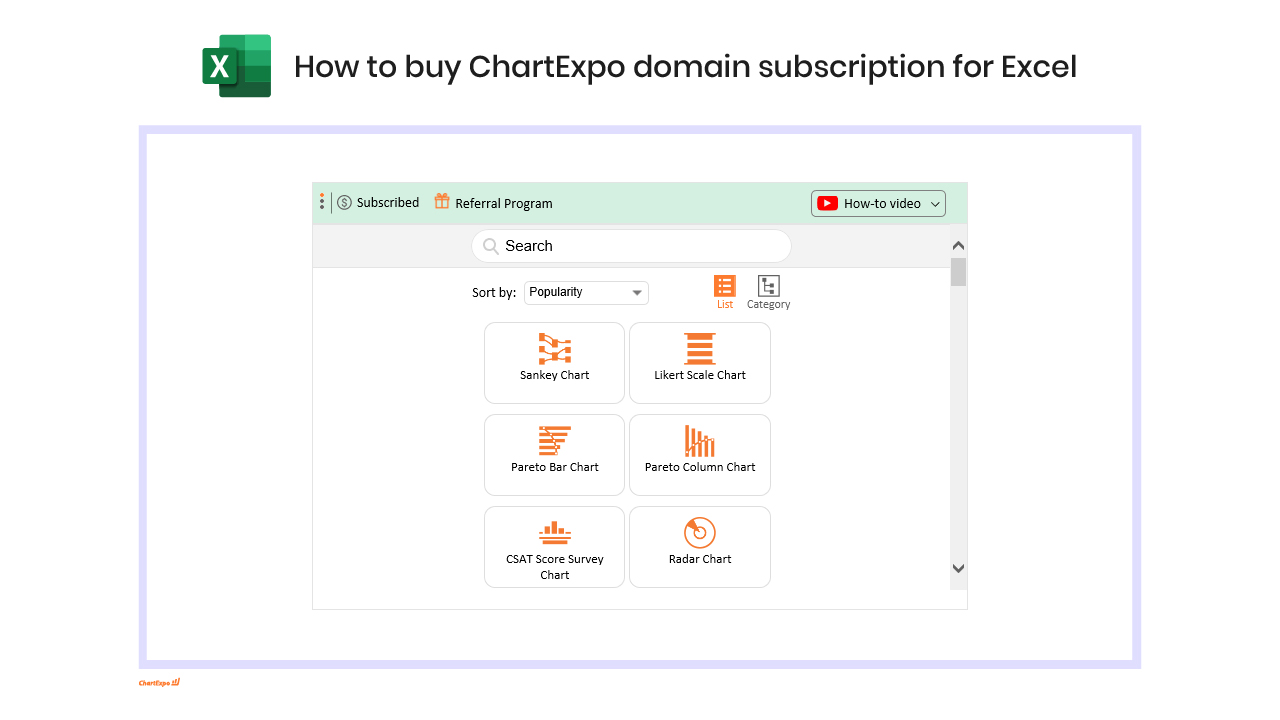
How to install/buy ChartExpo domain subscription for Excel? custom flow sentiment

5:47
How to install/buy ChartExpo domain subscription for Google Sheets? custom flow sentiment
4:52
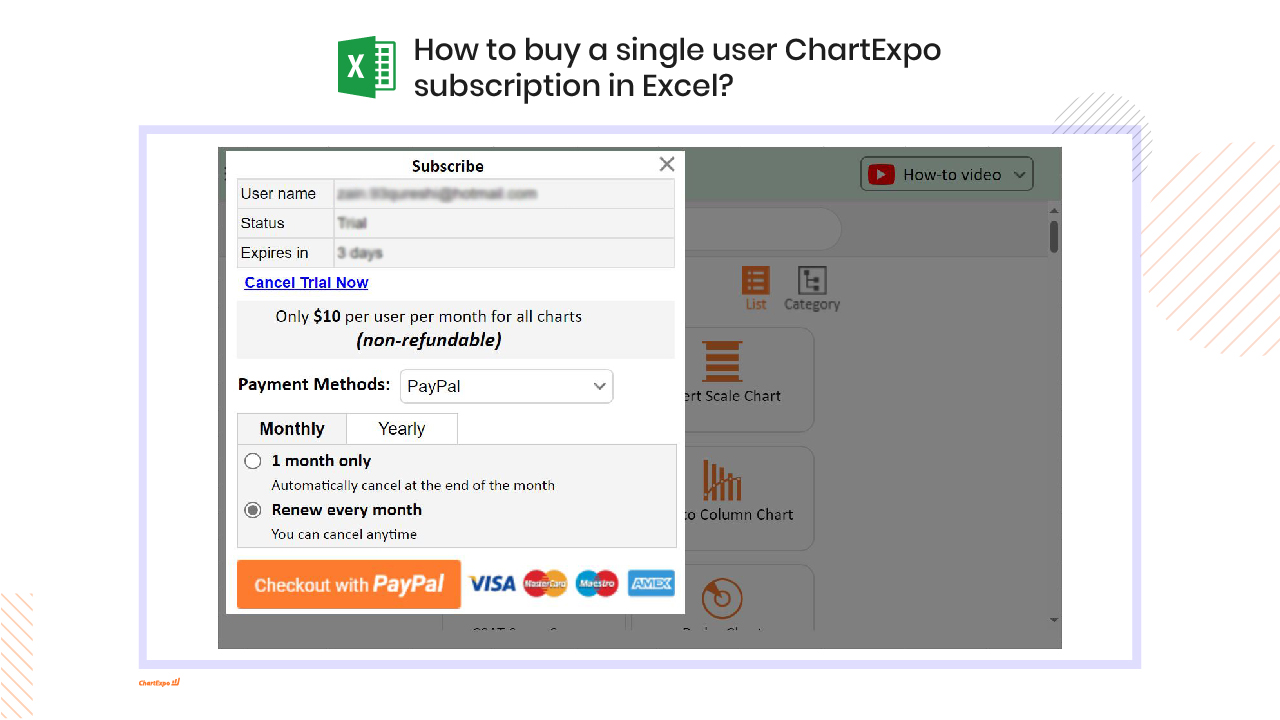
How to buy ChartExpo single user subscription for Excel? custom flow sentiment
5:44
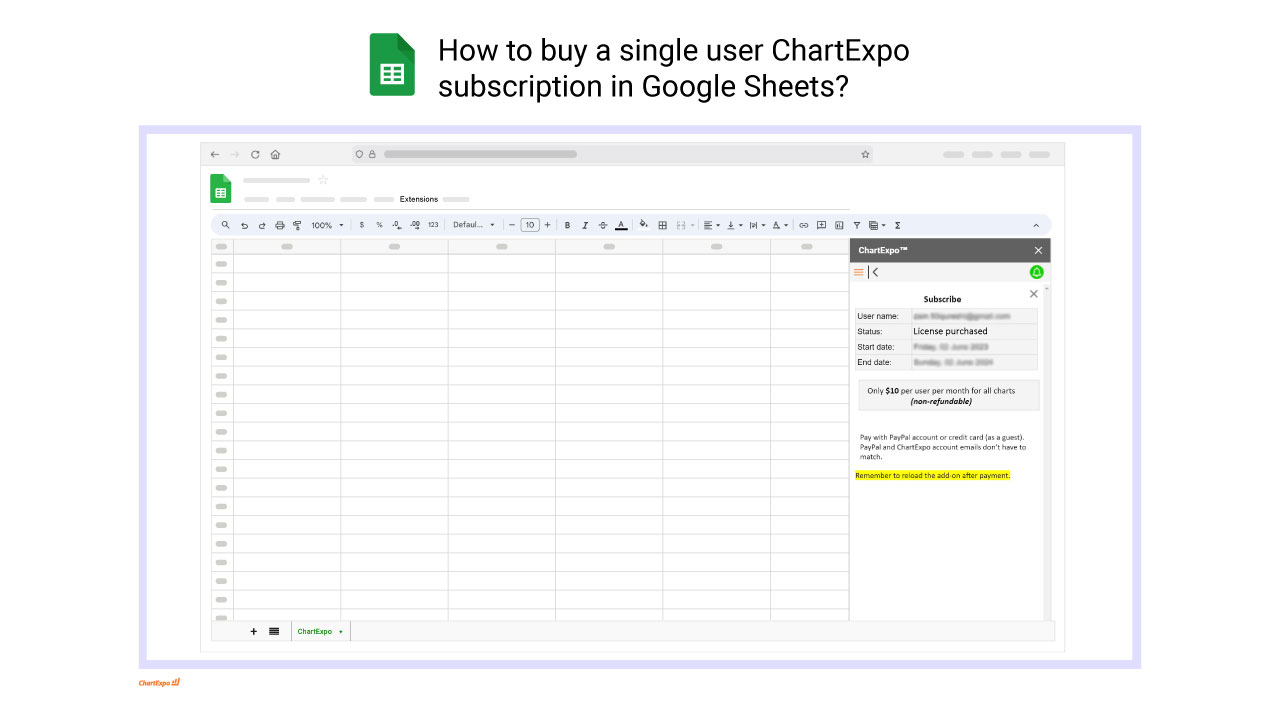
How to buy ChartExpo single user subscription for Google Sheets? custom flow sentiment
3:02
How to install ChartExpo add-in in Excel and Microsoft Office 365? custom flow sentiment
4:17
How to install ChartExpo add-on in Google Sheets? custom flow sentiment

4:11
Sankey chart | How to draw Sankey Chart in Google Sheets custom flow sentiment

2:52
Sankey chart | How to draw Sankey Chart in Microsoft Excel custom flow sentiment
5:16
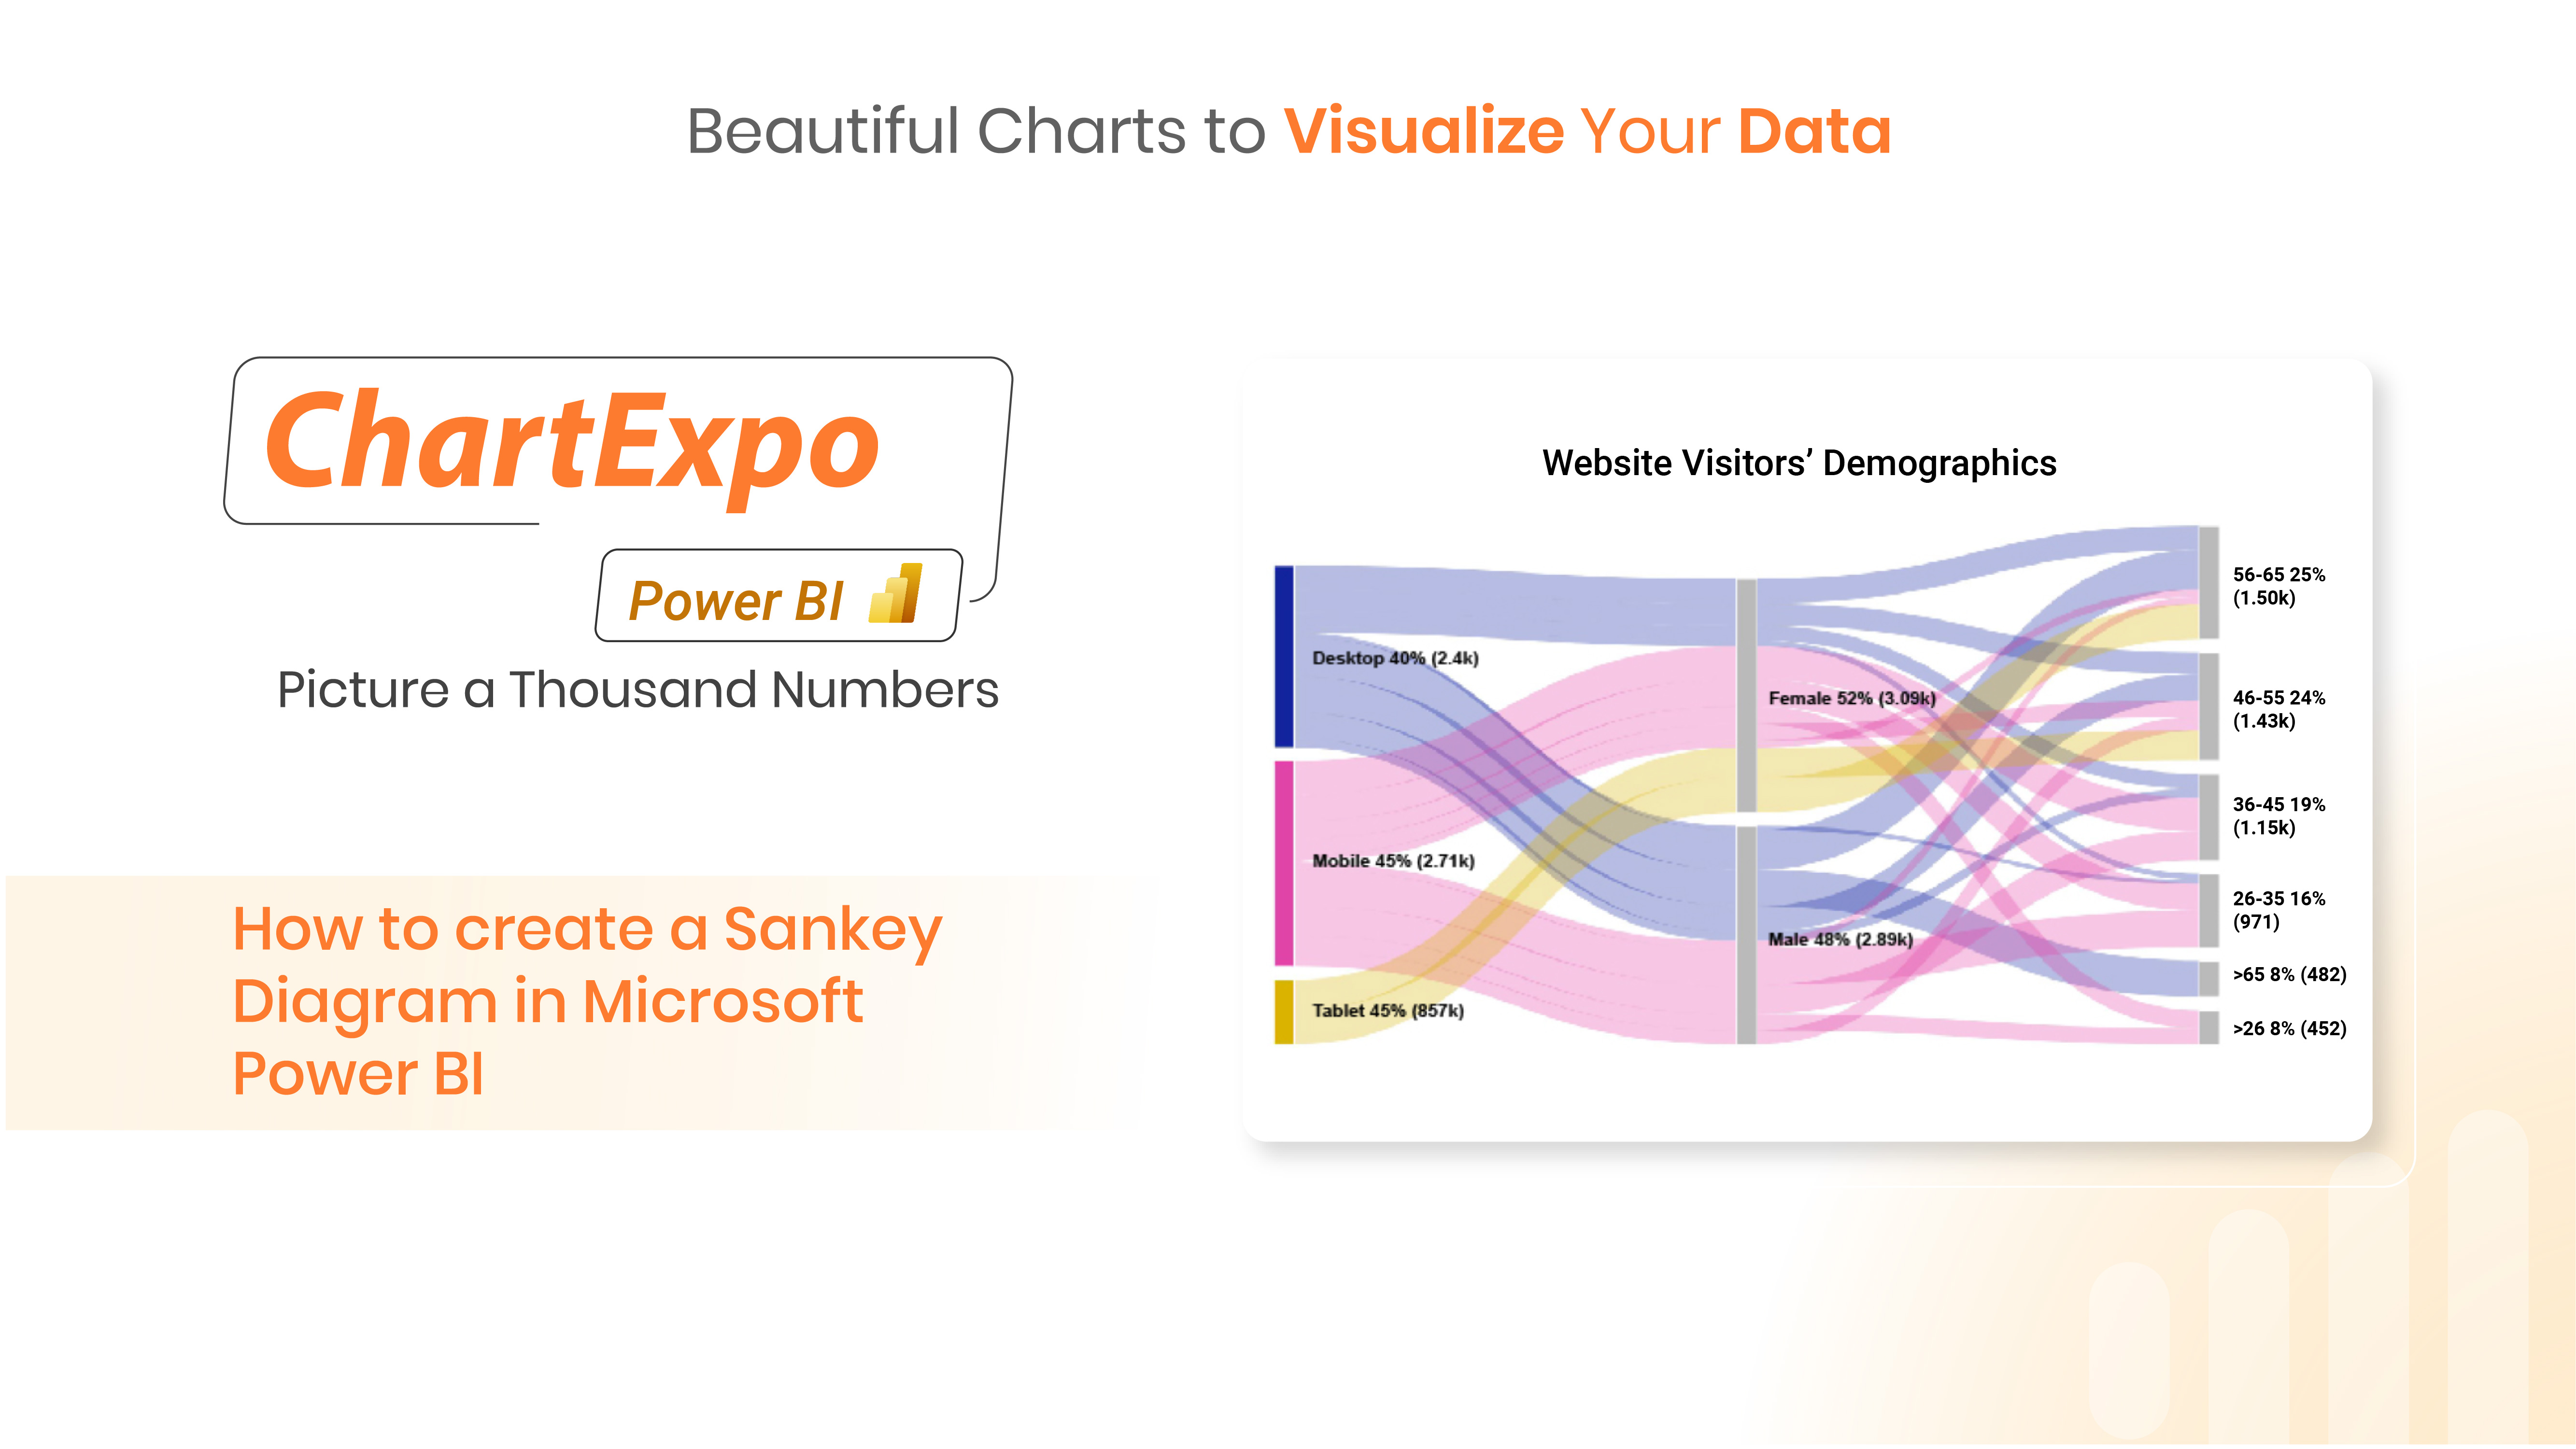
Sankey chart | How to create a Sankey Diagram in Microsoft Power BI? custom flow sentiment

4:20
Sankey chart | How to make an Enerygy Flow Diagram in Google Sheets custom flow sentiment

2:58
Sankey chart | How to make an Enerygy Flow Diagram in Excel custom flow sentiment

3:47
Sankey chart | How to create a cash flow chart in Google Sheets custom flow sentiment

2:19
Sankey chart | How to create a cash flow chart in Excel custom flow sentiment

4:34
Sankey chart | How to create an online shopping customer journey map with... custom flow sentiment
6:28
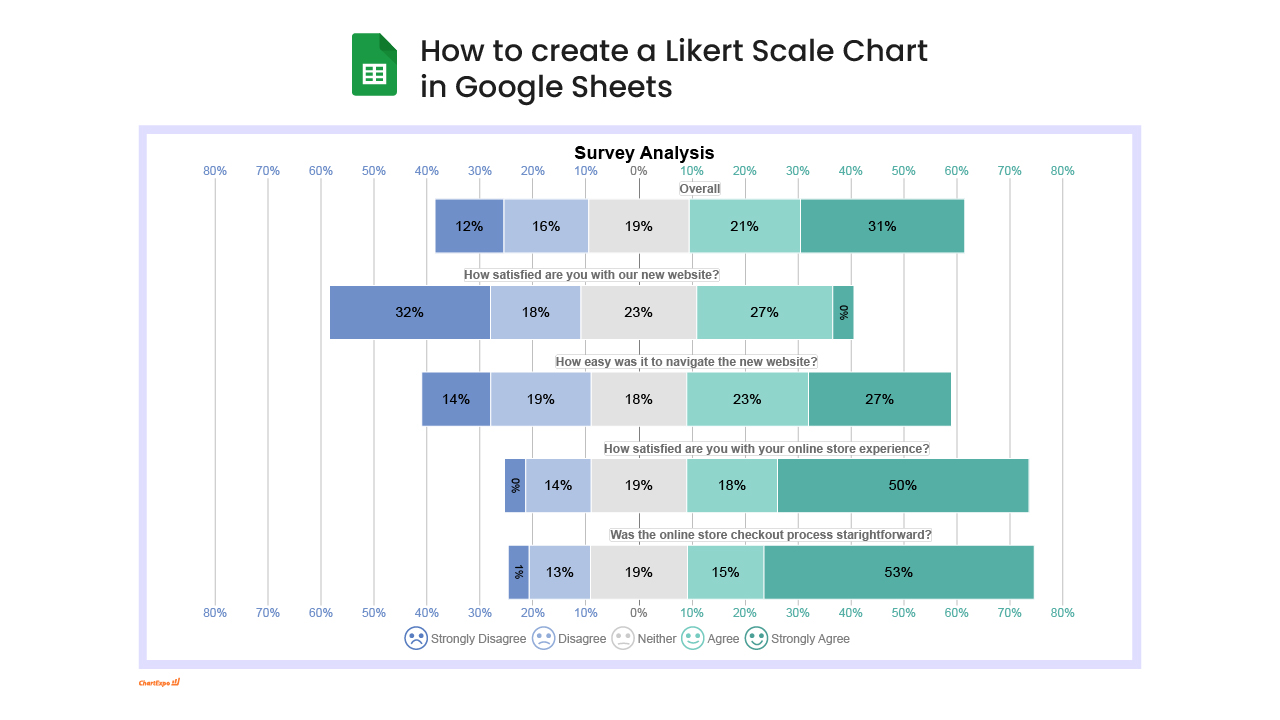
Likert Scale chart | How to create a Likert Scale Chart in Google Sheets sentiment survey
6:43
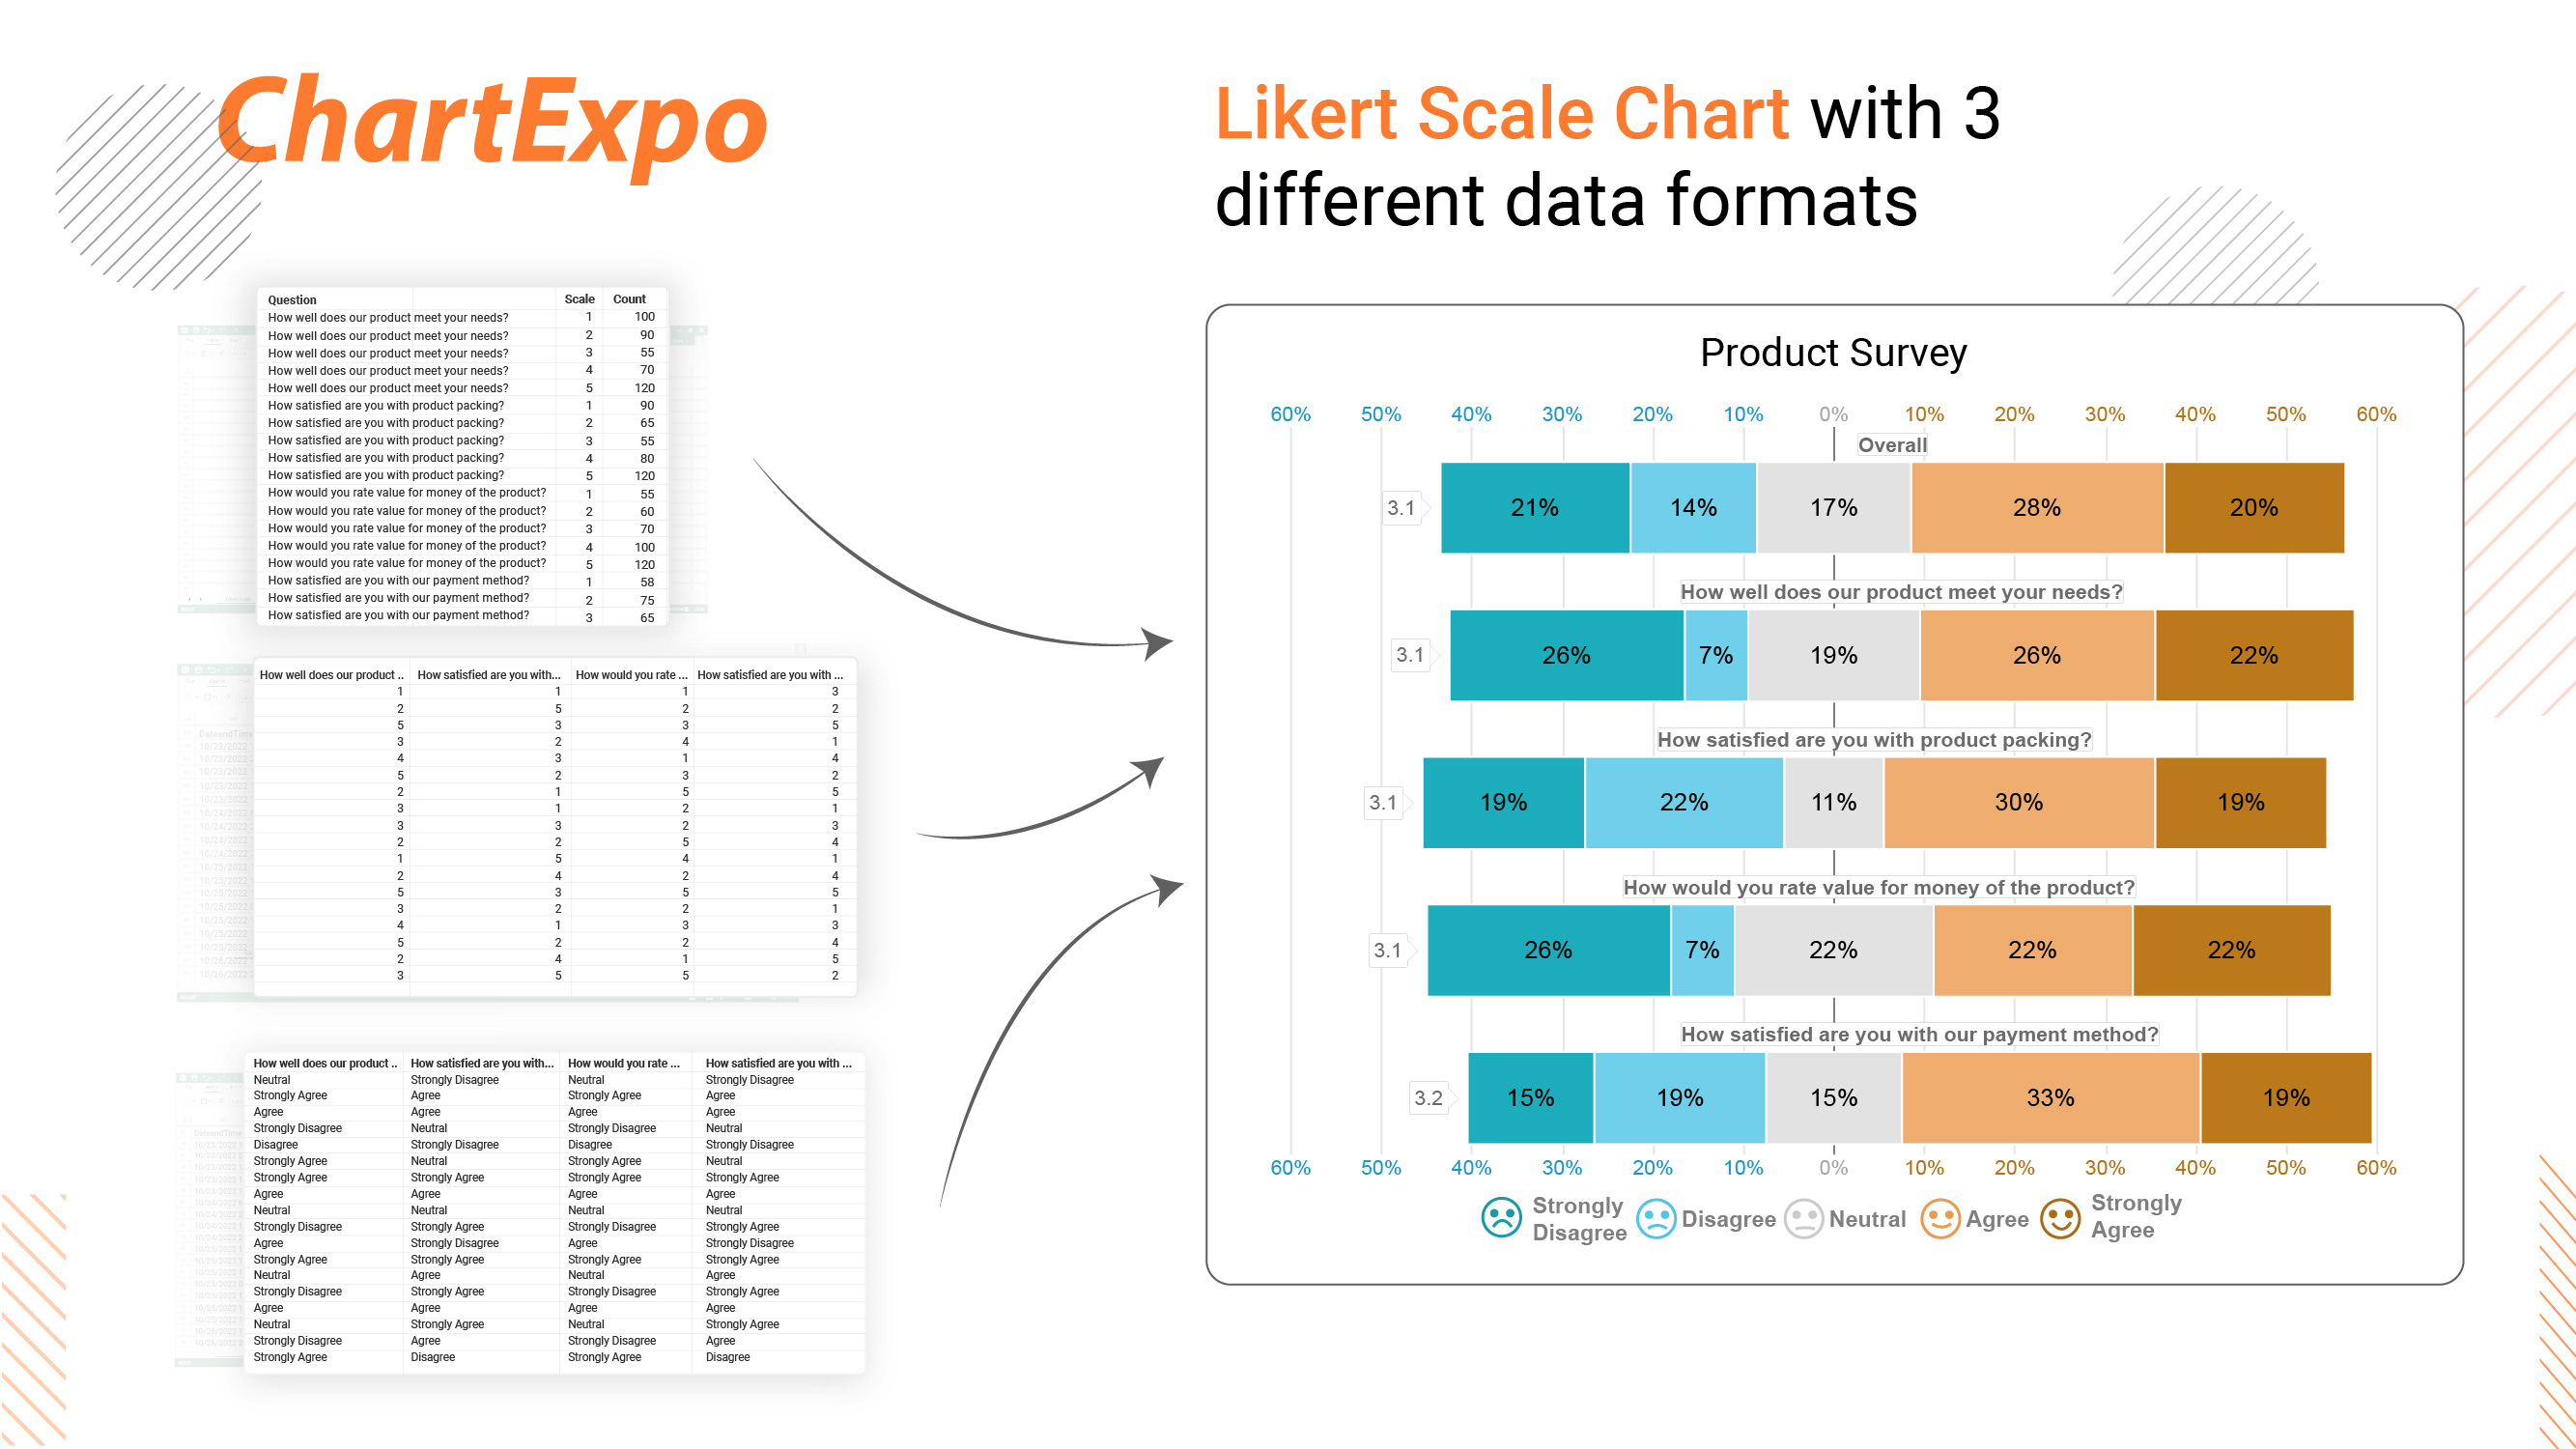
Likert Scale chart | How to create a Likert Scale Chart in Excel sentiment survey
8:04
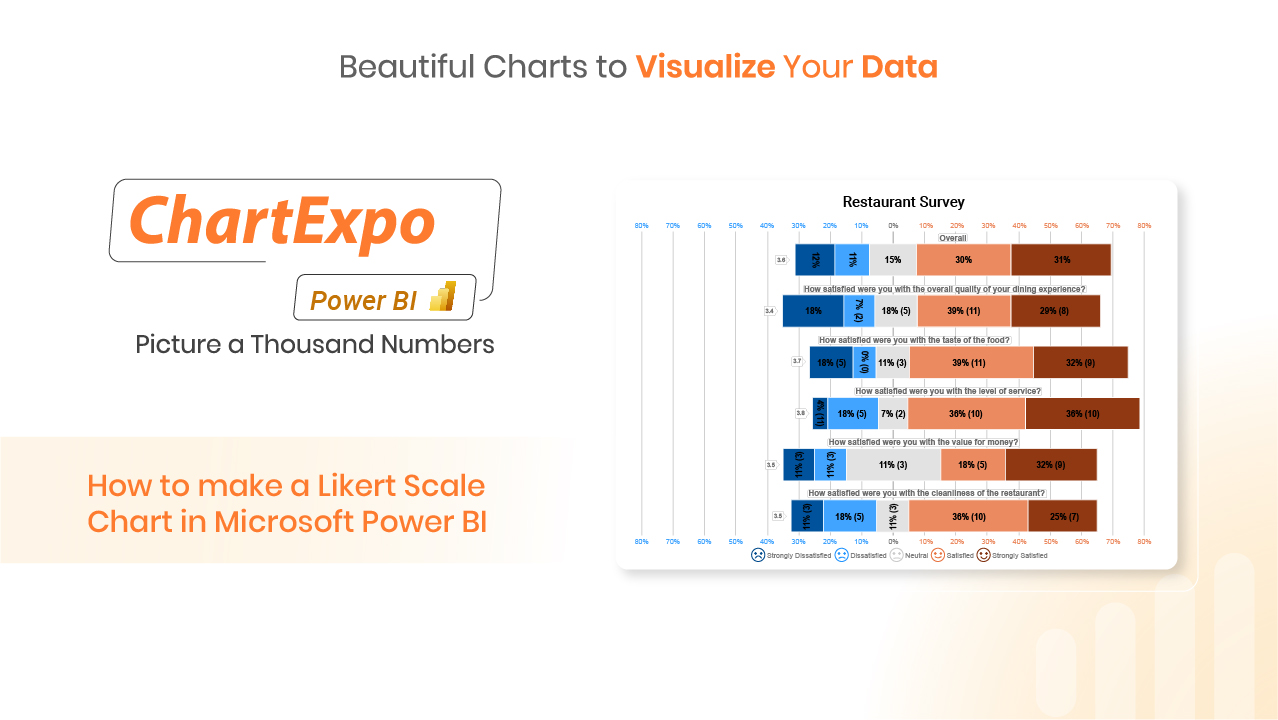
Likert Scale chart | How to create a Likert Scale Chart in Power BI? sentiment survey

4:03
Likert Scale chart | Employee Exit interview Survey in Google Sheets sentiment survey

2:43
Likert Scale chart | Employee Exit interview Survey in Microsoft Excel sentiment survey

3:59
Likert Scale chart | Environmetal Issues Survey result in Excel sentiment survey

4:46
Likert Scale chart | Environmetal Issues Survey result in Google Sheets sentiment survey

2:27
Likert Scale chart | Analyze Likert Scale Data in Excel sentiment survey

3:21
Likert Scale chart | Analyze Likert Scale Data in Google Sheets sentiment survey

2:34
Likert Scale chart | Employee Satisfaction Survey in Excel sentiment survey

4:01
Likert Scale chart | Employee Satisfaction Survey in Google Sheets sentiment survey

2:22
Likert Scale chart | Presenting Survey results in Excel sentiment survey

3:17
Likert Scale chart | Presenting Survey results in Google Sheets sentiment survey

3:40
Likert Scale chart | Student Satisfaction Survey result in Excel sentiment survey

4:47
Likert Scale chart | Student Satisfaction Survey result in Google Sheets sentiment survey

3:37
Pareto Column Chart | How to draw Pareto Column Chart in Microsoft Excel combination ppc

4:22
CSAT Score Survey Chart | How to draw CSAT Score Survey Chart in...column sentiment

3:45
CSAT Score Survey Chart | How to draw CSAT Score Survey Chart in...column sentiment

4:15
Radar Chart | How to draw Radar Chart in Google Sheets area ppc

3:37
Radar Chart | How to draw Radar Chart in Microsoft Excel area ppc

3:37
Gauge chart | How to draw Gauge chart in Google Sheets circular

2:30
Gauge chart | How to draw Gauge chart in Microsoft Excel circular

3:48
Radial Chart | How to draw Radial Chart in Google Sheetscircular ppc

3:11
Radial Chart | How to draw Radial Chart in Microsoft Excelcircular ppc

3:43
Funnel Chart | How to draw Funnel Chart in Google Sheetsmisc

3:00
Funnel Chart | How to draw Funnel Chart in Microsoft Excelmisc

4:03
Column Chart | How to draw Column Chart in Google Sheetsppc

3:27
Column Chart | How to draw Column Chart in Microsoft Excelppc

4:51
Clustered Column Chart | How to draw chart in Google Sheetsppc

3:37
Sentiment Trend Chart | How to draw chart in Microsoft Excelcombination custom survey

4:43
Line Chart | How to draw a Line Chart in Google Sheets

5:00
Line Chart | How to draw a Line Chart in Microsoft Excel

4:30
Multi Series Line Chart | How to draw chart in Google Sheets

3:33
Pie Chart | How to draw Pie Chart in Google Sheets

2:46
Pie Chart | How to draw Pie Chart in Microsoft Excel

4:04
Matrix Chart | How to draw Matrix Chart in Microsoft Excelcustom ppc

3:25


