• Home
  • Tools dropdown img
    • Spreadsheet Charts

      • ChartExpo for Google Sheets
      • ChartExpo for Microsoft Excel
    • Power BI Charts

      • Power BI Custom Visuals by ChartExpo
    • Word Cloud

  • Charts dropdown img
    • Chart Category

      • Bar Charts
      • Circle Graphs
      • Column Charts
      • Combo Charts
      • Comparison Charts
      • Line Graphs
      • PPC Charts
      • Sentiment Analysis Charts
      • Survey Charts
    • Chart Type

      • Box and Whisker Plot
      • Clustered Bar Chart
      • Clustered Column Chart
      • Comparison Bar Chart
      • Control Chart
      • CSAT Survey Bar Chart
      • CSAT Survey Chart
      • Dot Plot Chart
      • Double Bar Graph
      • Funnel Chart
      • Gauge Chart
      • Likert Scale Chart
      • Matrix Chart
      • Multi Axis Line Chart
      • Overlapping Bar Chart
      • Pareto Chart
      • Radar Chart
      • Radial Bar Chart
      • Sankey Diagram
      • Scatter Plot Chart
      • Slope Chart
      • Sunburst Chart
      • Tornado Chart
      • Waterfall Chart
      • Word Cloud
    • Google Sheets
      Microsoft Excel
  • Services
  • Pricing
  • Contact us
  • Blog
  • Support dropdown img
      • Gallery
      • Videos
      • Contact us
      • FAQs
      • Resources
    • Please feel free to contact us

      atsupport@chartexpo.com

Categories
All Data Visualizations Data Analytics Surveys
Add-ons/
  • Google Sheets
  • Microsoft Excel
  • Power BI
All Data Visualizations Data Analytics Surveys
Add-ons
  • Google Sheets
  • Microsoft Excel
  • Power BI

We use cookies

This website uses cookies to provide better user experience and user's session management.
By continuing visiting this website you consent the use of these cookies.

Ok

ChartExpo Survey


Home > Blog > Microsoft Excel

How to Visualize & Analyze Competitor Website Traffic?

Knowing your competition in this digital jungle is like having a secret weapon.

And what better way to get an edge than by diving into their website traffic? It’s like peeking into their secret lair, discovering their strategies, and outsmarting them at their own game.

“But wait,” you say, “I’m no tech whiz!”

Analyze Competitor Website Traffic

Fear not, I say; you don’t need a Ph.D. in coding to analyze competitor website traffic

Why?

Google Analytics, your trusty sidekick, is here to help.

Google Analytics, that old number-crunching workhorse, becomes your ally as you gather intelligence on your rivals’ online performance. Numbers will reveal their stories, trends will spill their secrets, and your competitors won’t know what hit them. From bounce rates to referral sources, you’re about to crack the code behind their online success.

This newfound knowledge will help you strategize like a marketing mastermind, using their traffic insights to your advantage.

Follow my lead. Let me help you level up your game and give your competition a run for their money.

Table of Contents:

  1. What is Website Competitor Analysis?
  2. How to Do Website Competitor Analysis?
  3. How to Choose the Right Tool?
  4. Why Google Analytics?
  5. Analyze Competitor Website Traffic
  6. Wrap Up

What is Website Competitor Analysis?

Website competitor analysis is evaluating and studying rival businesses within the industry. It’s about dissecting their strategies, strengths, and vulnerabilities. Utilizing tools like a web analytics dashboard can enhance this analysis by providing valuable insights into competitors’ online performance.

This analysis aids in identifying opportunities, potential threats, and areas for improvement. Consequently, this intel helps refine your game plan to enhance your competitive advantage.

How to Do Website Competitor Analysis?

Analyzing competitor website traffic is a multifaceted process that involves dissecting various aspects of your rivals’ digital presence:

  1. Identify competitors: Begin by listing both direct and indirect competitors. Direct competitors offer similar products or services. Conversely, indirect competitors might have a different product line but target the same audience.
  2. Analyze website traffic: Monitor competitor website traffic patterns. Use a Mosaic graph to observe which pages receive the most visits and understand the sources of their web traffic. This information can reveal their most popular content and their audience engagement strategies.
  3. Evaluate keywords: Investigate the keywords your competitors are targeting. Understand which keywords are driving traffic to their site and potentially driving conversions.
  4. Social media analysis: Analyze your competitors’ social media presence. Examine their follower count, engagement rates, and the types of content they post. This exploration grants you a deeper understanding of the platforms and content that effectively connect with their audience.
  5. Content assessment: Examine the quality and variety of content on your competitors’ websites. Check if they use blogs, videos, infographics, or other formats. Then, identify gaps in their content strategy that you could exploit.
  6. Backlink analysis: Study the backlinks that lead to your competitors’ websites. Assess the quality and relevance of these backlinks, as they can influence search engine rankings and domain authority. Discover where they’re getting their links and identify potential link-building opportunities for yourself.
  7. User experience (UX): Navigate their website as a user. Scrutinize its design, navigation, and the overall experience it offers. By doing so, you will gain insights into their strengths and weaknesses in terms of user engagement.
  8. Digital advertising: Monitor their online ads. Are they running Google Ads, social media ads, or display ads? Analyze their messaging, targeting, and ad placements to gain insights into their advertising strategy.
  9. Email marketing: If possible, sign up for your competitors’ email lists. Analyze the frequency and content of their emails. Look for patterns in their email marketing campaigns and consider their approach to audience segmentation.
  10. Social listening: Monitor online conversations and mentions related to your competitors. This could be in social media discussions, forums, or reviews. Understand the sentiment surrounding your competitors and gather insights into customer opinions.

How to Choose the Right Tool?

Choosing the right tool to analyze competitor website traffic is crucial. Consider the following steps:

  1. Identify needs: Determine what data you need to extract from your competitors’ website traffic.
  2. Features: Look for tools with features matching your requirements, like traffic sources, audience demographics, and popular pages.
  3. Ease of use: Opt for user-friendly tools that don’t require extensive technical knowledge.
  4. Accuracy: Ensure the tool provides accurate and reliable data.
  5. Integration: Choose a tool that integrates well with your existing systems.
  6. Cost: Evaluate the pricing plans and choose a tool that fits your budget.

Considering these factors, Google Analytics emerges as a top choice. It’s widely used, offers comprehensive insights, and integrates seamlessly with other Google services.

Why Google Analytics?

Here are some of the reasons why Google Analytics is a standout choice for website traffic analysis:

  • Granular data: Google Analytics offers a treasure trove of granular data. This allows you to explore website performance at a microscopic level. From page views and sessions to user demographics and devices, you can uncover a wealth of insights.
  • User behavior insights: Understanding user behavior is paramount, and Google Analytics nails it. Bounce rates, session durations, and click-through rates divulge how visitors interact with your site. This knowledge helps you refine your user experience.
  • Integration: Link it with Google Ads, Search Console, and Data Studio for a comprehensive view of your online ecosystem. Google Analytics seamlessly integrates with various platforms, making it the nucleus of your data analysis.
  • Free to use: The fact that Google Analytics offers robust capabilities without a price tag is a game-changer. This democratizes data analytics, enabling businesses of all sizes to access critical insights.
  • Custom reporting: No two businesses are identical, and neither should their analytics reports be. Google Analytics lets you design customized dashboards and reports, spotlighting the metrics that matter most to your goals.
  • Cross-channel insights: In a multi-channel world, understanding how different channels interact is vital. Google Analytics provides cross-channel insights, showing how various touch points contribute to conversions.
  • Real-time monitoring: With real-time data updates, you can see how changes impact your website on the spot. Launch a new campaign, and watch Google Analytics showcase its effects in real time.
  • Goal tracking: Establishing goals is fundamental, and Google Analytics makes tracking them a breeze. Whether it’s a specific click, form submission, or purchase, the tool quantifies your success.
  • Vast learning resources: Google Analytics boasts a vast community of users and a plethora of learning resources. From official guides to online communities, you’re never short of help when navigating the analytics landscape.

How to Analyze Competitor Website Traffic by Creating a Chart?

Let’s dive into the deep end of website espionage, armed with the magic wand of data visualization. You see, Excel is fantastic at organizing data. However, when it comes to data visualization, it’s like asking a cat to bark quite limited.

That’s where ChartExpo sweeps in, the superhero caped in data visualization tools and finesse.

ChartExpo whips up charts that make your data dance like it’s in a Broadway show.

Benefits of Using ChartExpo

  • ChartExpo takes data visualization to the next level by offering a plethora of visualizations. The options galore allow you to handpick the perfect one to showcase your data.
  • Say goodbye to the tedious process of coding! ChartExpo’s user-friendly interface empowers you to craft insightful, appealing visualizations effortlessly.
  • Unleash your creativity with ChartExpo’s customizable features. You can add your personal touch to create visualizations matching your unique taste in colors, fonts, and styles.
  • Get the best bang for your buck with ChartExpo. It offers a free 7-day trial and a monthly plan at just $10.

How to Install ChartExpo?

  1. Open your Excel application.
  2. Open the worksheet and click the “Insert” menu.
  3. You’ll see the “My Apps” option.
  4. In the office Add-ins window, click “Store” and search for ChartExpo on my Apps Store.
  5. Click the “Add” button to install ChartExpo.

ChartExpo charts are available both in Google Sheets and Microsoft Excel. Please use the following CTA’s to install the tool of your choice and create beautiful visualizations in a few clicks in your favorite tool.

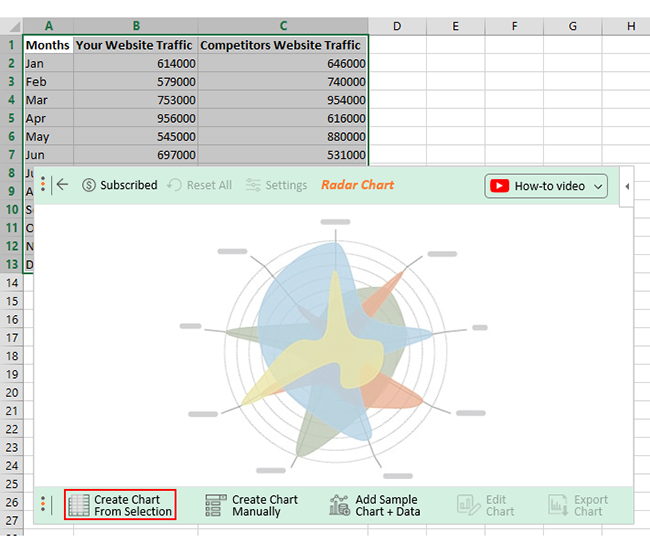
Let’s say you have your website and competitor’s website traffic data below. You want to analyze the data and see how your website performs relative to your competitor.

Months Your Website Traffic Competitors Website Traffic
Jan 614000 646000
Feb 579000 740000
Mar 753000 954000
Apr 956000 616000
May 545000 880000
Jun 697000 531000
Jul 677000 462000
Aug 742000 962000
Sep 512000 688000
Oct 750000 553000
Nov 659000 518000
Dec 849000 457000

We will be creating a Radar Chart in Excel for website traffic analysis of the above data. Follow the steps below to learn how to perform a free competitor website traffic analysis with ChartExpo.

  • To get started with ChartExpo, install ChartExpo in Excel.
  • Now Click on My Apps from the INSERT menu.
insert chartexpo in excel
  • Choose ChartExpo from My Apps, then click Insert.
open chartexpo in excel
  • Once it loads, choose the “Radar Chart” from the charts list.
search radar chart in excel
  • Click the “Create Chart From Selection” button after selecting the data from the sheet, as shown.
Create Chart From Selection ce427
  • ChartExpo will generate the visualization below for you.
Analyze Competitor Website Traffic Design Template
  • If you want to have the chart’s title, click Edit Chart, as shown in the above image.
  • Click the pencil icon next to the Chart Header to change the title.
  • It will open the properties dialog. Under the Text section, you can add a heading in Line 1 and enable Show.
  • Give the appropriate title of your chart and click the Apply button.
  • Click the “Save Changes” button to persist the changes.
Apply Title on Chart ce427
  • Your final chart will appear below.
Final Analyze Competitor Website Traffic

Insights

  • Strong Seasonal Patterns

Both your website and your competitor’s website demonstrate noticeable fluctuations in traffic throughout the year. This can be attributed to several factors, including holidays, promotions, and industry trends.

  • Peak Months

Your competitor’s website consistently receives high traffic in March, May, and August. These months probably coincide with specific events or campaigns that attract more visitors to their site.

  • Varied Peaks

Your competitor’s peak months do not align with your website’s high-traffic periods. Your website experienced the highest influx of visitors in April, June, and December. This disparity could be attributed to unique content, promotions, or other factors that attract visitors during these periods.

  • Lowest Months

Your competitive analysis reveals that your website experienced low traffic during May and September, while your competitors tend to have low traffic in July and December. These fluctuations in traffic could be attributed to a general industry trend or a decrease in online activity during those specific months.

  • Traffic Fluctuations

The traffic on both websites exhibits month-to-month fluctuations, highlighting the dynamic nature of online traffic. Keeping track of these fluctuations can assist you in adjusting your strategies accordingly.

FAQs

What is competitor analysis?

Competitor analysis is scrutinizing rivals to gain insights into their strategies, strengths, and weaknesses. It helps you understand your competitive landscape and make informed decisions to stand out in the market.

How do you Analyze competitor website traffic?

To analyze competitor website traffic, identify rivals, and study their traffic sources, popular pages, and user demographics. Evaluate keywords, content, backlinks, and social media presence. This intel informs your strategies and enhances your competitive edge.

What is the tool to measure website traffic?

Google Analytics is an extensively employed tool for gauging website traffic. It provides insights into visitor actions, traffic sources, popular pages, and additional details. This data helps you understand your audience and make informed website optimization and marketing strategy decisions.

Wrap Up

Analyzing competitor website traffic is your backstage pass to unveiling their strategies. Utilizing the right tools and techniques helps you gain valuable insights into competitors’ online presence and performance. This allows you to identify improvement areas, spot trends, and strategize to stay ahead in the market.

And guess what? Unveiling rival strategies isn’t the epic saga it used to be. Google Analytics, your trusty steed, is here to simplify the adventure.

It’s like deciphering secret scrolls pretty darn easy if you ask me.

With a few clicks and keystrokes, you can dissect traffic sources, decipher keywords, and map competitor content journeys. This helps to identify gaps in content, SEO strategies, and marketing efforts, leading to more targeted campaigns.

But here’s the plot twist: Google Analytics does have its limits when it comes to visual storytelling. Therefore, it needs a superhero boost.

This is where ChartExpo comes into play.

With ChartExpo at your disposal, you’re not just analyzing. You’re strategizing, optimizing, and giving your rivals a run for their digital treasure.

Do not hesitate.

Embrace the numbers, seize the insights, and rock the online arena like a data-powered maestro.

How much did you enjoy this article?

ExcelAd2
Start Free Trial!
129219

Related articles

next previous
Microsoft Excel8 min read

Excel Task Tracker Template for Smarter Task Insights

Task tracker template in Excel organizes tasks, tracks deadlines, and boosts efficiency. Learn its benefits, and explore expert tips to simplify task management.

Microsoft Excel10 min read

Invoice Tracker Template in Excel for Better Insights

An invoice tracker Excel template helps track invoices, due dates, and payments. Learn how to use this template for better financial management.

Microsoft Excel12 min read

Key Performance Indicators in Healthcare for Better Insights

Key Performance Indicators in healthcare track patient care and efficiency. Learn about these KPIs, top examples, and how to use them to improve outcomes.

Microsoft Excel10 min read

BMI Calculation Formula in Excel for Better Fitness Insights

The BMI calculation formula in Excel helps track and analyze body mass index. Explore step-by-step instructions and tips to simplify BMI tracking in Excel.

Microsoft Excel29 min read

How to Create a Tornado Chart in Excel? A Complete Guide

Click to learn how to plot a Tornado Chart in Excel using easy-to-follow steps. Also, we’ll address the following question: what is a Tornado Diagram?

ChartExpo logo

Turn Data into Visual
Stories

CHARTEXPO

  • Home
  • Gallery
  • Videos
  • Services
  • Pricing
  • Contact us
  • FAQs
  • Privacy policy
  • Terms of Service
  • Sitemap

TOOLS

  • ChartExpo for Google Sheets
  • ChartExpo for Microsoft Excel
  • Power BI Custom Visuals by ChartExpo
  • Word Cloud

CATEGORIES

  • Bar Charts
  • Circle Graphs
  • Column Charts
  • Combo Charts
  • Comparison Charts
  • Line Graphs
  • PPC Charts
  • Sentiment Analysis Charts
  • Survey Charts

TOP CHARTS

  • Sankey Diagram
  • Likert Scale Chart
  • Comparison Bar Chart
  • Pareto Chart
  • Funnel Chart
  • Gauge Chart
  • Radar Chart
  • Radial Bar Chart
  • Sunburst Chart
  • see more
  • Scatter Plot Chart
  • CSAT Survey Bar Chart
  • CSAT Survey Chart
  • Dot Plot Chart
  • Double Bar Graph
  • Matrix Chart
  • Multi Axis Line Chart
  • Overlapping Bar Chart
  • Control Chart
  • Slope Chart
  • Clustered Bar Chart
  • Clustered Column Chart
  • Box and Whisker Plot
  • Tornado Chart
  • Waterfall Chart
  • Word Cloud
  • see less

RESOURCES

  • Blog
  • Resources
  • YouTube
SIGN UP FOR UPDATES

We wouldn't dream of spamming you or selling your info.

© 2025 ChartExpo, all rights reserved.