Categories
Web analytics refers to gathering, examining, and reporting web data. It gives you information on how well your website performs.
For a better understanding of the value of web analytics, let’s look at a case study.
Increased internet traffic and conversions were priorities for the marketing department of a certain company. Despite their best efforts, they were unable to succeed.


They discovered the website needed to be user-experience optimized after doing some research.
They had to measure and analyze the website’s performance to understand user behavior and make the required adjustments.
They opted to use web analytics to study the performance of their website. Thus, they developed a web analytics dashboard to track the top website metrics. This enabled them to tweak their website for improved user experience and increased conversions.
Keep reading to learn about web analytics and how to create a web analytics dashboard in Excel.
Definition: A Web Analytics Dashboard is a visual tool that consolidates key metrics and data related to website performance. It provides insights into user behavior, traffic sources, conversions, and other important statistics in real time or over a specified period. The dashboard typically includes tables charts and graphs, and that makes it easy to track metrics such as page views, bounce rate, session duration, and user demographics.
By using a web analytics dashboard, businesses can monitor and analyze their website’s effectiveness, identify trends, and make data-driven decisions to improve user experience and achieve business goals. Common platforms for web analytics dashboards include Google Analytics, Adobe Analytics, and various third-party tools.
Building a Web Analytics Dashboard is highly beneficial because it allows businesses to track and visualize key website metrics in one place. Here are the main advantages:
A dashboard offers real-time insights into website performance, helping businesses track traffic, user behavior, and conversions as they happen.
It provides actionable data that can inform strategic decisions, such as optimizing content, improving user experience, or refining marketing campaigns through a marketing analytics platform.
Dashboards can be tailored to display specific metrics that matter most to your business, ensuring you focus on what drives results.
Anomalies like a sudden traffic drop or high bounce rates are easily spotted, allowing for immediate corrective actions.
Dashboards simplify reporting by providing a visual overview that is easy to share with stakeholders, streamlining decision-making and collaboration.
Web analytics has several metrics you can track. You can use these metrics to measure website performance and user behavior.
The top website metrics to include in an analytics report include:
An analytics dashboard consolidates data from multiple sources into a single view, making it easier to track performance metrics and gain insights without switching between different tools.
Dashboards offer instant insights into key performance indicators (KPIs), enabling businesses to swiftly adapt to changes and refine their strategies in real time.
By presenting data visually, analytics dashboards help stakeholders understand trends and patterns quickly, leading to informed, data-driven decisions that can improve overall business performance.
Dashboards can be tailored to display specific metrics that are relevant to various teams or departments, ensuring that everyone has access to the information that matters most to them.
Dashboards streamline the reporting process by offering visual representations of data, which can be easily shared with stakeholders, reducing the time spent on creating reports and presentations.
With visual data representation, dashboards make it easier to spot trends and anomalies in performance, enabling proactive measures to be taken to address issues or capitalize on opportunities.
Let’s say you have website traffic data and wish to determine the overall traffic. You also want to determine which social media sites generate the highest traffic. Thus, you can focus on the sites that are not doing well.
The data is displayed below.
| From | Sources | Web Pages | Traffic |
| Product Page | Checkout Page | 10831 | |
| Product Detail Page | Contact us | 22121 | |
| Product Detail Page | Checkout Page | 26751 | |
| Home Page | Product Page | 28240 | |
| Home Page | Contact us | 24506 | |
| Direct | Home Page | Product Detail Page | 28166 |
| Direct | Product Page | Product Detail Page | 28074 |
| Direct | Contact us | 10779 | |
| Direct | Product Page | Checkout Page | 11449 |
| Direct | Product Detail Page | Contact us | 19316 |
| Product Detail Page | Checkout Page | 27440 | |
| Home Page | Product Page | 16351 | |
| Home Page | Contact us | 28424 | |
| Home Page | Product Detail Page | 24986 | |
| Product Page | Product Detail Page | 10182 | |
| Contact us | 18607 | ||
| Product Page | Checkout Page | 18375 | |
| Product Detail Page | Contact us | 10815 | |
| Product Detail Page | Checkout Page | 22742 | |
| Home Page | Product Page | 28432 | |
| Google Ads | Home Page | Contact us | 17722 |
| Google Ads | Home Page | Product Detail Page | 11160 |
| Google Ads | Product Page | Product Detail Page | 11722 |
| Google Ads | Contact us | 19854 | |
| Google Ads | Product Page | Checkout Page | 21936 |
| SERP | Product Detail Page | Contact us | 23250 |
| SERP | Product Detail Page | Checkout Page | 26512 |
| SERP | Home Page | Product Page | 10236 |
| SERP | Home Page | Contact us | 22565 |
| SERP | Home Page | Product Detail Page | 17076 |
| SERP | Product Page | Product Detail Page | 24402 |
| SERP | Contact us | 27724 |
Here is the final visualization.

Here, we will use Geo, Sources, and Web Pages data.
| Geo | Sources | Web Pages | Traffic |
| Boston | Product Page | Checkout Page | 10831 |
| Boston | Product Detail Page | Contact us | 22121 |
| Boston | Product Detail Page | Checkout Page | 26751 |
| Boston | Home Page | Product Page | 28240 |
| Boston | Home Page | Contact us | 24506 |
| Boston | Home Page | Product Detail Page | 28166 |
| Boston | Product Page | Product Detail Page | 28074 |
| Boston | Contact us | 10779 | |
| Austin | Product Page | Checkout Page | 11449 |
| Austin | Product Detail Page | Contact us | 19316 |
| Austin | Product Detail Page | Checkout Page | 27440 |
| Austin | Home Page | Product Page | 16351 |
| Austin | Home Page | Contact us | 28424 |
| Austin | Home Page | Product Detail Page | 24986 |
| Austin | Product Page | Product Detail Page | 10182 |
| Austin | Contact us | 18607 | |
| Phoenix | Product Page | Checkout Page | 18375 |
| Phoenix | Product Detail Page | Contact us | 10815 |
| Phoenix | Product Detail Page | Checkout Page | 22742 |
| Phoenix | Home Page | Product Page | 28432 |
| Phoenix | Home Page | Contact us | 17722 |
| Phoenix | Home Page | Product Detail Page | 11160 |
| Phoenix | Product Page | Product Detail Page | 11722 |
| Phoenix | Contact us | 19854 | |
| Dallas | Product Page | Checkout Page | 21936 |
| Dallas | Product Detail Page | Contact us | 23250 |
| Dallas | Product Detail Page | Checkout Page | 26512 |
| Dallas | Home Page | Product Page | 10236 |
| Dallas | Home Page | Contact us | 22565 |
| Dallas | Home Page | Product Detail Page | 17076 |
| Dallas | Product Page | Product Detail Page | 24402 |
| Dallas | Contact us | 27724 |
Here is the final visualization.

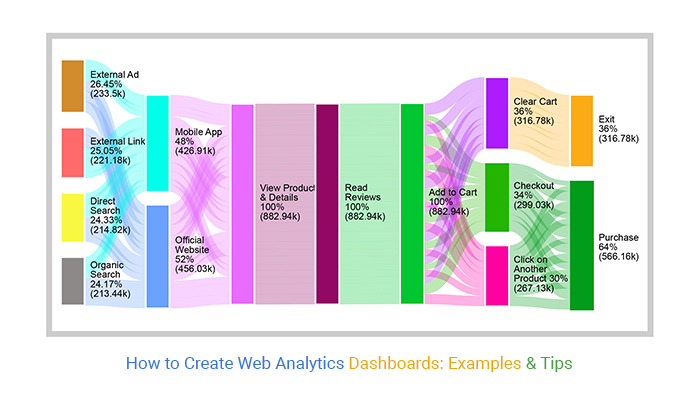
This is data of traffic from an e-commerce store.
| Starting Point | Platforms | View product & details | Read Reviews | Add to Cart | Cart Status | Ending Point | Traffic |
| External Ad | Mobile App | View product & details | Read Reviews | Add to Cart | Clear Cart | Exit | 29246 |
| External Ad | Mobile App | View product & details | Read Reviews | Add to Cart | Checkout | Purchase | 6133 |
| External Ad | Mobile App | View product & details | Read Reviews | Add to Cart | Click on another product | Purchase | 12954 |
| External Ad | Mobile App | View product & details | Read Reviews | Add to Cart | Clear Cart | Exit | 22337 |
| External Ad | Mobile App | View product & details | Read Reviews | Add to Cart | Checkout | Purchase | 14685 |
| External Ad | Mobile App | View product & details | Read Reviews | Add to Cart | Click on another product | Purchase | 10210 |
| External Link | Mobile App | View product & details | Read Reviews | Add to Cart | Clear Cart | Exit | 29605 |
| External Link | Mobile App | View product & details | Read Reviews | Add to Cart | Checkout | Purchase | 27600 |
| External Link | Mobile App | View product & details | Read Reviews | Add to Cart | Click on another product | Purchase | 5637 |
| External Link | Mobile App | View product & details | Read Reviews | Add to Cart | Clear Cart | Exit | 23336 |
| External Link | Mobile App | View product & details | Read Reviews | Add to Cart | Checkout | Purchase | 28281 |
| External Link | Mobile App | View product & details | Read Reviews | Add to Cart | Click on another product | Purchase | 17939 |
| Direct Search | Mobile App | View product & details | Read Reviews | Add to Cart | Clear Cart | Exit | 5490 |
| Direct Search | Mobile App | View product & details | Read Reviews | Add to Cart | Checkout | Purchase | 19138 |
| Direct Search | Mobile App | View product & details | Read Reviews | Add to Cart | Click on another product | Purchase | 27311 |
| Direct Search | Mobile App | View product & details | Read Reviews | Add to Cart | Clear Cart | Exit | 19560 |
| Direct Search | Mobile App | View product & details | Read Reviews | Add to Cart | Checkout | Purchase | 24788 |
| Direct Search | Mobile App | View product & details | Read Reviews | Add to Cart | Click on another product | Purchase | 10914 |
| Organic Search | Mobile App | View product & details | Read Reviews | Add to Cart | Clear Cart | Exit | 29043 |
| Organic Search | Mobile App | View product & details | Read Reviews | Add to Cart | Checkout | Purchase | 12028 |
| Organic Search | Mobile App | View product & details | Read Reviews | Add to Cart | Click on another product | Purchase | 24685 |
| Organic Search | Mobile App | View product & details | Read Reviews | Add to Cart | Clear Cart | Exit | 8508 |
| Organic Search | Mobile App | View product & details | Read Reviews | Add to Cart | Checkout | Purchase | 12448 |
| Organic Search | Mobile App | View product & details | Read Reviews | Add to Cart | Click on another product | Purchase | 5034 |
| External Ad | Official Website | View product & details | Read Reviews | Add to Cart | Clear Cart | Exit | 23552 |
| External Ad | Official Website | View product & details | Read Reviews | Add to Cart | Checkout | Purchase | 19632 |
| External Ad | Official Website | View product & details | Read Reviews | Add to Cart | Click on another product | Purchase | 18914 |
| External Ad | Official Website | View product & details | Read Reviews | Add to Cart | Clear Cart | Exit | 19234 |
| External Ad | Official Website | View product & details | Read Reviews | Add to Cart | Checkout | Purchase | 26871 |
| External Ad | Official Website | View product & details | Read Reviews | Add to Cart | Click on another product | Purchase | 29736 |
| External Link | Official Website | View product & details | Read Reviews | Add to Cart | Clear Cart | Exit | 14141 |
| External Link | Official Website | View product & details | Read Reviews | Add to Cart | Checkout | Purchase | 10680 |
| External Link | Official Website | View product & details | Read Reviews | Add to Cart | Click on another product | Purchase | 23756 |
| External Link | Official Website | View product & details | Read Reviews | Add to Cart | Clear Cart | Exit | 18491 |
| External Link | Official Website | View product & details | Read Reviews | Add to Cart | Checkout | Purchase | 15740 |
| External Link | Official Website | View product & details | Read Reviews | Add to Cart | Click on another product | Purchase | 5976 |
| Direct Search | Official Website | View product & details | Read Reviews | Add to Cart | Clear Cart | Exit | 19080 |
| Direct Search | Official Website | View product & details | Read Reviews | Add to Cart | Checkout | Purchase | 22204 |
| Direct Search | Official Website | View product & details | Read Reviews | Add to Cart | Click on another product | Purchase | 22736 |
| Direct Search | Official Website | View product & details | Read Reviews | Add to Cart | Clear Cart | Exit | 25578 |
| Direct Search | Official Website | View product & details | Read Reviews | Add to Cart | Checkout | Purchase | 11141 |
| Direct Search | Official Website | View product & details | Read Reviews | Add to Cart | Click on another product | Purchase | 6881 |
| Organic Search | Official Website | View product & details | Read Reviews | Add to Cart | Clear Cart | Exit | 18022 |
| Organic Search | Official Website | View product & details | Read Reviews | Add to Cart | Checkout | Purchase | 21183 |
| Organic Search | Official Website | View product & details | Read Reviews | Add to Cart | Click on another product | Purchase | 15307 |
| Organic Search | Official Website | View product & details | Read Reviews | Add to Cart | Clear Cart | Exit | 11557 |
| Organic Search | Official Website | View product & details | Read Reviews | Add to Cart | Checkout | Purchase | 26480 |
| Organic Search | Official Website | View product & details | Read Reviews | Add to Cart | Click on another product | Purchase | 29140 |
This is the final visualization.

A Website KPI Dashboard is a powerful tool that visualizes essential website metrics such as traffic, user behavior, conversions, and bounce rates. It helps businesses monitor real-time performance, make data-driven decisions, and identify opportunities for website optimization and growth.
Google Analytics 4 (GA4) is the latest version of Google’s analytics platform, focusing on event-based tracking to provide deeper insights into user behavior across websites and apps. It offers cross-platform tracking, machine learning-powered insights, and enhanced privacy controls, helping businesses better understand the customer journey and make data-driven decisions.
Creating a web analytics dashboard in Excel is vital for an in-depth evaluation of your website’s performance. You can learn crucial information about the performance of your website and pinpoint areas to improve.
You can create appealing analytics visuals with ChartExpo. Visuals that make it easy for website performance evaluation.
ChartExpo charts and graphs are available both in Google Sheets and Microsoft Excel. Please use the following CTA’s to install the tool of your choice and create beautiful visualizations in a few clicks in your favorite tool.
Let’s use example 3 to demonstrate how to create a web analytics dashboard on data of traffic from an e-commerce store in Excel.


This video will guide you in creating a Sankey Chart in Microsoft Excel, a powerful tool for visualizing website traffic and gaining deeper insights into the flow of your data. Integrate this with your Web Analytics Dashboard to bring clarity and precision to your analysis!
Including too many metrics can overwhelm users. Focus on key performance indicators (KPIs) that align with business goals to ensure clarity.
Without defined objectives, dashboards can become ineffective. Establish specific goals for what the dashboard should achieve to guide its design and metrics selection.
Poor design and navigation can make dashboards difficult to use. Prioritize a clean layout, intuitive navigation, and easy access to critical information.
Static dashboards can become outdated quickly. Implement a routine for updating data and metrics to ensure that insights remain relevant and actionable.
Excluding key stakeholders in the design process can lead to missed insights. Involve team members to understand their needs and ensure the dashboard meets diverse requirements.
Here are some tips for making a web analytics dashboard that works well:
A web analytics dashboard is a visual tool for data analysis on a website. It offers the user a thorough assessment of the website’s performance. Here, you can monitor key metrics such as website visitors, page views, bounce rate, and conversion rate.
A web analytics dashboard should include several types of data, such as;
The top website metrics to track in an analytics dashboard include;
A web analytics dashboard enables website owners to get insightful knowledge about the performance of their websites. You can use this information to spot patterns, and areas for improvement and make decisions on website optimization.
Everyone worries about the health of their business in today’s fast-paced economy. However, a basic web analytics dashboard can provide critical insights into your business. Thus, guide you toward the changes you need to succeed.
A web analytics dashboard can help you improve your business’s performance and boost revenue.
When designing and creating a web analytics dashboard, you can use Excel and make it interactive. This will bring in more holistic views of the performance of your website.
Using ChartExpo, you can create a web analytics dashboard in Excel in minutes. You can choose from various visualizations, such as charts and graphs.
These visualizations can help you make sense of your data and spot trends and patterns. Then you can make changes to your website and improve its performance.
How much did you enjoy this article?


Calculate accounts receivable turnover ratio to measure credit collection speed, improve cash flow, and strengthen your financial strategy. Read on!

Change Management KPIs are the key to tracking adoption, performance, and ROI during transitions. Find out which metrics matter. Read on!

Data collection methods and techniques determine the quality of every insight you act on. Explore key approaches for gathering reliable data. Read on!


