Categories
Businesses need customers to thrive. It’s a vital resource, the lifeblood of a successful company.
Yet, many companies wonder why they don’t have more customers.
Have you ever thought about asking your customers directly? Using Google Forms for survey questionnaires will change how you approach customer feedback.


Unfortunately, only some businesses utilize surveys as often and effectively as they should.
Using Google Forms for surveys offers a promising solution.
When you create a survey using Google Forms, these challenges diminish greatly. Using Google Forms for surveys provides a free, effective, and easy-to-use way to request, record, and analyze customer feedback.
This discussion will answer many key questions about using Google Forms for survey creation and audience analysis.
A survey in Google Forms is a digital questionnaire designed for gathering information, opinions, or feedback from respondents. Google Forms offers a user-friendly interface to create and distribute personalized Surveys.

It boasts an array of question types like multiple-choice, text, and rating scales, streamlining the survey data collection and analysis process. Moreover, the automatic compilation of results elevates its utility as a potent tool for research.
Google Survey Form offers a versatile and user-friendly platform for collecting valuable insights and feedback. With its intuitive interface and robust features, it simplifies the process of designing, distributing, and analyzing surveys, including longitudinal surveys that track responses over time.
Creating forms in Google is simple and efficient with Google Forms. This tool allows users to design surveys, quizzes and questionnaires seamlessly. You can choose from various templates or start from scratch, customize questions with multiple choice, text fields, checkboxes, and more, including options for creating a survey template in Excel if you prefer that format. Once you’ve designed your form, you can easily share it via a link, or email, or embed it on a website.
Once responses are collected, they are automatically compiled into a spreadsheet for easy analysis, making Google Forms an invaluable tool for gathering and organizing information.
Google Forms works almost like a Google Docs survey tool. It is easy to access and use. All you need is a Google account.
There are two ways to access Google Forms. The easiest is to enter ‘Google Forms’ into the search engine. It will be the first result.
You can also find the Google Forms tool by clicking the Google Apps icon on most Google sites. It looks like a grid of dots in the upper right corner next to your account icon.
Scroll down the list until you see the purple document Google Forms icon.
Need more guidance? Don’t worry, we will explain each step in detail in our next section
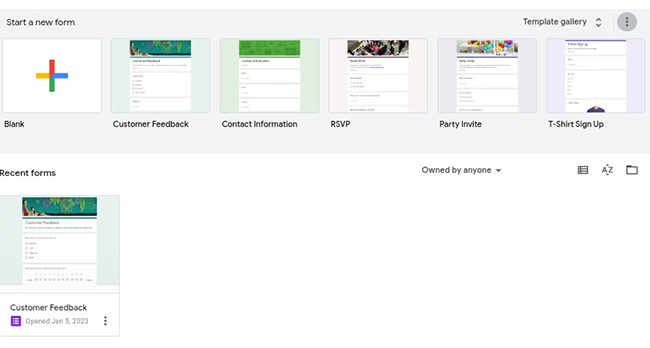
Once you open the Google Surveys tool, you’ll see some available templates for different types of Google Forms projects you can start.
You can also select whether you’re using the Google Survey Creator for business or Google Surveys for personal use, which will change the types of document templates and survey examples it suggests.
If you don’t want to use one of the templates, click the “Blank” option(just look for the multi-colored ‘+’ sign).
With a blank Google Forms page it will always open with ‘Untitled form: Click on Untitled form to change the name of Google Forms for the survey. You have complete freedom to customize your Google Forms surveys. (You can also edit any components within the available Google Forms Survey templates).
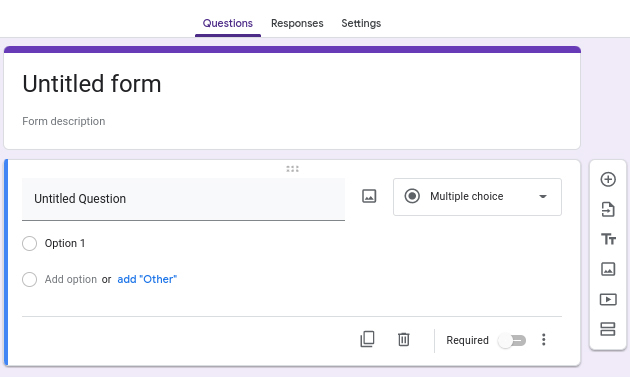
There are a few features to pay attention to when you create a survey in Google Forms. The toolbar of options along the right side allows you to add images and videos to your forms.
You can also add questions or divide a questionnaire into multiple sections.
You can use the dropdown menu next to the question title to select which type of survey question you ask.

No matter what survey method you choose, there is a range of different types of questions you can ask participants.
If you’re creating long online surveys in Google Forms, it is wise to utilize multiple types of questions. This will prevent your Google Docs questionnaires from becoming redundant or unengaging to participants.
Sometimes, you want to give survey takers several options to choose from. After all, variety makes the survey more fun for the participant and offers greater detail in your data.
You can strategically select your multiple-choice options to provide you with a specific insight. Here is an example:

This survey question example gives you valuable insight into customers’ dining habits.
There are many ways to strategically use multi-choice Google Forms questionnaires to discover actionable intelligence about your customers and business.
The beauty of rating scale questions is they are exceptionally easy to understand and answer. It also offers a way for survey takers to quantify their feelings.
It’s easy to say, ‘I like this,’ or, ‘I don’t like this.’ That doesn’t answer how much you like it. This is precisely what rating scales answer.
When you make a Google survey that uses a rating scale, it is best to keep your range as tight as possible. You don’t want to ask participants to rate your business on a scale of 1-100. That is too much variation. The max scale you want to use is 0-10.

Likert scales are great survey tools, but most are subjective by nature. When you ask someone to rate 1-10, there isn’t a clear understanding of what each score represents. What one person considers a ‘7’ experience is different from the next survey participant.
The Likert system tries to remove this subjectivity by using a scale that puts emotions on a clear continuum. The 5-point Likert scale is the most common. It gives extremely low, low, neutral, high, and extremely high options.

You could use the same scale but change the answers to range from ‘Very dissatisfied’ to ‘Very satisfied’ or ‘Very bad’ to ‘Very good.’
Matrix questions generate lots of Google Form responses under one heading. Instead of asking individual Likert or other scale survey questions, you can pose multiple at once. This creates a grid-like matrix where respondents can select the answers that fit their sentiments.
Here is a matrix survey example question:

This simple grid saves lots of time and makes your Google Forms for survey questionnaires look cleaner and more concise. You’re essentially asking five questions about different car manufacturers in one.
Multiple-choice questions can look messy when there are too many options. It makes your Google Forms look overwhelming. Remember, your survey participants don’t need much reason to click away and abandon your Google Forms questionnaires!
A great alternative is dropdown questions. This offers a straightforward question with the option to click for a list of possible responses. Here is an example:

When the survey taker clicks the dropdown menu, they see a list of possible options.

Open-ended questions are valuable for several reasons. It encourages the audience to share their feelings, allowing them to share feedback that wasn’t addressed in your other questions.

The other use is asking for context behind the individual’s scores. If they mark they are extremely dissatisfied with customer service feedback, you want to know why.
Open-ended questions do have some drawbacks. Responses may be irrelevant or specific to a very isolated incident. Moreover, open-ended Google Forms responses are difficult to analyze because it is raw text.
When you want to conduct market research, demographic questions are your answer. In this case, it isn’t how you ask your questions (multiple choice, scale, etc.). It’s about what you’re asking.
The objective here is to find out about your customers. So, you might ask something as basic as:

When you offer many different products or services, it is helpful to know which ones customers prefer. Ranking survey questions give you a chance to hear about the audience’s favorites, second favorites, third favorites, and so on.
By ranking available items, you better understand how customers compare each of your offerings. This insight is invaluable when deciding how to spend your marketing budget or which new direction to nudge the company.

Google Forms is also very smart at predicting what you intend to do. For instance, if you start typing the title of your question as “Rate your experience today,” the Google survey maker will automatically change the question type from multiple choice to linear scale.
This simple feature makes learning how to use Google Forms for surveys incredibly easy. It practically does the work for you!

You’ll also find many useful options under the Settings tab at the top. You should explore these features before you finalize your Google Forms project.
When you finish using the Google Survey Creator and complete your questionnaire, the purple “Send” button at the top is how you can deliver your Google Forms document to others.
You can opt to send your survey through emails or via a link.

You can embed it on your website or share it using Facebook and Twitter.
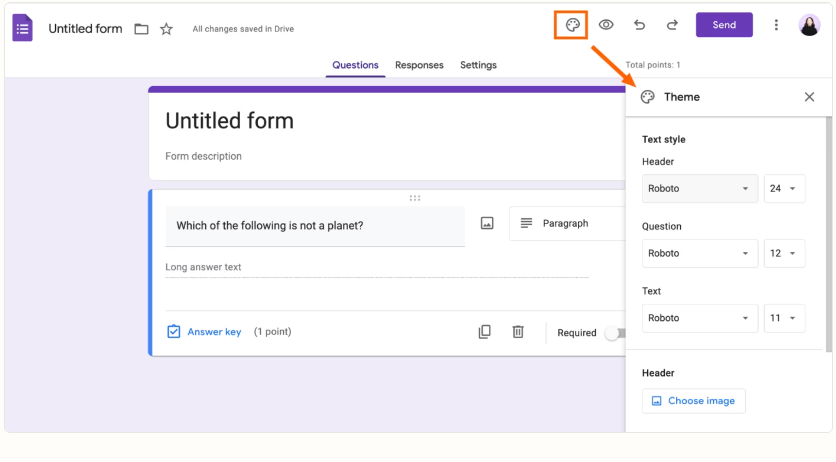
To change the design of a Google Form, open the form, click on “Customize Theme,” choose a theme or customize colors and fonts, preview the changes, and save them before sharing the form with respondents.
Once your form is finished, be sure to check the form settings before sharing it with the world. Here are some fields you may want to pay extra attention to.
The Google Forms survey maker lets you move your results from Google Forms to Google Sheets with just one click.
Under the “Responses” tab, you’ll see your total survey responses and data. In the upper right corner, you’ll notice the green Google Sheets icon.

This button gives you two options. You can create a new spreadsheet with data from your Google Forms responses. Alternatively, you can opt to add the data to an existing spreadsheet.
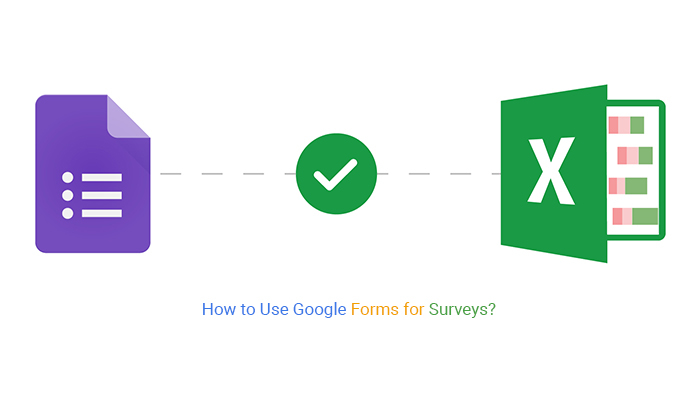
Exporting results from Google Forms to Excel is also effortless. Instead of clicking the green Google Sheets icon to make a spreadsheet, select the three dots to the right.

This creates a dropdown menu with the option to “Download responses (.csv)” as an Excel-ready file. Save this file somewhere accessible and open it with Excel to see your survey data in this spreadsheet environment.
With your Google Forms survey data now in Excel, the fun part can begin. This is the point where you can begin analyzing responses, digging into the feedback, and discovering audience insights.
It’s the point in the process where your data becomes actionable. You can start making positive changes to your strategies based on your discoveries.
Did you know there are several charts designed specifically for survey data? For example, the Likert Scale Chart is great when you’re using a rating scoring system in your questionnaires. Additionally, the Box And Whisker plot is useful for visualizing the distribution and variability of responses, providing a clear picture of data spread and outliers.
ChartExpo is an excellent tool to use with Excel. It makes creating Likert Scale Charts and many other survey data visualizations exceptionally easy.
Using this tool is very simple. It eliminates all of the usual obstacles associated with chart making.
Using Google Forms, you can create and share various document deliverables effortlessly. Some people consider it as simply a Google Docs survey tool. However, it is so much more than that.
Google Forms is its tool where you can create Google surveys for free. You can also use the tool to make feedback forms, party invites, sign-up sheets, and more.
With all the different templates and features available, Google Forms is an exceptionally robust survey tool. It is one of the most powerful free survey creators out there. All you need is a Google account.
The underlying use of Google Forms is to understand your target audiences better. Whenever you create a form, results appear instantly. So, when the first person completes a survey or questionnaire, the results are immediately accessible.
All of the data and insights come to your Google Forms page. You don’t need additional software or tools to analyze it. If you want to export it to Google Sheets, you can do so with just one click!
Thanks to the agility of Google Forms for survey data, you can monitor audience sentiments and insights directly. You’ll always be one step ahead of any shifts in attitudes.
Plus, you’ll have the foresight to detect new trends worth exploring. Now let’s discuss Google Forms survey types to use in your next survey according to your goals.
Let’s look at some of the advantages that make Google Forms for surveys the best.
Online survey questionnaires are a broad category encompassing many different types. Similar to collection methods, each survey type fills a specific role or need.
Understanding each survey approach helps you learn what method to use and when.
The NPS survey approach helps an organization understand how many brand promoters exist. The NPS Score gives you a single number reflective of how likely a customer or client is to recommend your brand or product.
Because of this, traditional NPS surveys ask a single question: “How likely would you recommend [brand or product]?” Many survey examples will then ask respondents to explain their answers.
Alternatively, you can include multiple NPS survey questions in a single Google Forms survey to see which questions provide the greatest insight into the audience’s mindset.
To be successful, businesses need to know their target market as intimately as possible. Market research surveys ask questions that help companies get to know their audience and customers.
The goal of a market research survey is to get Google Forms responses that answer questions like:
Another vital success factor in business is knowing what’s working and what isn’t. These are details you can only learn from customers.
Customer satisfaction surveys help showcase what’s making customers happy or dissatisfied. The insights from these questionnaires will highlight areas that need improvement and what the most successful dimensions of your business are.
Most of the above survey types focus on gathering customer or audience insights. However, knowing what your employees think and feel about your company and their roles is equally valuable.
After all, happy employees are more productive and stay longer.
Employee satisfaction surveys give these individuals a constructive way to provide feedback. Often, these questionnaires are anonymous, ensuring workers can speak candidly and without fear of penalty.
This is a type of online survey form specific to events. You would make a Google survey questionnaire to give to participants after the event ends.
Some examples of post-event survey questions include:
Microsoft Excel lacks survey charts like the Likert Scale Chart. You don’t have to discard the spreadsheet application.
We recommend you install the ChartExpo add-in to access a ready-made and visually stunning Likert Scale Chart to visualize survey results.
ChartExpo is an add-in you can install in Microsoft Excel to access the Likert Scale Chart, plus many other charts.
It will take you minutes to create a chart using ChartExpo. Besides, it comes with more formatting capabilities to ensure your charts and graphs align with your needs and preferences.
The ChartExpo add-in costs $10 a month.
In the coming section, we’ll show you how to visualize Google Forms survey data using a Likert Scale Chart.
ChartExpo is a chart maker that is available both in Google Sheets and Microsoft Excel. Please use the following CTA’s to install the tool of your choice and create beautiful visualizations in a few clicks in your favorite tool.
Let’s say you want to do a customer satisfaction through a Google Forms survey. For this, you make an online customer survey and gather all data. First, let’s have a look at the questions that you have asked customers:
Now, let’s have a look at a scale that is mapped with these questions:
Your data will look like below.
| Responses | How satisfied are you with the variety of products offered by the store? | How much satisfied are you in finding the product in the store? | How much satisfied are you with the product price? | How much satisfied are you with the checkout process? |
| Response 1 | Extremely dissatisfied | Neutral | Extremely dissatisfied | Extremely satisfied |
| Response 2 | Neutral | Satisfied | Extremely satisfied | Dissatisfied |


When it is time to visualize Google Forms survey data results, you have several options. That said, aligning the right chart with your survey results requires some consideration.
You want to be sure you pick a visualization that will provide the best insights into your survey results.
Here are some different graphs for survey data to consider.
Including Likert rating scales in your Google Forms surveys and questionnaires is an excellent way to get clear results from the audience. Most rating scales you see follow the Likert approach because of its clarity and insightful results.
ChartExpo’s Likert Scale Chart is helpful for surveys that include this rating system. In the following example, the Likert Scale Chart results from a Google survey for customer satisfaction.

You can thoroughly understand the results just by visually analyzing this chart!
The NPS Score is a popular way to evaluate brand promoters, making it clear how customers feel about your business and products.
The CSAT Score Bar Chart aims to visualize NPS survey data, giving you your score on one axis and the number of survey participants on another. The latter metric helps you measure the accuracy of the results because more survey takers mean a more accurate NPS value.

The CSAT Score Survey Chart is another visualization for NPS survey data. This chart provides a more detailed view of how audiences responded. It’s particularly helpful when you create a survey using Google Forms that incorporates a broader scale.
However, you should be critical of which ranges you set as brand promoters, neutrals, and detractors. In the below example, the survey creator chose scores of 8, 9, or 10 to represent the promoters category.
You may decide only scores of 9 and 10 are true brand promoters instead.

Here is another ChartExpo data visualization intended for Google Forms survey data. The Customer Satisfaction Chart helps you quickly identify the items that are working and not.
When an item has high negative responses, you see the red bar in the left column. Survey items with high positive scores appear on the right. It’s an incredibly efficient survey chart for recognizing your strengths and weaknesses.

This survey chart uses the combined power of bar graphs and a line chart to demonstrate customer responses to your questionnaire items. In the following survey example chart, the line and bars give you two ways to see where customer sentiments are highest and lowest.

A sentiment trend survey chart is beneficial when you want to see how attitudes have changed over time.


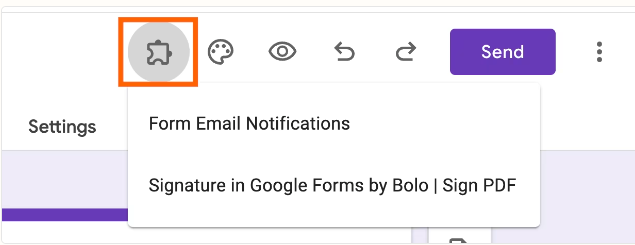
‹®).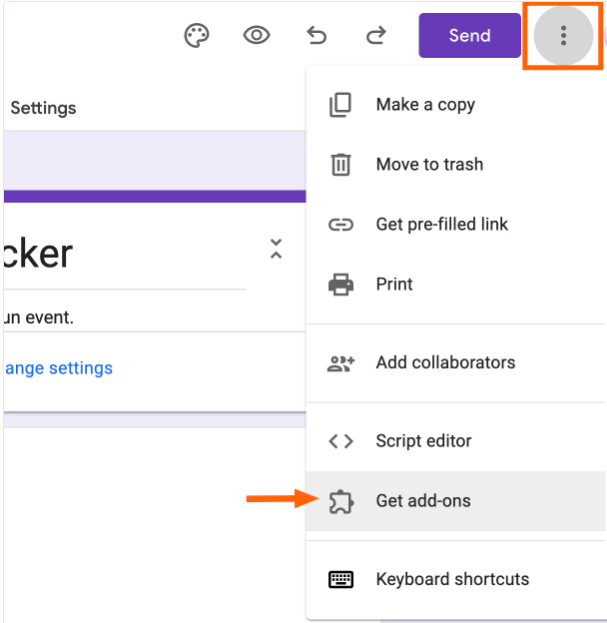
Search and install the add-on you want.
Charts and other data visualizations are always the best way to analyze survey data in Excel. When you can visually see the results, understanding the insights and stories behind all the survey responses becomes much easier.
Some examples of survey charts include:
Because there are so many different survey types and approaches to gathering feedback data, there is no single “best survey chart.” Instead, incorporating audience analysis into your process allows you to think critically about your survey analysis project and select the chart type that best aligns with your specific goals and audience preferences.
That said, the survey charts offered by ChartExpo are all compelling visualizations to help you make sense of your questionnaire data.
Using Google Forms you can ask virtually any type of survey. The Google Survey Creator tool gives you the option to select any of these options:
With these options, you can create any survey question types mentioned earlier in this discussion (rating scales, open-ended questions, ranking questions, matrix, and others).
There are a few crucial elements to include when using Google Forms for survey reporting.
You want a title page, a table of contents, and a summary of the results. This will give viewers an introduction to why you created the survey and the intended objectives.
Next, you should discuss your survey methods and the results. You may even want to include the Google Forms questionnaire you created.
The final step is to end with a conclusion and a plan or suggestion for how to respond to the survey insights.
Your business depends on customers, but customers don’t depend on you. They have plenty of other options. All they have to do is hop on Google and search.
Thus, distinguishing yourself through lower prices or higher quality goods and services is less effective than it once was. What your target audience wants are relevant, frictionless experiences.
In other words, customers have expectations and they expect you should know them. If you don’t or can’t deliver on these desires, they’ll look elsewhere.
Oh, and don’t expect these expectations or desires to stay the same for long. Customer attitudes and feelings are constantly shifting and evolving.
The only true way to get inside the mind of your target audience is to ask them directly.
Google Forms for surveys is the best tool to do this.
Creating surveys on Google Forms is a free and effective strategy. With this survey tool, you can begin communicating with your audience and extracting valuable insights.
To recap, here are some of the benefits when you create surveys in Google Forms:
Combining the power of Google Forms for surveys with ChartExpo solves any challenges regarding analyzing results. You can make survey charts in minutes.
ChartExpo’s visualizations enable you to visually extract audience insights instantly. You’ll see what you’ve been missing from your Google Forms responses.
In a short time of using these tools together, you’ll begin developing outstanding experiences. Customers will respond with return business and ongoing brand promotion, growing your business further.
If you find yourself struggling to stay ahead of customer trends, Google Forms can help. You may also need help acquiring and responding to feedback swiftly.
Using ChartExpo’s survey visualizations with Google Forms questionnaires solves this problem.
Your customers are talking. It’s time to start listening.
How much did you enjoy this article?


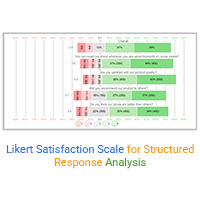
Discover what a Likert Satisfaction Scale is, its structure, and why it’s used in customer and employee feedback surveys.
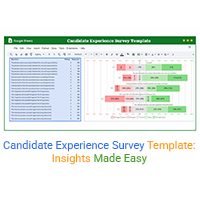
A candidate experience survey template collects hiring feedback. Click here to learn when to send it, what to ask, and how to analyze the results.

Discover real-world Voice of Customer examples that show how businesses collect feedback, improve experiences, and build stronger customer relationships.