• Home
  • Tools dropdown img
    • Spreadsheet Charts

      • ChartExpo for Google Sheets
      • ChartExpo for Microsoft Excel
    • Power BI Charts

      • Power BI Custom Visuals by ChartExpo
    • Word Cloud

  • Charts dropdown img
    • Chart Category

      • Bar Charts
      • Circle Graphs
      • Column Charts
      • Combo Charts
      • Comparison Charts
      • Line Graphs
      • PPC Charts
      • Sentiment Analysis Charts
      • Survey Charts
    • Chart Type

      • Box and Whisker Plot
      • Clustered Bar Chart
      • Clustered Column Chart
      • Comparison Bar Chart
      • Control Chart
      • CSAT Survey Bar Chart
      • CSAT Survey Chart
      • Dot Plot Chart
      • Double Bar Graph
      • Funnel Chart
      • Gauge Chart
      • Likert Scale Chart
      • Matrix Chart
      • Multi Axis Line Chart
      • Overlapping Bar Chart
      • Pareto Chart
      • Radar Chart
      • Radial Bar Chart
      • Sankey Diagram
      • Scatter Plot Chart
      • Slope Chart
      • Sunburst Chart
      • Tornado Chart
      • Waterfall Chart
      • Word Cloud
    • Google Sheets
      Microsoft Excel
  • Services
  • Pricing
  • Contact us
  • Blog
  • Support dropdown img
      • Gallery
      • Videos
      • Contact us
      • FAQs
      • Resources
    • Please feel free to contact us

      atsupport@chartexpo.com

Categories
All Data Visualizations Data Analytics Surveys
Add-ons/
  • Google Sheets
  • Microsoft Excel
  • Power BI
All Data Visualizations Data Analytics Surveys
Add-ons
  • Google Sheets
  • Microsoft Excel
  • Power BI

We use cookies

This website uses cookies to provide better user experience and user's session management.
By continuing visiting this website you consent the use of these cookies.

Ok

ChartExpo Survey


Home > Blog > Surveys

How to Customize Google Forms for Unique Surveys?

Are you tired of generic surveys that feel as exciting as beige wallpaper? It’s time to break free from the monotony and unleash your inner survey sorcerer.

Google Forms is a powerful tool for creating surveys. However, its default templates and settings may not always cater to your specific needs.

Customize Google Forms

That’s where customization comes in.

Ditch the one-size-fits-all approach. Let’s explore the enchanting world of customizing Google Forms.

We’ll jazz up Google Forms with creativity to match your style. From quirky color schemes that pop to questions that tickle brains, your survey will surely shine.

Who said surveys have to be boring?

You can add images, videos, and GIFs to your questions with Google Forms. Whether you want to include a funny cat video or a motivational quote, the possibilities are endless.

That’s not all.

Conditional logic allows you to customize the flow of your survey based on your respondents’ answers. Say goodbye to irrelevant questions and hello to a personalized survey experience.

Table of Contents:

  1. Why are Google Forms Important?
  2. How to Customize Google Forms for Unique Surveys?
  3. What are the Best Practices for Analyzing Google Forms Data?
  4. Wrap Up

Why are Google Forms Important?

Google Forms isn’t just a digital questionnaire tool. It’s a dynamic powerhouse that holds the key to efficient and effective data management. Its significance is multifaceted:

  • Easy creation: Google Forms simplifies survey creation, making it a cakewalk even for tech novices. Its intuitive interface and pre-built survey templates streamline the process.
  • Collaboration: Multiple team members can edit the same form simultaneously, fostering teamwork and saving time.
  • Data collection and analysis: It’s a data collector’s dream. Responses are automatically organized into a neat spreadsheet. The built-in data analysis tools make drawing insights a piece of the pie.
  • Seamless integration: Google Forms integrates with other Google Workspace apps for efficient data storage, analysis, and sharing.
  • Sharing options: Whether via a direct link or email, Google Forms offers versatile sharing options to cater to diverse audiences.
  • Customization: From logo incorporation to personalized themes, it lets you tailor your forms to match your brand or style.
  • Accessibility: Google Forms is compatible with various devices. This ensures respondents can access and complete surveys conveniently, enhancing participation rates.
  • Automation: Time-saving is the name of the game. Google Forms can automate tasks like sending follow-up emails or assigning actions based on responses.
  • Security: Google’s robust security measures ensure your data remains confidential and protected from prying eyes.

How to Create a Survey Using Google Forms?

Follow these steps to create a survey using Google Forms.

  1. Access Google Forms: Log in to your Google account, then go to Google Forms. You can find it by searching “Google Forms” in the Google search bar or by navigating to “forms.google.com”.
  2. Start a new form: Click the “+ Blank” button to start a new form. Add a title and description to your survey.
  3. Add questions: Click the “Untitled question” field to add questions. You can choose from various question types, including multiple-choice, short answer, paragraph, checkboxes, dropdown, etc.
  4. Customize the form: Click the color palette icon to choose a theme or add an image/video to the form header. Adjust fonts, colors, and other visual elements to match your survey’s style.
  5. Add images or videos: You can insert images or videos into your questions to provide context or visual aids. Click the image or video icon within a question to add multimedia.
  6. Section breaks and pages: You can break your survey into sections or pages to better organize your questions. To add a section break, click the “Section” icon on the right side of the question bar.
  7. Utilize advanced features (optional): Use the “Settings” gear icon to configure options like collecting email addresses, allowing multiple responses, etc. Add logic rules to show or skip questions based on respondents’ answers.
  8. Preview your form: Use the “eye” icon in the upper-right corner to preview how your survey will look to respondents.
  9. Send the form: Once your survey is ready, click the “Send” button in the upper-right corner. You can share your form via a link or email or embed it on a website.

How to Customize Google Forms for Unique Surveys?

Customizing Google Forms for unique surveys can make your questionnaire stand out and engage respondents effectively. Here’s how to do it:

  • Theme and visuals: Click the color palette icon to choose a theme matching your survey’s purpose or brand. Add a header image or video to personalize the form’s appearance.
  • Question types and order: Experiment with various question types like multiple choice questions, checkboxes, dropdowns, and more. Arrange questions in a logical order that flows smoothly for respondents.
  • Section breaks: Use section breaks to group questions into distinct parts, making the survey feel organized and easy to navigate.
  • Logic and skip logic: Employ logic rules to show or skip questions based on respondents’ previous answers, creating a tailored experience.
  • Question-wording: Craft clear and concise questions using language appropriate for your audience. Avoid jargon and ambiguous terms that could confuse respondents.
  • Answer options: Provide diverse and relevant answer options for multiple-choice questions. Use “Other” options or open-ended questions to allow respondents to share unique responses.
  • Custom images and videos: Embed images or videos within questions to illustrate concepts or provide context.
  • Introduction and instructions: Write a compelling introduction that explains the purpose of the survey and assures respondents of its value. Provide clear instructions for each question, especially if there are specific formats or details you require.
  • Confirmation and thank you messages: Customize the confirmation message respondents see after submitting the form. Express gratitude for their time and participation with a personalized thank you message.

What are the Best Practices for Analyzing Google Forms Data?

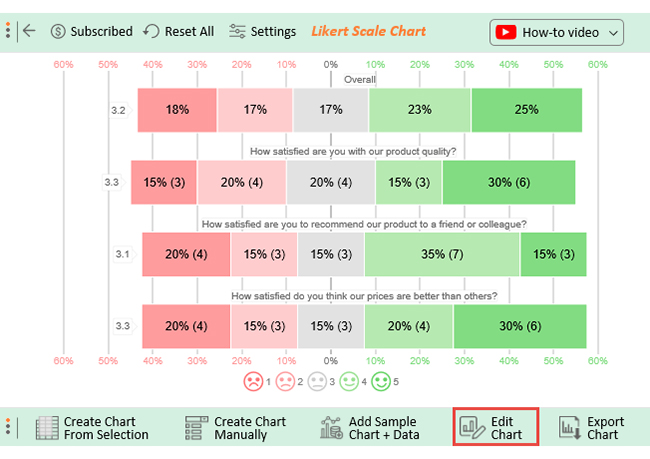
Using visualizations is one of the best practices for analyzing Google Forms data. Data visualizations help in exploring and understanding the data in a more intuitive and meaningful way.

Google Forms allows you to export the responses to a spreadsheet like Google Sheets and Excel. Once the data is in a spreadsheet, you can easily create visualizations using charts and graphs. Then you can use add-ons and extensions for more features and enhance your visualization capabilities.

This is where ChartExpo comes into play.

ChartExpo provides additional charting options and customization features to create more impactful visualizations.

Benefits of Using ChartExpo

  • ChartExpo offers many visualization options, giving you the power to cherry-pick the perfect one for your data. This turbocharges your data analysis and presentation game, making it a force to be reckoned with.
  • ChartExpo flaunts a user-friendly interface that practically creates insightful visualizations for you. No coding skills are required – just pure chart-making bliss.
  • ChartExpo allows you to sprinkle a dash of uniqueness onto your visualizations. Customize the colors, fonts, and styles to make your visuals as personal as your favorite pair of socks.
  • ChartExpo is the Robin Hood of charting tools, delivering exceptional value for your hard-earned money. Try it for free for 7 days, and if you’re sold, grab the monthly plan for $10. It’s a steal!

How to Install ChartExpo in Excel?

  1. Open your Excel application.
  2. Open the worksheet and click the “Insert” menu.
  3. You’ll see the “My Apps” option.
  4. In the office Add-ins window, click “Store” and search for ChartExpo on my Apps Store.
  5. Click the “Add” button to install ChartExpo in your Excel.

ChartExpo charts are available both in Google Sheets and Microsoft Excel. Please use the following CTA’s to install the tool of your choice and create beautiful visualizations in a few clicks in your favorite tool.

Example

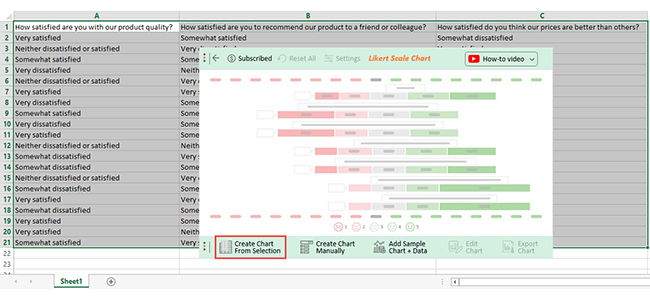
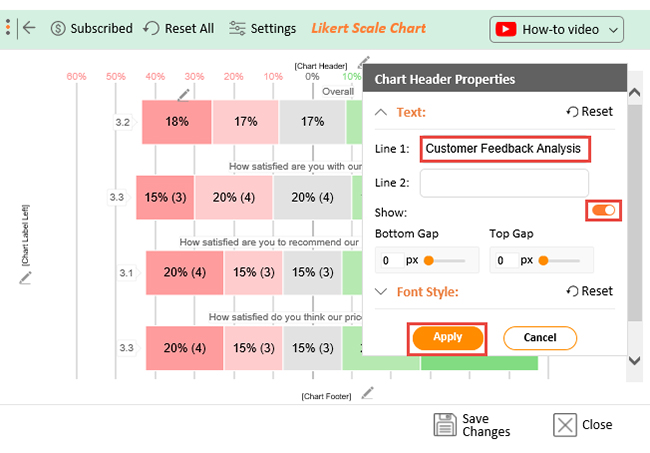
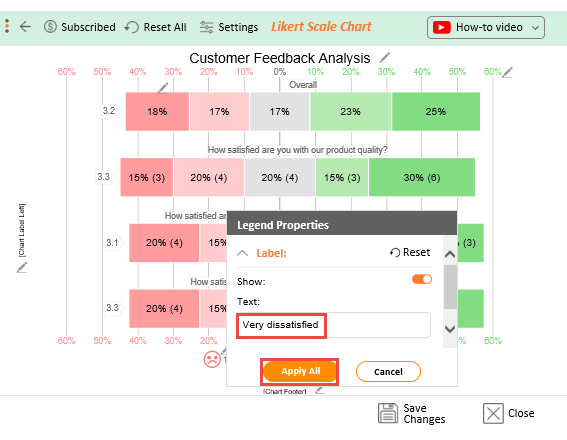
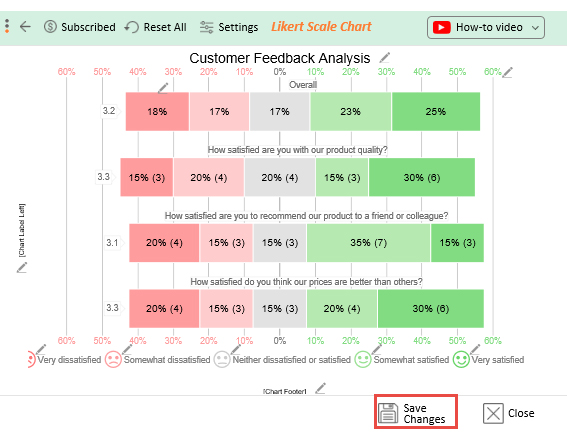
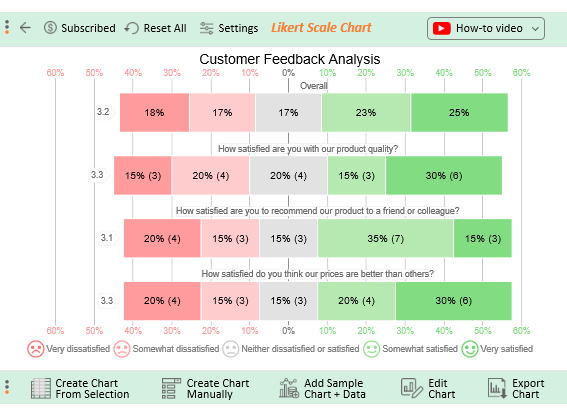
Let’s say you have created a feedback survey for your store with the following questions.

  • How satisfied are you with our product quality?
  • How satisfied are you with recommending our product to a friend or colleague?
  • How satisfied do you think our prices are better than others?

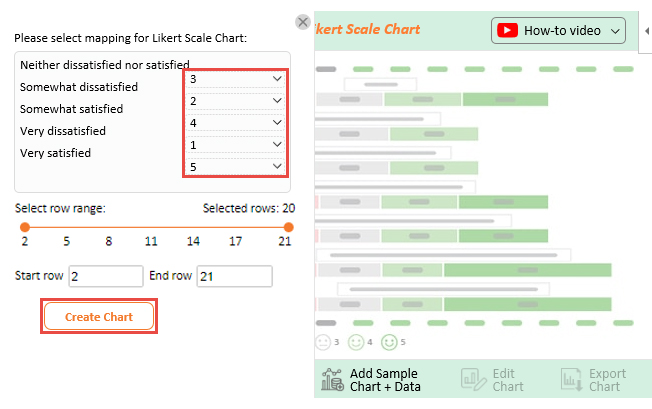
Respondents provide an answer to each question using the response scale below.

  1. Very dissatisfied
  2. Somewhat dissatisfied
  3. Neither dissatisfied nor satisfied
  4. Somewhat satisfied
  5. Very satisfied

Assume your survey yields the data table below.

How satisfied are you with our product quality? How satisfied are you with recommending our product to a friend or colleague?


How would you rate your satisfaction with our prices compared to others?


Very satisfied Somewhat satisfied Somewhat dissatisfied
Neither dissatisfied nor satisfied Very dissatisfied Very satisfied
Somewhat satisfied Somewhat dissatisfied Neither dissatisfied nor satisfied
Very dissatisfied Neither dissatisfied nor satisfied Very dissatisfied
Neither dissatisfied nor satisfied Very dissatisfied Somewhat satisfied
Very satisfied Very satisfied Somewhat satisfied
Very dissatisfied Somewhat satisfied Very satisfied
Somewhat satisfied Somewhat satisfied Somewhat dissatisfied
Very dissatisfied Somewhat dissatisfied Very satisfied
Very satisfied Somewhat satisfied Very dissatisfied
Neither dissatisfied nor satisfied Neither dissatisfied nor satisfied Very satisfied
Somewhat dissatisfied Very satisfied Neither dissatisfied nor satisfied
Somewhat dissatisfied Somewhat satisfied Somewhat dissatisfied
Neither dissatisfied nor satisfied Very dissatisfied Somewhat satisfied
Somewhat dissatisfied Somewhat satisfied Very dissatisfied
Very satisfied Very dissatisfied Neither dissatisfied nor satisfied
Somewhat dissatisfied Somewhat dissatisfied Very satisfied
Very satisfied Somewhat satisfied Somewhat satisfied
Very satisfied Neither dissatisfied nor satisfied Very satisfied
Somewhat satisfied Very satisfied Very dissatisfied

This table contains example data. Expect many responses and questions in real life.

  • To get started with ChartExpo, install ChartExpo in Excel.
  • Now Click on My Apps from the INSERT menu.
insert chartexpo in excel
  • Choose ChartExpo from My Apps, then click Insert.
open chartexpo in excel
  • Once it loads, choose the “Likert Scale Chart” from the charts list.
search likert scale chart in excel
  • Click the “Create Chart From Selection” button after selecting the data from the sheet, as shown.
Create Chart From Selection ce406
  • When you click the “Create Chart From Selection” button, you have to map responses with numbers manually. The Likert scale has this arrangement:
    • Very dissatisfied=1
    • Somewhat dissatisfied=2
    • Neither dissatisfied nor satisfied=3
    • Somewhat satisfied=4
    • Very satisfied=5
  • Once all is set, click the “Create Chart” button.
Map Likert Responses to Numbers ce406
  • ChartExpo will generate the visualization below for you.
Customize Google Forms Design Template
  • If you want to have the chart’s title, click Edit Chart, as shown in the above image.
  • Click the pencil icon next to the Chart Header to change the title.
  • It will open the properties dialog. Under the Text section, you can add a heading in Line 1 and enable Show.
  • Give the appropriate title of your chart and click the Apply button.
Apply Title on Chart ce406
  • Let’s say you want to add text responses instead of numbers against every emoji.
  • Click the pencil icon next to the respective emoji. Expand the “Label” properties and write the required text. Then click the “Apply All” button.
Apply Label on Chart ce406
  • Click the “Save Changes” button to persist the changes.
Customize Google Forms 1
  • Your final chart will appear below.
Final Customize Google Forms

Insights

  • 50% of customers are satisfied with the product’s price, 35% are dissatisfied, and 15% remain neutral.
  • 50% are likely to recommend the product to others. 35% are not likely to recommend it, and 15% maintain neutrality.
  • Regarding product quality, 45% of customers are satisfied, 35% are dissatisfied, and 20% are neutral.
  • Overall, 48% of customers responded positively, 35% expressed dissatisfaction, and 17% remained neutral.

FAQs

Why is Google Forms important?

Google Forms facilitates efficient data collection. Its user-friendly interface allows easy creation of surveys and questionnaires, fostering collaboration and customization. It streamlines data analysis, integrates seamlessly with other tools, and ensures secure and organized information gathering.

Is there a way to customize Google Forms?

Yes, Google Forms offers extensive customization options. You can personalize themes, question types, logic rules, and even insert images or videos. This customization ensures your forms align with your brand, engage respondents, and collect relevant data.

How do I make Google Forms fancy?

To make Google Forms fancy;

  • Choose vibrant themes.
  • Upload captivating images or videos.
  • Customize fonts and colors.
  • Employ question logic to create interactive experiences.
  • Group questions into sections for a polished look.

These enhancements add flair and engagement to your forms.

Wrap Up

Personalization reigns supreme in survey creation – it adds a touch of personality that resonates with respondents.

Tailoring Google Forms for unique surveys is more than just aesthetics. It’s about fostering engagement and gathering meaningful insights.

The artistry lies in the details.

You breathe life into your survey with themes, question types, skip logic and multimedia elements. Moreover, crafting well-worded questions with clear instructions ensures accuracy.

Through collaboration, you refine your masterpiece. Colleagues contribute their brushstrokes, fine-tuning and polishing until the survey gleams with sophistication. Additionally, previewing and testing ensure flawless performance when the curtains rise.

As you share your creation, the world interacts with your masterpiece. Your unique survey dances across screens, gathering data as distinct as the respondents’ fingerprints.

Don’t stop there.

Elevate your customization game further with ChartExpo. This dynamic tool empowers you to transform survey data into visual masterpieces. It infuses your findings with life through insightful charts, graphs, and visuals that communicate trends and patterns effortlessly.

Remember, a well-crafted survey isn’t just a questionnaire; it’s a conversation.

How much did you enjoy this article?

PBIAd1
Start Free Trial!
128769

Related articles

next previous
Surveys13 min read

5 Point Likert Scale Analysis, Interpretation & Examples

Dive deep into the realm of 5-point Likert Scale Analysis and Interpretation to unravel the sentiments behind your responses. Gain actionable insights today.

Surveys11 min read

3-Point Likert Scale: Range Interpretation & Analysis

Learn the basics of the 3-point Likert scale, including examples, benefits, and when it's best applied in research and feedback forms.

Surveys16 min read

Survey Data Collection: Definition, Methods and Analysis

Find the best methods of Survey data collection. Elevate your research game with practical tips for gathering, analyzing, and leveraging valuable information.

Surveys11 min read

5-Point Performance Rating Scale With Examples: Quick Guide

Discover how the 5-Point Performance Rating Scale helps organizations evaluate employee performance with clarity, consistency, and fairness across teams.

Surveys11 min read

How to Interpret 4-Point Likert Scale Results?

Click to learn How to Create, Gather and Analyze Data Using the 4-Point Likert Scale? A complete guide with definition, examples, uses, and applications.

ChartExpo logo

Turn Data into Visual
Stories

CHARTEXPO

  • Home
  • Gallery
  • Videos
  • Services
  • Pricing
  • Contact us
  • FAQs
  • Privacy policy
  • Terms of Service
  • Sitemap

TOOLS

  • ChartExpo for Google Sheets
  • ChartExpo for Microsoft Excel
  • Power BI Custom Visuals by ChartExpo
  • Word Cloud

CATEGORIES

  • Bar Charts
  • Circle Graphs
  • Column Charts
  • Combo Charts
  • Comparison Charts
  • Line Graphs
  • PPC Charts
  • Sentiment Analysis Charts
  • Survey Charts

TOP CHARTS

  • Sankey Diagram
  • Likert Scale Chart
  • Comparison Bar Chart
  • Pareto Chart
  • Funnel Chart
  • Gauge Chart
  • Radar Chart
  • Radial Bar Chart
  • Sunburst Chart
  • see more
  • Scatter Plot Chart
  • CSAT Survey Bar Chart
  • CSAT Survey Chart
  • Dot Plot Chart
  • Double Bar Graph
  • Matrix Chart
  • Multi Axis Line Chart
  • Overlapping Bar Chart
  • Control Chart
  • Slope Chart
  • Clustered Bar Chart
  • Clustered Column Chart
  • Box and Whisker Plot
  • Tornado Chart
  • Waterfall Chart
  • Word Cloud
  • see less

RESOURCES

  • Blog
  • Resources
  • YouTube
SIGN UP FOR UPDATES

We wouldn't dream of spamming you or selling your info.

© 2025 ChartExpo, all rights reserved.