Categories
The 5-point Likert scale is a powerful survey tool for capturing opinions, attitudes, and satisfaction levels in a structured way. Widely used by businesses, HR teams, and researchers, it helps uncover how people perceive products, services, or workplace experiences.
With five clearly defined response options—from “Strongly Disagree” to “Strongly Agree”—this scale makes it easy to quantify sentiment, identify patterns, and turn survey responses into actionable insights.
Understanding and analyzing these responses helps businesses identify trends, improve decision-making, and design more effective strategies based on real audience sentiment. In this guide, you will learn how to create, interpret, and visualize 5-point Likert scale data, with practical examples and best practices for actionable insights.
But First!
Definition: A 5-point Likert scale is a survey tool designed to measure opinions, attitudes, and perceptions using five ordered response options. Participants indicate their level of agreement or disagreement with a statement, typically ranging from “Strongly Disagree” to “Strongly Agree”, with a neutral midpoint such as “Neither Agree nor Disagree.”
This scale is widely used because it combines simplicity with actionable insights. It allows organizations, HR teams, and researchers to quantify sentiment, identify patterns in responses, and track trends across different questions or survey periods.
The structured nature of the scale makes it easy to analyze and interpret, whether for customer feedback, employee engagement, or market research.
Analyzing a 5-point Likert scale involves more than counting responses. To get actionable insights from survey data, you need to evaluate patterns, sentiment direction, and trends across respondents. Below are the key aspects to consider for effective analysis.
Understanding how responses are distributed across all five options is crucial. Instead of only looking at totals, examine where respondents cluster:
Example: If 70% of employees select “Agree” or “Strongly Agree” for a satisfaction question, it indicates overall positive sentiment.
Central tendency helps you identify where most responses lie and the overall sentiment trend:
Analyzing sentiment direction tells you whether responses lean positive, negative, or neutral. This step helps translate raw numbers into actionable insights.
Example: For a product feedback survey, a median of 4 (“Agree”) suggests general satisfaction among customers.
Variability measures how consistent responses are across participants:
Assessing variability is particularly helpful when comparing departments, customer segments, or demographic groups.
Example: Marketing feedback showing high variation on campaign clarity may highlight the need for standardized messaging.
Comparing responses across different dimensions adds depth to your analysis:
Comparative analysis can reveal emerging issues, highlight progress, and guide strategic decisions.
Example: Comparing Likert scores of customer satisfaction between 2022 and 2023 can uncover whether service improvements had a measurable impact.
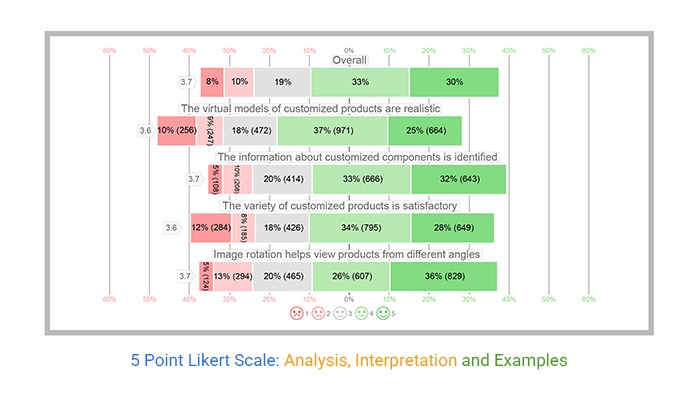
Visualizations make patterns easier to understand and communicate:
Using visuals improves stakeholder understanding and helps teams act on insights faster.
Example: A Likert scale chart showing most responses in “Agree” and “Strongly Agree” indicates strong employee engagement or customer satisfaction.
Always interpret Likert results in context:
Context ensures your conclusions are accurate and actionable, avoiding misinterpretation of the data.
Example: Low satisfaction scores during a company restructure may reflect temporary concerns rather than long-term issues.
Creating a 5-point Likert scale is a practical way to measure opinions, attitudes, and satisfaction in a structured, easy-to-analyze format. Whether you are conducting employee surveys, customer feedback forms, or research studies, following a clear process ensures accurate data collection and meaningful insights.
Start by listing the statements or questions respondents will evaluate. Each question should focus on a single topic to avoid confusion. Examples for an employee feedback survey include:
Provide five response choices that cover the full range of opinions. A common agreement scale includes:
These ordered options allow respondents to express varying levels of agreement or disagreement, giving more nuanced insights than simple yes/no answers.
Assign numerical values to simplify data analysis:
This numeric assignment makes it easy to calculate averages, identify trends, and compare responses across different questions or respondent groups.
Organize your survey in a table format:
This layout ensures clarity and helps respondents complete the survey efficiently.
Before full distribution, test the survey with a small sample to identify any unclear questions or confusing response options. This step improves accuracy and ensures respondents interpret the scale correctly.
Once responses are collected, you can analyze the data using methods such as:
A 5-point Likert scale is versatile and can measure different types of attitudes, behaviors, or perceptions depending on the survey objective. Below are some of the most common use cases:
Example Statement:
“I feel valued in my current role.”
Response Options:
Use Case: Agreement-based questions are ideal for assessing employee satisfaction, customer sentiment, or opinions about products, services, or workplace experiences. They reveal how strongly respondents feel about a specific statement.
Example Statement:
“I’m likely to recommend this service to others.”
Response Options:
Use Case: Likelihood questions help gauge future intentions, such as customer loyalty, referral probability, or the likelihood of repeat usage. This is particularly useful for Net Promoter Score (NPS) style surveys or marketing feedback.
Example Statement:
“I participate in team meetings regularly.”
Response Options:
Use Case: Frequency-based questions capture behavioral patterns and habits, helping organizations track engagement, participation, or recurring actions. They are especially valuable in employee engagement surveys or activity tracking.
Analyzing responses from a 5-point Likert scale requires techniques that capture both the distribution of opinions and overall trends. Proper analysis transforms raw survey data into actionable insights for business, HR, or research purposes. Below are the key methods:
Calculate the percentage of respondents selecting each response option.
These measures provide insights into central tendencies without being skewed by extreme responses.
Assign numerical values to each response (e.g., 1 = Strongly Disagree, 5 = Strongly Agree) and calculate the average.
Combine the percentages of “Agree” and “Strongly Agree” responses to measure total positive sentiment.
A 5-point Likert scale is a widely used survey tool for measuring opinions, attitudes, and levels of agreement. Typical response options include:
Proper analysis of Likert scale data allows businesses, HR teams, and researchers to identify patterns, trends, and overall sentiment, turning raw survey responses into actionable insights.
Using Google Sheets for 5-Point Options Scale Analysis
Google Sheets is a convenient tool for storing and analyzing survey data. You can:
However, while Sheets handles calculations efficiently, it lacks specialized visualizations designed specifically for survey data.
To improve presentation and interpretation, add-ons like ChartExpo can generate charts that clearly show response distributions, sentiment trends, and comparative insights across multiple survey questions.
Imagine you run a skincare business and want to measure how customers feel about your products and services. You can design a survey using a 5-point agreement scale with questions like:
Once customers respond, you organize the data in a spreadsheet. This structured format allows for detailed analysis, helping you quickly identify:
Visualizing this data with charts and dashboards makes it easier to communicate insights to stakeholders and supports data-driven decision-making.

Proper analysis of 5-point Likert scale data ensures your survey results are accurate, actionable, and easy to interpret. Follow these best practices to get meaningful insights:
Label each response consistently from 1 to 5 (e.g., 1 = Strongly Disagree, 5 = Strongly Agree). This allows straightforward calculation of mode, median, and mean, making comparisons and trend analysis simpler.
The mean can be misleading for ordinal or skewed data. Use the mode to identify the most common response and the median for central tendency. Treat the mean as a supplementary measure rather than a primary indicator.
Charts make patterns and insights easier to grasp. Use Likert, stacked bar charts, or heatmaps to show distributions, trends, and comparisons across survey questions or respondent groups. Visualization simplifies communication to stakeholders.
Include an equal number of positive and negative options, plus a neutral midpoint. A balanced scale reduces response bias and allows participants to accurately express their opinions.
Break down survey data by subgroups, such as department, age, or tenure. Segmentation uncovers hidden patterns, identifies differences between groups, and informs targeted actions or strategies.
A good score on a 5-point Likert scale generally falls between 4 (Agree) and 5 (Strongly Agree). This range indicates positive sentiment, satisfaction, or approval. Scores above 4 are typically considered strong and favorable, signaling that respondents have a generally positive perception or experience.
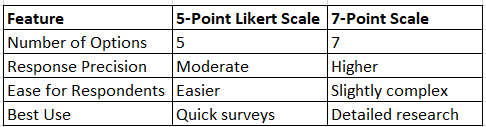
A 5-point Likert scale provides five response options (e.g., Strongly Disagree to Strongly Agree), making it simple, fast, and easy for respondents to complete. A 7-point Likert scale adds two additional options, offering more granularity and nuance.
This allows respondents to express finer variations in opinion or sentiment, which can be useful for detailed research or when subtle differences in attitude are important.
To calculate the average (mean) score, first assign numerical values to each response:
Then, sum the numerical values of all responses for a question and divide by the total number of respondents. The result gives the average score, which can be used to compare responses, track trends, or summarize overall sentiment.
The 5-point Likert scale is a reliable and structured way to measure opinions, attitudes, and satisfaction, even with large datasets. By providing a balanced set of response options, it helps organizations, HR teams, and researchers capture meaningful insights efficiently.
In this guide, we covered:
Using specialized tools or add-ons like ChartExpo enhances your workflow by enabling fast, clear, and professional visualizations. These tools help you turn raw survey data into actionable insights, making it easier to identify trends, communicate results, and make data-driven decisions.
A structured, visual approach ensures your survey results are easy to interpret, reliable, and impactful across teams and stakeholders.
How much did you enjoy this article?


Google Forms to Google Sheets keeps your data organized and current with every submission. Learn the steps, methods, and tips now!

Product survey questions reveal what customers truly think. Learn how to ask the right ones and act on the survey results. Read on!

Learn how the 5-Point Performance Rating Scale improves employee evaluations with clear, consistent, and fair performance reviews across teams.


