Categories
If you’re tired of boring, dull survey questions that make you want to hit the snooze button, we’ve got something exciting for you.


Get ready to discover the good survey questions that will increase participation rates and the quality of the responses.
Poorly curated survey questions can make respondents lose interest, give half-hearted answers, or worse, abandon the survey altogether.
We’re about to reveal the secret to creating engaging and insightful surveys.
Let’s Start with:
Definition: Good survey questions are concise and to the point. Long-winded survey questions can confuse and frustrate respondents. And this can lead to incomplete or inaccurate responses.
If you’ve ever conducted a survey, you know how crucial it is to ask the good survey questions.
However, what exactly makes the good survey question?
Using good survey questions that elicit honest and thoughtful responses. Avoid leading or biased questions that sway your audience in a particular direction. Aim for neutral wording that allows individuals to express their true opinions.
Consider the survey format. Multiple-choice questions are great for gathering specific data. On the other hand, open-ended questions encourage participants to share their ideas and insights freely.
Good survey questions engage and captivate people. Inject some personality into your survey questions. Make them relatable, and encourage a conversational tone.
You want your participants to feel like they’re having a genuine conversation. Let’s discuss some common types of good survey questions, which you can ask in your next survey.
In the coming section, we will learn about types of surveys that can be marked as good and useful.
Here are some common types of good survey questions that can help you gather insightful responses:
The key to writing good survey questions lies in their ability to generate accurate, unbiased, and valuable responses. Follow these 7 tips to write good survey questions:
In our next section, you can see how we use these tips while writing some of the best survey questions.
Now you know what are the most common good survey question types and how to write them by reading our above sections, Let’s explore the most useful good survey questions based on different business scenarios.
Good survey questions are a strategic endeavor that empowers businesses to navigate the ever-evolving landscape of consumer preferences. By including 4-point Likert scale questions and tailoring these inquiries to specific use cases, organizations can extract invaluable insights.
The art of designing good survey questions will help you build meaningful connections between your business and your customers. Ask these good survey questions, and watch your surveys transform into powerful tools for growth and engagement.
Let’s explore the advantages of asking good survey questions:
Good survey questions help you gauge how satisfied your customers are with your brand. By gathering data, you can pinpoint areas that need improvement.
Good survey questions provide valuable insights into your target audience’s needs. analyze survey results in excel using charts can help you identify areas that require improvement.
Satisfied customers are likely to stay loyal to your brand. Using good survey questions, you can identify the factors that drive loyalty and implement changes.
Satisfied customers tend to make repeat purchases and refer others to your brand. By improving customer satisfaction through surveys, you can foster loyalty.
A positive customer experience helps build your brand’s reputation.
By using a combination of customer satisfaction surveys and the good survey questions to uncover areas for improvement, you can enhance the overall customer experience.
Congratulations on successfully learning how to curate the survey questions.
Now, it’s time to unlock the true potential of your survey data by analyzing it.
While traditional tools like Excel are helpful in organizing data, they may not be the best fit for survey-based analysis.
Don’t worry.
There’s an exciting solution that can take your survey data analysis to a whole new level. It’s called ChartExpo.
ChartExpo is not your ordinary tool.
You heard that right.
It’s a powerful Excel add-in that will revolutionize how you analyze your survey questions.
With its user-friendly interface and a wide range of survey-based charts, ChartExpo effortlessly transforms survey responses into compelling narratives.
You don’t need to be a coding expert to use ChartExpo’s features. It’s built to be intuitive and easy to use, even when working with 5-point performance rating scale data.
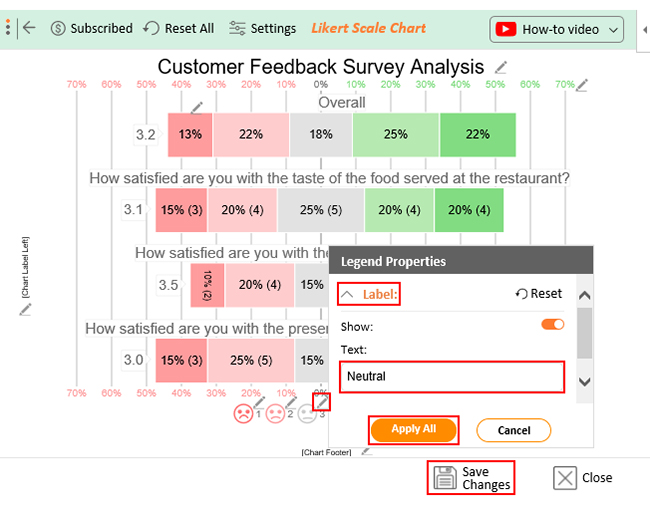
One of its standout features is the Likert Scale Chart, which helps you explore survey responses in depth and uncover meaningful insights.
Try ChartExpo’s free 7-day trial to see how it works. After that, it’s available for a modest $10 per month.
How to Install ChartExpo in Excel?
ChartExpo charts and graphs are available both in Google Sheets and Microsoft Excel. Please use the following CTA’s to install the tool of your choice and create beautiful visualizations in a few clicks in your favorite tool.


Let’s imagine you run a restaurant. You want to know whether your team is committed and engaged in achieving your business goals.
You’ve organized a survey to gather first-hand feedback from your team and you’ve used the good survey questions below.
Let’s further imagine you’ll use the following answer options in your survey format.
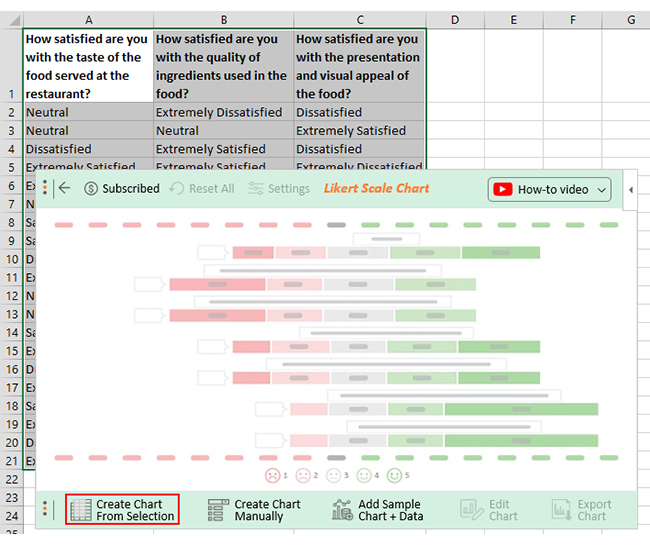
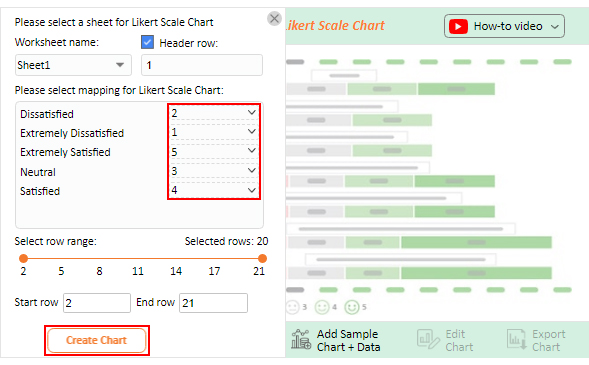
In the coming section, we’ll use ChartExpo, and sample data to demonstrate how you can leverage a Likert Scale Chart to visualize responses from your best survey questions.
| How satisfied are you with the taste of the food served at the restaurant? | How satisfied are you with the quality of ingredients used in the food? | How satisfied are you with the presentation and visual appeal of the food? |
| Neutral | Extremely Dissatisfied | Dissatisfied |
| Neutral | Neutral | Extremely Satisfied |
| Dissatisfied | Extremely Satisfied | Dissatisfied |
| Extremely Satisfied | Extremely Satisfied | Extremely Dissatisfied |
| Extremely Satisfied | Satisfied | Extremely Satisfied |
| Neutral | Dissatisfied | Neutral |
| Satisfied | Satisfied | Satisfied |
| Satisfied | Dissatisfied | Dissatisfied |
| Dissatisfied | Satisfied | Satisfied |
| Extremely Dissatisfied | Dissatisfied | Satisfied |
| Neutral | Dissatisfied | Neutral |
| Neutral | Extremely Satisfied | Satisfied |
| Satisfied | Extremely Dissatisfied | Dissatisfied |
| Extremely Dissatisfied | Extremely Satisfied | Satisfied |
| Dissatisfied | Extremely Satisfied | Dissatisfied |
| Extremely Dissatisfied | Extremely Satisfied | Extremely Dissatisfied |
| Satisfied | Satisfied | Satisfied |
| Extremely Satisfied | Neutral | Neutral |
| Dissatisfied | Neutral | Extremely Dissatisfied |
| Extremely Satisfied | Extremely Satisfied | Satisfied |
This table contains example data. Expect many responses and questions in real life.


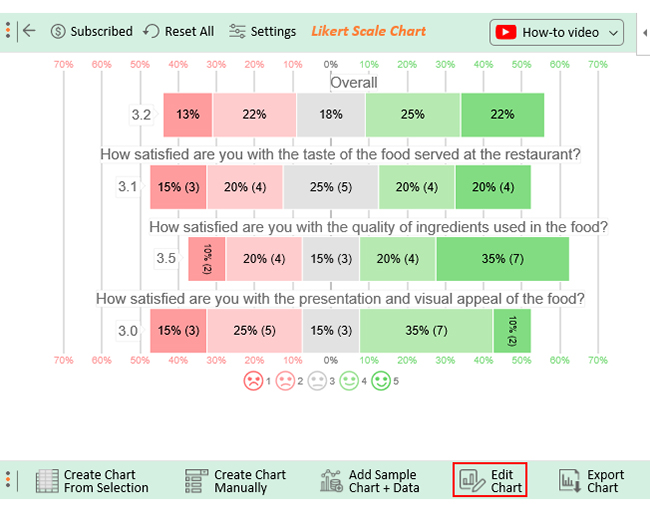
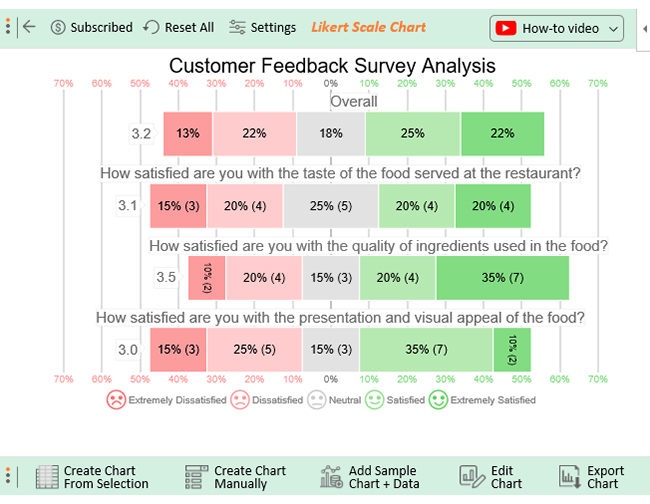


Let’s dive into the valuable insights we gained from the chart above.
The taste of the food: 40% of customers were satisfied. However, 35% were not satisfied, indicating areas where we can make improvements. 25% remained neutral, which presents an opportunity to engage with them and understand their perspectives.
The quality of ingredients used in the food: the results showed that 55% of customers are satisfied. However, 30% are not satisfied, signaling areas that can be improved. 15% chose not to answer.
Customer satisfaction with food presentation: 45% of customers were satisfied with the food presentation. 40% expressed dissatisfaction, highlighting areas to improve. Additionally, 15% remained neutral, suggesting an opportunity to gather more feedback.
Lastly, 47% of customers provided positive responses, reflecting satisfaction. 35% gave negative responses, which necessitates further investigation.
It’s worth noting that 18% did not respond, and understanding their reasons can help improve the survey process.
The good survey answers are honest and thoughtful, and provide relevant information that aligns with the objectives of the survey. By encouraging genuine opinions and experiences, you can gain valuable insights.
Below are some of the best survey questions for restaurants:
Good survey questions should be clear, relevant, neutral, specific, and precise. They should also have balanced response options
They should capture relevant information and can easily be understood. By asking well-designed questions, you can gather valuable data.
In conclusion, using good survey questions is key to unlocking valuable insights.
By carefully crafting survey questions that are clear, concise, and relevant, we can gather data that truly reflects your audience’s true opinions.
ChartExpo, the game-changing data analysis tool we mentioned earlier, offers a range of benefits to enhance your survey analysis.
With its user-friendly interface and survey-based charts, it empowers you to uncover hidden trends, patterns, and other invaluable insights.
Experience the full potential of ChartExpo with our free 7-day trial.
After the trial period, you can continue using ChartExpo’s powerful features for only $10 monthly.
Sign up for the free trial of ChartExpo and discover the endless possibilities.
How much did you enjoy this article?


Google Forms to Google Sheets keeps your data organized and current with every submission. Learn the steps, methods, and tips now!

Product survey questions reveal what customers truly think. Learn how to ask the right ones and act on the survey results. Read on!

Learn how the 5-Point Performance Rating Scale improves employee evaluations with clear, consistent, and fair performance reviews across teams.


