Categories
Analyzing audience feedback is as crucial as it is time-consuming. The upside is learning what makes your customers tick. Once you get inside the mind of the consumer, it’s easier to sell and market your business.


The downside is that gathering, analyzing, and managing audience feedback takes a lot of time. Every business professional has a busy schedule, meaning time is a scarce resource.
Google Forms survey templates can save you time and get you straight to building questionnaires. Its easy interface and plethora of features enable you to make professional forms and surveys in just a few minutes.
You don’t want to miss out on audience feedback. For one, it’s vital to your growth and success as a business.
Moreover, when you fail to actively listen to your customers, they know it. It sends a message that you don’t care about their feelings or concerns. While that may be the furthest thing from the truth, customers still want to feel involved.
This discussion will explore the various Google survey templates available to users and how to use them.
Feedback forms give the audience a sense that they are part of the process. It also lets them know that you’re consistently trying to find ways to improve.
There is no excuse for neglecting this important part of your customer relationship. Google Forms feedback template makes it incredibly easy to begin creating feedback forms and other questionnaires.
Definition: A Google Forms survey template is a ready-made form designed to help you quickly create surveys, polls, or questionnaires without starting from scratch. These templates come with pre-set questions, response options, and layouts tailored for common uses like customer feedback, employee engagement, event registration, or course evaluations.
Here is a snapshot of what the Google Forms feedback response sheet looks like:

Google Forms survey template provides a ready-made structure with pre-designed questions, so you don’t have to build a form from scratch. This speeds up the process and lets you focus on customization.
Google survey templates are created using survey best practices. They include a good mix of multiple-choice, rating scales, and open-ended questions, making your survey more effective and engaging.
Starting from a template lowers the chances of missing key questions or creating a confusing layout. It helps you collect cleaner, more accurate responses.
You can personalize any template by editing questions, adding your branding, and adjusting settings to match your exact purpose, whether it’s customer feedback, employee surveys, or event evaluations.
Well-structured templates make responses easier to organize and analyze, giving you clear insights for better decision-making.
Google Forms offers a wide range of templates to fit different needs. Here are some popular examples:
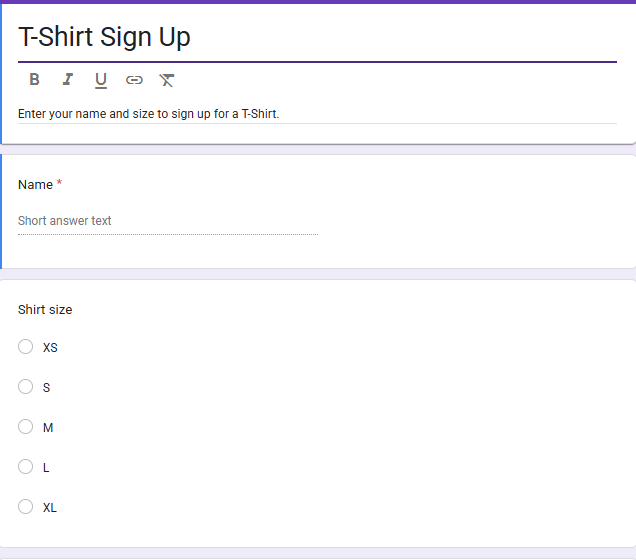
Ideal for clubs, teams, or events, this template lets participants choose T-shirt sizes and styles, making bulk ordering and distribution simple.
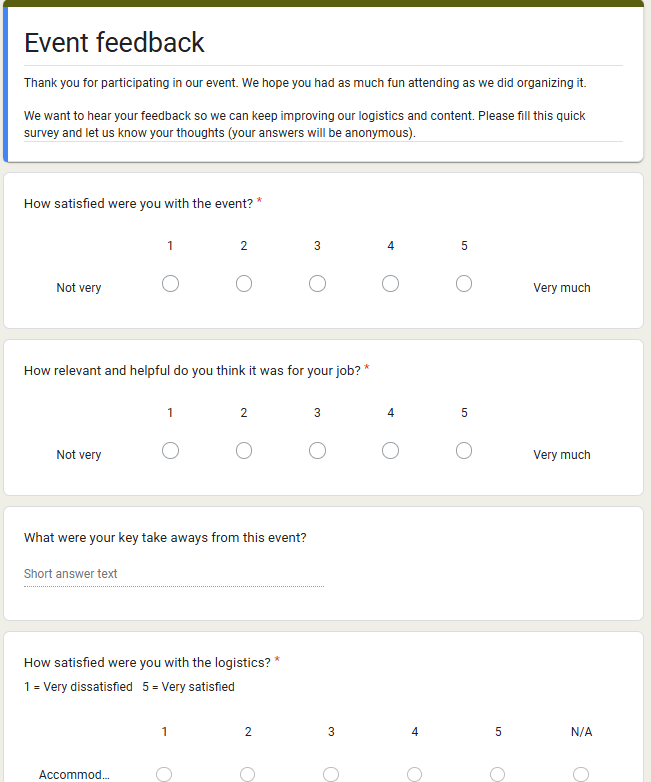
Collects opinions from attendees after an event. It helps organizers measure satisfaction, spot areas for improvement, and plan better for the future.
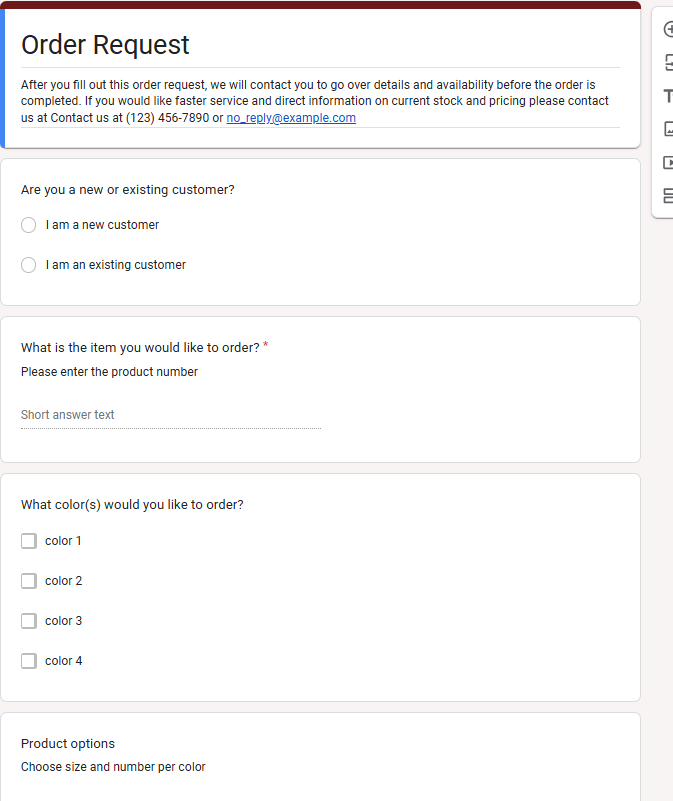
Useful for small businesses, this template allows customers to place product or service orders directly through the form, streamlining the ordering process.
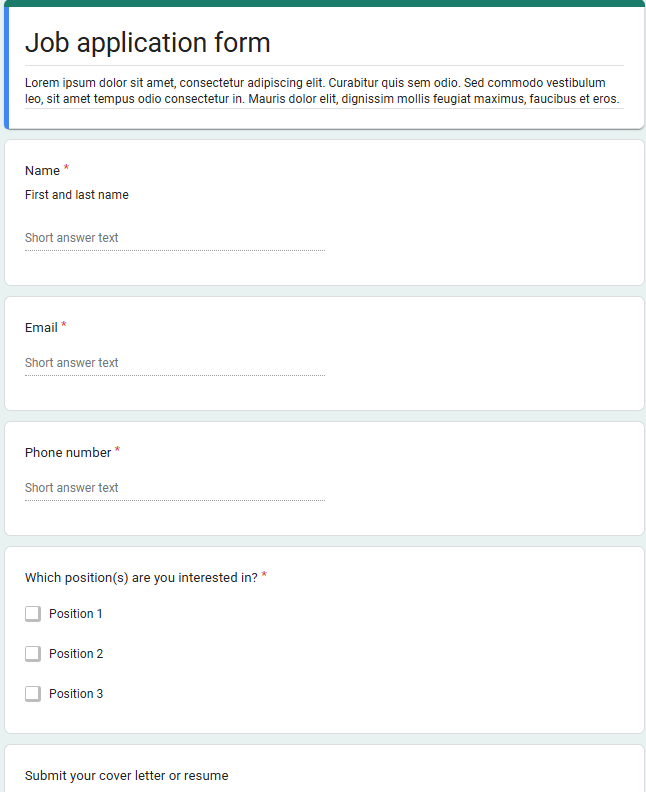
Designed for HR or hiring managers, this template gathers applicant details such as name, contact info, skills, and experience in a professional format.
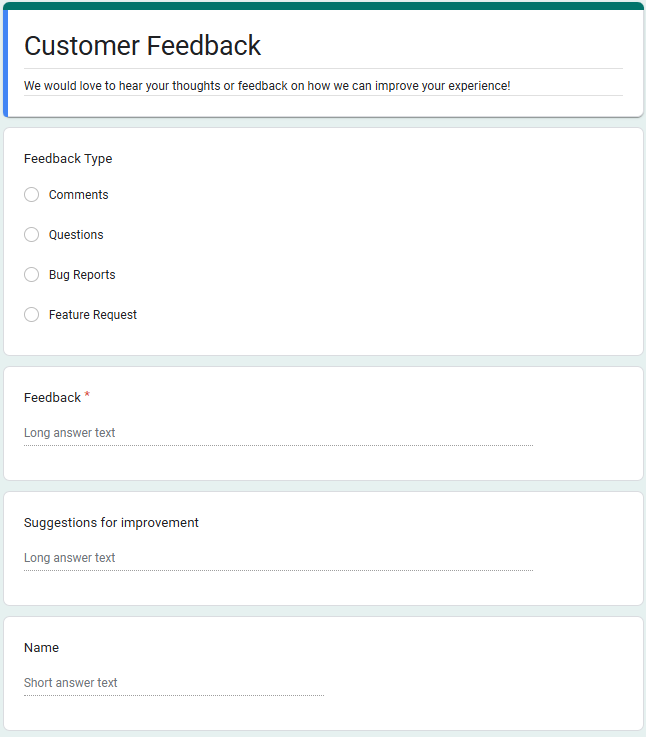
Helps businesses measure customer satisfaction by asking for ratings, comments, and suggestions to improve products or services.
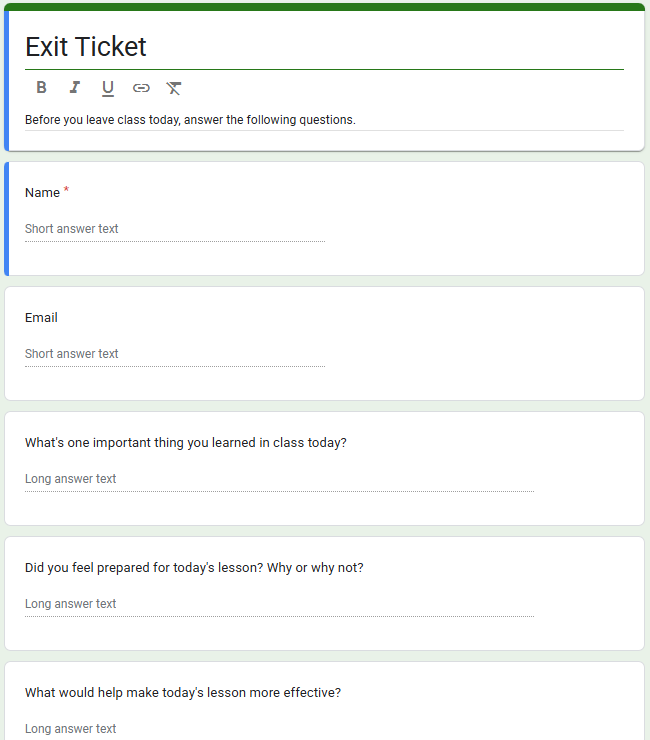
Commonly used in classrooms, this template allows teachers to quickly check what students learned at the end of a lesson.
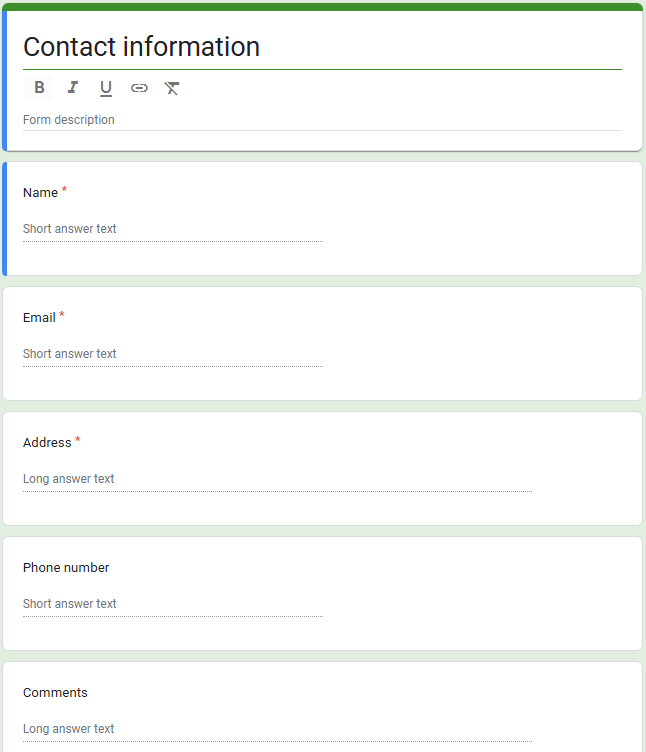
A simple way to collect names, phone numbers, and email addresses, making it useful for building mailing lists or directories.
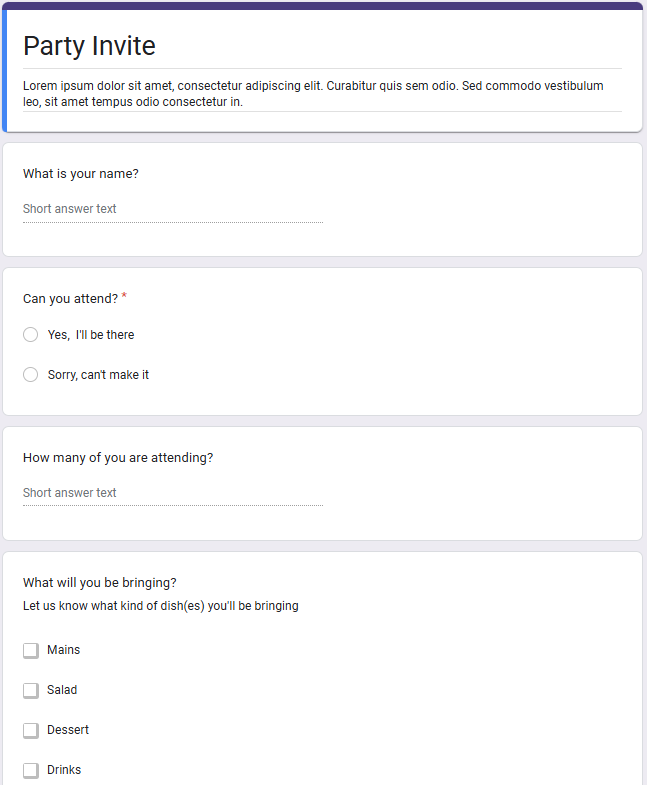
Perfect for weddings, parties, or meetings, this template lets guests confirm attendance and share preferences, such as meal choices.
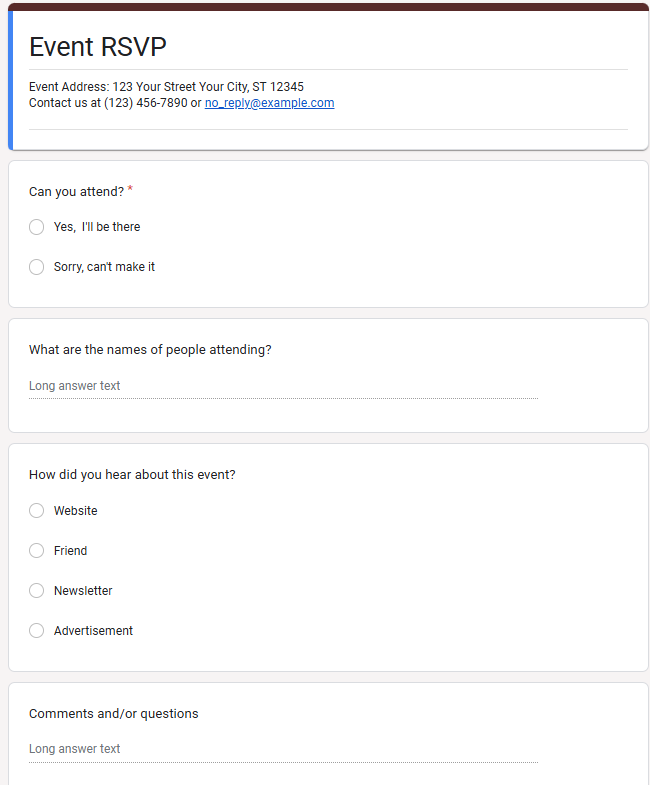
A fun template to invite friends or colleagues to social events. It often includes date, time, venue, and RSVP options.
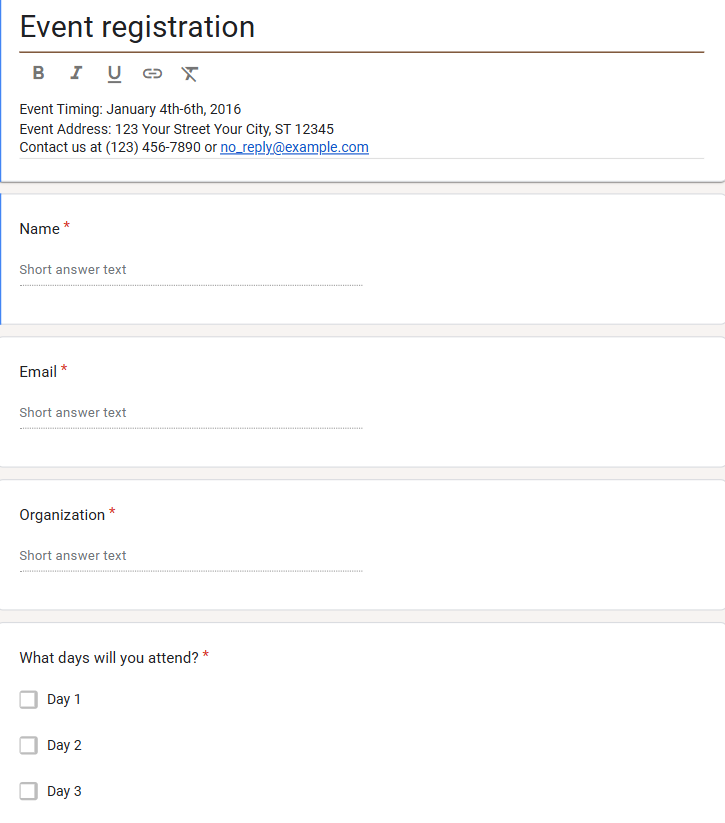
Great for conferences, workshops, or seminars, this template gathers attendee details and helps organizers track sign-ups easily.
Open Google Forms and browse the template gallery. Pick one that matches your goal, such as a Google Form feedback template, event registration, or job applications.
Replace the sample questions with your own. Add multiple-choice, rating scales, or open-ended questions depending on the kind of responses you want.
Personalize the survey by adding your business logo, changing colors, or selecting a theme that matches your brand identity.
Decide whether you want to collect email addresses, make questions required, shuffle answer options, or limit responses to one per person.
Preview the survey to make sure everything looks correct. Test it yourself to check flow, clarity, and ease of use.
Send it out via email, embed it on a website, or share the link on social media to reach your audience.
Monitor real-time responses in Google Forms or export the data to Google Sheets for deeper analysis.
Excel and Google Sheets are effective tools for organizing data, but they aren’t the best for analysis, especially when dealing with more complex methods like a longitudinal survey. The truth is that spreadsheets can make it difficult to analyze large datasets over time. It’s overwhelming to look at a wall of numbers and derive meaningful insights.
The Likert Scale Chart visually expresses responses along a scale to show how prominent each selection is. The more people who choose an answer, the wider the section becomes.
Unfortunately, the Likert Scale Chart isn’t an option among the chart types offered by Excel or Google Sheets. For the easiest way to make this survey data visualization in these apps, we recommend ChartExpo.
ChartExpo is an add-in tool for Excel. It is both a chart gallery offering new visualization options and a more efficient way of making charts.
You can use ChartExpo to make Likert Scale Charts in minutes from your survey data. You can also make visualizations for any other type of data you may deal with regularly.
How to Install ChartExpo in Microsoft Excel?
ChartExpo charts are available both in Google Sheets and Microsoft Excel. Please use the following CTA’s to install the tool of your choice and create beautiful visualizations in a few clicks in your favorite tool.
Let’s say you want to do a customer satisfaction survey. First, let’s have a look at the questions that you have asked customers:
Finally prepared the data table as shown below:
| Responses | How much satisfied are you with the reliability of the product? | How much satisfied are you with the price of the product? | How much satisfied are you with the customer service provided by the company? | How much satisfied are you with the packaging of the product? |
| Response 1 | Extremely dissatisfied | Extremely satisfied | Neutral | Dissatisfied |
| Response 2 | Extremely dissatisfied | Satisfied | Dissatisfied | Neutral |
The above table is just sample data. In actual scenarios, you will have a lot of responses and more questions as well.


Instead of building a survey from scratch, the Google Forms survey template provides a ready-made structure with pre-written questions. You only need to tweak them, which cuts down on setup time.
Templates are built to look clean and well-structured, so your survey appears professional even if you have little design experience. This helps respondents take your survey more seriously.
Google survey templates can be adjusted to fit different needs, whether it’s customer feedback, event registration, or employee surveys. You can add, remove, or edit questions anytime.
Once customized, you can share your survey with just a link. Since it’s hosted online, anyone with the link can access and complete it on any device, desktop, tablet, or mobile.
All responses are automatically organized in Google Forms and can be exported to Google Sheets. This makes it easy to analyze results, track trends, and make data-driven decisions.
While you can change colors, fonts, and images, Google Forms templates don’t allow deep design customization. If you want a highly branded or unique look, the options are limited.
Google Forms survey template covers common question formats like multiple choice, checkboxes, and short answers. However, they lack more advanced survey features such as ranking, matrix grids, or conditional logic found in specialized survey tools.
Google Forms provides summary charts and exports data to Google Sheets, but it doesn’t offer in-depth reporting, cross-tab analysis, or segmentation without additional tools.
Respondents need an internet connection to access and complete the survey. Unlike some professional survey platforms, offline data collection isn’t supported.
For small to medium surveys, templates work well. But if you’re running complex, large-scale research with advanced needs (like branching logic or multiple survey languages), Google Forms may fall short.
Google Forms offers a wide range of pre-designed templates that you can use as a starting point for surveys, questionnaires, and forms. In the Google Forms Template Gallery, you’ll typically find 20+ ready-to-use templates organized into categories such as:
While the exact number of templates may vary over time as Google updates its library, you can expect to find a mix of survey-focused templates along with forms for registration, feedback, and sign-ups.
The best part is that all templates are fully customizable. You can edit the questions, add new ones, and adjust branding to fit your specific needs.
Yes. Google Forms provides several survey templates in its template gallery. Examples include Customer Feedback, Event Feedback, and Course Evaluation, which you can customize to collect responses quickly without starting from scratch.
Google Forms templates are pre-designed forms with ready-made questions and layouts. They are organized by purpose—such as surveys, event registration, job applications, or quizzes making it easier to create forms efficiently.
Yes, Google offers multiple survey-focused templates like Customer Feedback, Event Feedback, Exit Ticket, and Course Evaluation. These templates save time and provide a professional structure for collecting data.
The best template depends on your needs:
Each template is customizable, so you can adapt it to your survey goals.
You have a lot on your plate. While gathering and analyzing audience feedback is important, it might not be at the top of your priority list.
After all, surveys are a time-consuming endeavor, right? Well, thanks to tools like Google Forms, Excel, and ChartExpo, you can acquire valuable audience intel without so much fuss.
It starts with a Google Forms survey template. With this prepared questionnaire, you have a head start at making your next survey. You can send the template as-is to your audience, or add questions to customize it to your liking.
When you start acquiring responses, putting the data in Excel keeps it organized and ready for visual analysis via ChartExpo.
Remember, visual analysis is faster and more effective than trying to understand a spreadsheet of responses. You want to see what’s happening behind the numbers.
ChartExpo’s visualization gallery has multiple options for charting the results from your Google Forms survey template. With options like the Likert Scale Chart, you’ll have no problems extracting audience insights.
The combination of these tools saves tremendous time at each step of the process, from survey making to the analysis of results.
You no longer have to dread gathering audience feedback. After all, you should be excited to get to know your customers!
How much did you enjoy this article?


Google Forms to Google Sheets keeps your data organized and current with every submission. Learn the steps, methods, and tips now!

Product survey questions reveal what customers truly think. Learn how to ask the right ones and act on the survey results. Read on!

Learn how the 5-Point Performance Rating Scale improves employee evaluations with clear, consistent, and fair performance reviews across teams.


