• Home
  • Tools dropdown img
    • Spreadsheet Charts

      • ChartExpo for Google Sheets
      • ChartExpo for Microsoft Excel
    • Power BI Charts

      • Power BI Custom Visuals by ChartExpo
    • Word Cloud

  • Charts dropdown img
    • Chart Category

      • Bar Charts
      • Circle Graphs
      • Column Charts
      • Combo Charts
      • Comparison Charts
      • Line Graphs
      • PPC Charts
      • Sentiment Analysis Charts
      • Survey Charts
    • Chart Type

      • Box and Whisker Plot
      • Clustered Bar Chart
      • Clustered Column Chart
      • Comparison Bar Chart
      • Control Chart
      • CSAT Survey Bar Chart
      • CSAT Survey Chart
      • Dot Plot Chart
      • Double Bar Graph
      • Funnel Chart
      • Gauge Chart
      • Likert Scale Chart
      • Matrix Chart
      • Multi Axis Line Chart
      • Overlapping Bar Chart
      • Pareto Chart
      • Radar Chart
      • Radial Bar Chart
      • Sankey Diagram
      • Scatter Plot Chart
      • Slope Chart
      • Sunburst Chart
      • Tornado Chart
      • Waterfall Chart
      • Word Cloud
    • Google Sheets
      Microsoft Excel
  • Services
  • Pricing
  • Contact us
  • Blog
  • Support dropdown img
      • Gallery
      • Videos
      • Contact us
      • FAQs
      • Resources
    • Please feel free to contact us

      atsupport@chartexpo.com

Categories
All Data Visualizations Data Analytics Surveys
Add-ons/
  • Google Sheets
  • Microsoft Excel
  • Power BI
All Data Visualizations Data Analytics Surveys
Add-ons
  • Google Sheets
  • Microsoft Excel
  • Power BI

We use cookies

This website uses cookies to provide better user experience and user's session management.
By continuing visiting this website you consent the use of these cookies.

Ok

ChartExpo Survey


Home > Blog > Surveys

How Does Google Forms Work?

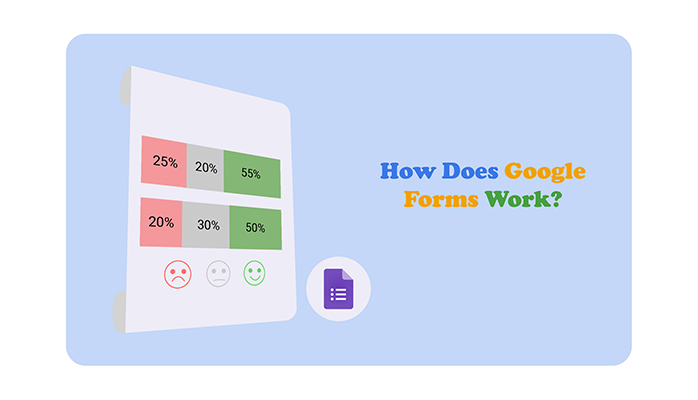
How does Google Forms work?

Is it powered by tiny magical elves who craft personalized questionnaires? Or perhaps there’s a secret society of tech-savvy wizards casting digital spells behind the scenes?

Well, not quite, but the reality is almost as fascinating. Google Forms is an online tool that allows you to create customized surveys, questionnaires, and feedback forms effortlessly.

How Does Google Forms Work

It’s like having a digital genie that grants your data-gathering wishes.

You can ask a variety of questions, from multiple-choice to open-ended, and even include images and videos. Moreover, Google Forms is so user-friendly that even a tech-challenged individual can navigate it effortlessly.

Once your form is ready, you can share it via email, social media, or website embedding.

And the best part?

As responses come flooding in, Google Forms collects and neatly organizes them in a Google Sheets spreadsheet.

No more drowning in a sea of scattered data. Let’s unlock the power of data collection with a touch of magic. Google Forms is here to save us.

Table of Contents:

  1. How Does Google Forms Work?
  2. Tips for Using Google Forms?
  3. How Do You Measure and Analyze Survey Data Collected Using Google Forms?
  4. Wrap Up

How Does Google Forms Work?

Follow these steps to take your surveys to the next level with Google Forms. It’s as easy as creating a new form, adding audio or video files, and sharing it.

  • Creating a Form

You must have a Google account to create a form using Google Forms. Once signed in, go to Google Forms and click the “+ Blank” button to start a new form. You can give your form a title and add a description to provide context for your respondents.

  • Adding Questions and Response Options

Click the “+ Add question” button to add questions. Google Forms offers a variety of question types to choose from. Examples of these question types include multiple-choice, checkbox, short answer, paragraph text, and NPS rating scales. You can customize the response options for each question and set them as required or optional.

  • Customizing the Form

Customize the appearance of your form by selecting a theme from the available options or using your custom colors. You can add images or videos to your questions to make the form more visually engaging. Moreover, you can use section breaks to organize your form into distinct parts.

  • Sharing and Collaborating

Google Forms offers various options for sharing forms. You can generate a unique link for the form and distribute it via email, social media platforms, or messaging apps. Moreover, you can embed the form directly onto a website or share it selectively with specific individuals.

You can collaborate with others on the same form. This enables multiple users to edit and manage the form simultaneously, promoting a collaborative team effort.

  • Collecting Responses

As respondents fill out the form, their answers are automatically collected and stored in a Google Sheets spreadsheet. Each response creates a new row in the spreadsheet, making it easy to keep track of submissions.

  • Analyzing the Data

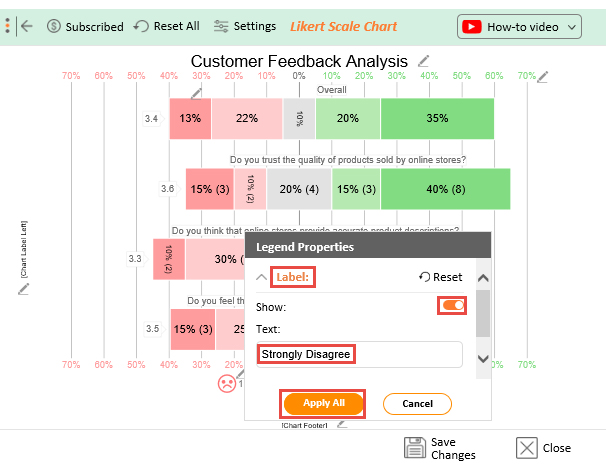
After collecting responses, you can analyze the data directly within Google Forms. Otherwise, you can export it to Google Sheets for more in-depth analysis. Google Forms provides simple summary statistics, such as response counts and percentages for multiple-choice questions. You can use Google Sheets’ built-in features like charts, graphs, and pivot tables for more advanced analysis.

  • Integrating with Other Google Tools

Google Forms seamlessly integrates with other Google Workspace tools. For instance, you can use Google Forms to create quizzes and integrate the results with Google Classroom. Additionally, you can export form responses to Google Sheets to further manipulate and visualize the data. This integration allows for a comprehensive and efficient workflow within the Google ecosystem.

Tips for Using Google Forms?

Ready to level up your survey game? Here are some tips for creating, managing, and sharing surveys with Google Forms.

  1. Plan your form: Have a clear plan of what information you want to collect and choose the perfect type of survey. Organize your questions logically to ensure a smooth flow for respondents.
  2. Keep it simple: Aim for simplicity in your form design. Use clear and concise language for questions and response options. Avoid jargon or complex wording that may confuse respondents.
  3. Choose the right question types: Use the appropriate question types for the information you want to gather. Multiple-choice, checkbox, and rating scale questions work well for structured data. On the other hand, short answers and paragraph text are better for open-ended responses.
  4. Add logic and branching: Use the logic and branching feature to show or hide specific questions based on respondents’ answers. This allows you to create a personalized experience for each respondent, making the form more engaging.
  5. Preview your form: Always preview your form before sharing it to check for any mistakes or formatting issues. This helps maintain a professional appearance.
  6. Customize the theme: Apply a theme to your form that aligns with your brand or the purpose of the survey. This small touch can make the form more visually appealing.
  7. Add images and videos: Visuals help to enhance engagement. Include images or videos to provide context or help respondents understand the questions better.
  8. Test the form: Before distributing it widely, test it with a few individuals to ensure everything is working correctly.
  9. Share responsibly: Be mindful of data privacy and sharing permissions. Only share the form with the intended audience and ensure the collected data is handled appropriately.
  10. Enable response notifications: Consider enabling email notifications for new responses, especially when collecting time-sensitive information. This keeps you informed in real-time.
  11. Use add-ons and integrations: Google Forms supports various add-ons and integrations that can extend its functionality. Explore the Google Workspace Marketplace for useful tools.
  12. Analyze data: Take advantage of the built-in summary of responses in Google Forms. For a more comprehensive analysis, export the data to Google Sheets and use its advanced features.

How Do You Measure and Analyze Survey Data Collected Using Google Forms?

Are you looking for a powerful and efficient way to analyze survey data collected using Google Forms?

Look no further than ChartExpo.

Say hello to insightful, interactive charts and graphs that convey your survey results with clarity and precision.

ChartExpo equips you with everything you require to transform unprocessed data into valuable revelations. Consequently, unraveling the hidden patterns and extracting profound insights from your survey data becomes effortless and enlightening.

Benefits of Using ChartExpo

  • Say goodbye to tedious analysis and hello to impressive presentations. With a vast array of visualizations, you can pick the perfect one to work magic on your data.
  • No coding? No problem. ChartExpo’s user interface is so intuitive that even a novice can whip up insightful charts in no time.
  • ChartExpo lets you sprinkle a dash of creativity on your visuals with its customization options. Fonts, colors, and styles are at your command, making your charts a true reflection of your flair.
  • And here’s the real gem – ChartExpo knows the value of a good deal. It has a free 7-day trial and a $10 monthly plan that gives you chart-topping value for your money.

How to Install ChartExpo in Excel?

  1. Open your Excel application.
  2. Open the worksheet and click the “Insert” menu.
  3. You’ll see the “My Apps” option.
  4. In the office Add-ins window, click “Store” and search for ChartExpo on my Apps Store.
  5. Click the “Add” button to install ChartExpo in your Excel.

ChartExpo charts are available both in Google Sheets and Microsoft Excel. Please use the following CTA’s to install the tool of your choice and create beautiful visualizations in a few clicks in your favorite tool.

Example

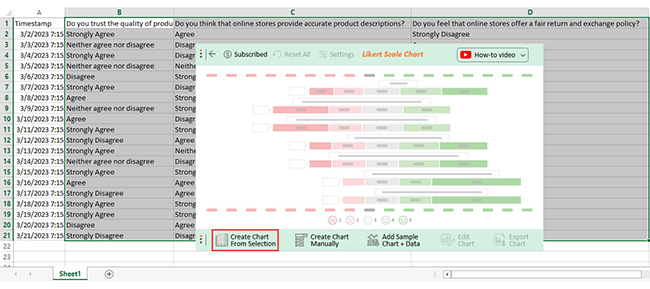
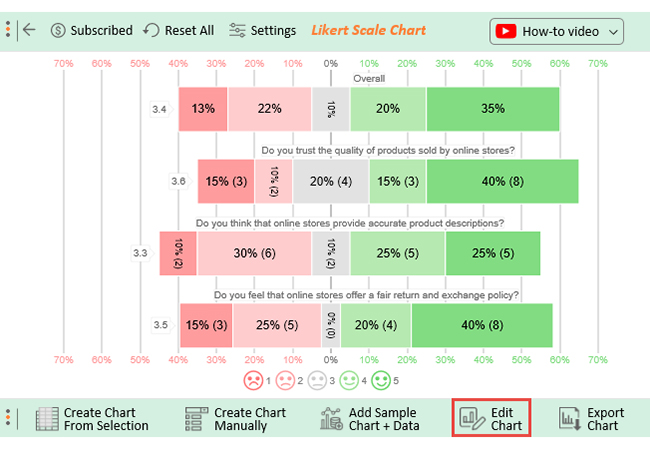
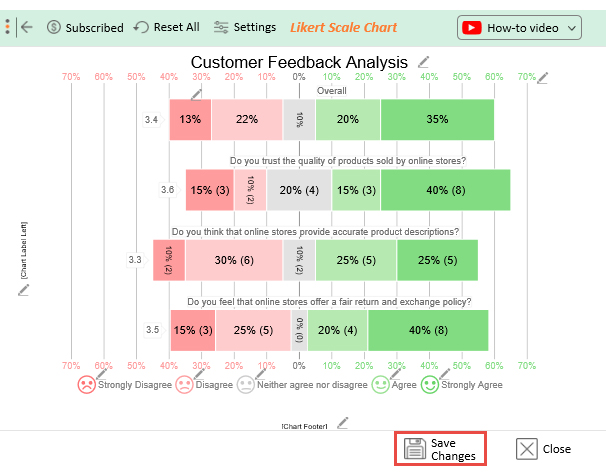
Let’s say you survey with Google Forms that yields the results below.

Do you agree with the quality of products sold by online stores? Do you agree that online stores provide accurate product descriptions? Do you agree that online stores offer a fair return and exchange policy?
Strongly Agree Agree Strongly Disagree
Neither agree nor disagree Disagree Agree
Strongly Agree Disagree Strongly Agree
Neither agree nor disagree Neither agree nor disagree Agree
Disagree Strongly Agree Strongly Disagree
Strongly Agree Disagree Strongly Agree
Agree Strongly Agree Agree
Neither agree nor disagree Strongly Agree Disagree
Agree Disagree Strongly Agree
Strongly Agree Strongly Disagree Strongly Agree
Strongly Disagree Agree Disagree
Strongly Agree Neither agree nor disagree Strongly Disagree
Neither agree nor disagree Disagree Disagree
Strongly Agree Strongly Agree Strongly Agree
Agree Agree Agree
Strongly Disagree Agree Disagree
Strongly Agree Strongly Agree Strongly Agree
Strongly Agree Strongly Disagree Strongly Agree
Disagree Agree Strongly Agree
Strongly Disagree Disagree  Disagree

This table contains example data. Expect many responses and questions in real life.

  • To get started with ChartExpo, install ChartExpo in Excel.
  • Now Click on My Apps from the INSERT menu.
insert chartexpo in excel
  • Choose ChartExpo from My Apps, then click Insert.
open chartexpo in excel
  • Once it loads, choose the “Likert Scale Chart” from the charts list.
search likert scale chart in excel
  • Click the “Create Chart From Selection” button after selecting the data from the sheet, as shown.
Create Chart From Selection ce397
  • When you click the “Create Chart From Selection” button, you have to map responses with numbers manually. The Likert scale has this arrangement:
    • Strongly Disagree=1
    • Disagree=2
    • Neither agree nor disagree=3
    • Agree=4
    • Strongly Agree=5
  • Once all is set, click the “Create Chart” button.
Map Likert Responses to Numbers ce397
  • ChartExpo will generate the visualization below for you.
How Does Google Forms Work Design Template
  • If you want to have the chart’s title, click Edit Chart, as shown in the above image.
  • Click the pencil icon next to the Chart Header to change the title.
  • It will open the properties dialog. Under the Text section, you can add a heading in Line 1 and enable Show.
  • Give the appropriate title of your chart and click the Apply button.
Apply Title on Chart ce397
  • Let’s say you want to add text responses instead of numbers against every emoji.
  • Click the pencil icon next to the respective emoji. Expand the “Label” properties and write the required text. Then click the “Apply All” button.
Apply Label on Chart ce397
  • Click the “Save Changes” button to persist the changes.
How Does Google Forms Work 1
  • Your final chart will appear below.
Final How Does Google Forms Work

Insights

  • 60% of customers agree with the fair and exchange policy of the online store, while 40% do not agree.
  • 50% agree that the descriptions of online products are accurate, 40% do not agree, and 10% remain neutral.
  • 55% agree with the quality of online stores’ products, 25% do not agree, and 20% are neutral.
  • Overall, 55% of customers responded positively to the survey questions, 35% gave negative responses, and 10% maintained neutrality.

FAQs

What is Google Forms?

Google Forms is a free online tool offered by Google that allows you to create surveys easily. It has a user-friendly interface and offers a variety of question types. Moreover, you can customize the forms with colors and images and analyze the data in real-time.

What are 4 ways to use Google Forms?

  1. Create surveys to gather feedback and opinions from customers or employees.
  2. Conduct quizzes or assessments for educational purposes or employee training.
  3. Organize event registrations and gather RSVPs from participants.
  4. Collect data for research purposes, market analysis, or customer satisfaction assessments.

What is Google Forms best at?

Google Forms excels at effortlessly creating, managing, and sharing surveys. It allows you to collect and save data to a spreadsheet easily. It offers features like previewing, sharing, and gathering responses to make the survey process seamless.

Wrap Up

Google Forms is an invaluable, versatile tool for effortless data collection and feedback gathering. Its user-friendly interface empowers you to design engaging and insightful forms without any coding experience.

Moreover, it has a wide array of question types, logic and branching options, and customization features. This enables you to create customized surveys, quizzes, and questionnaires tailored to your specific needs.

The seamless integration with other Google tools enhances its functionality and simplifies data analysis. Additionally, the collaborative nature of the platform allows teams to work together efficiently.

The benefits do not end here.

Google Forms’ ability to streamline analysis and offer actionable insights makes it an indispensable asset for decision-makers. The seamless integration with ChartExpo allows you to harness the full potential of your data. ChartExpo steps in to transform raw information into visually appealing and insightful visualizations.

Do not hesitate.

Spice your surveys and quizzes today with Google Forms and ChartExpo’s magic touch and watch your data soar.

How much did you enjoy this article?

GSAd1
Start Free Trial!
128612

Related articles

next previous
Surveys13 min read

5 Point Likert Scale Analysis, Interpretation & Examples

Dive deep into the realm of 5-point Likert Scale Analysis and Interpretation to unravel the sentiments behind your responses. Gain actionable insights today.

Surveys11 min read

3-Point Likert Scale: Range Interpretation & Analysis

Learn the basics of the 3-point Likert scale, including examples, benefits, and when it's best applied in research and feedback forms.

Surveys16 min read

Survey Data Collection: Definition, Methods and Analysis

Find the best methods of Survey data collection. Elevate your research game with practical tips for gathering, analyzing, and leveraging valuable information.

Surveys11 min read

5-Point Performance Rating Scale With Examples: Quick Guide

Discover how the 5-Point Performance Rating Scale helps organizations evaluate employee performance with clarity, consistency, and fairness across teams.

Surveys11 min read

How to Interpret 4-Point Likert Scale Results?

Click to learn How to Create, Gather and Analyze Data Using the 4-Point Likert Scale? A complete guide with definition, examples, uses, and applications.

ChartExpo logo

Turn Data into Visual
Stories

CHARTEXPO

  • Home
  • Gallery
  • Videos
  • Services
  • Pricing
  • Contact us
  • FAQs
  • Privacy policy
  • Terms of Service
  • Sitemap

TOOLS

  • ChartExpo for Google Sheets
  • ChartExpo for Microsoft Excel
  • Power BI Custom Visuals by ChartExpo
  • Word Cloud

CATEGORIES

  • Bar Charts
  • Circle Graphs
  • Column Charts
  • Combo Charts
  • Comparison Charts
  • Line Graphs
  • PPC Charts
  • Sentiment Analysis Charts
  • Survey Charts

TOP CHARTS

  • Sankey Diagram
  • Likert Scale Chart
  • Comparison Bar Chart
  • Pareto Chart
  • Funnel Chart
  • Gauge Chart
  • Radar Chart
  • Radial Bar Chart
  • Sunburst Chart
  • see more
  • Scatter Plot Chart
  • CSAT Survey Bar Chart
  • CSAT Survey Chart
  • Dot Plot Chart
  • Double Bar Graph
  • Matrix Chart
  • Multi Axis Line Chart
  • Overlapping Bar Chart
  • Control Chart
  • Slope Chart
  • Clustered Bar Chart
  • Clustered Column Chart
  • Box and Whisker Plot
  • Tornado Chart
  • Waterfall Chart
  • Word Cloud
  • see less

RESOURCES

  • Blog
  • Resources
  • YouTube
SIGN UP FOR UPDATES

We wouldn't dream of spamming you or selling your info.

© 2025 ChartExpo, all rights reserved.