• Home
  • Tools dropdown img
    • Spreadsheet Charts

      • ChartExpo for Google Sheets
      • ChartExpo for Microsoft Excel
    • Power BI Charts

      • Power BI Custom Visuals by ChartExpo
    • Word Cloud

  • Charts dropdown img
    • Chart Category

      • Bar Charts
      • Circle Graphs
      • Column Charts
      • Combo Charts
      • Comparison Charts
      • Line Graphs
      • PPC Charts
      • Sentiment Analysis Charts
      • Survey Charts
    • Chart Type

      • Box and Whisker Plot
      • Clustered Bar Chart
      • Clustered Column Chart
      • Comparison Bar Chart
      • Control Chart
      • CSAT Survey Bar Chart
      • CSAT Survey Chart
      • Dot Plot Chart
      • Double Bar Graph
      • Funnel Chart
      • Gauge Chart
      • Likert Scale Chart
      • Matrix Chart
      • Multi Axis Line Chart
      • Overlapping Bar Chart
      • Pareto Chart
      • Radar Chart
      • Radial Bar Chart
      • Sankey Diagram
      • Scatter Plot Chart
      • Slope Chart
      • Sunburst Chart
      • Tornado Chart
      • Waterfall Chart
      • Word Cloud
    • Google Sheets
      Microsoft Excel
  • Services
  • Pricing
  • Contact us
  • Blog
  • Support dropdown img
      • Gallery
      • Videos
      • Contact us
      • FAQs
      • Resources
    • Please feel free to contact us

      atsupport@chartexpo.com

Categories
All Data Visualizations Data Analytics Surveys
Add-ons/
  • Google Sheets
  • Microsoft Excel
  • Power BI
All Data Visualizations Data Analytics Surveys
Add-ons
  • Google Sheets
  • Microsoft Excel
  • Power BI

We use cookies

This website uses cookies to provide better user experience and user's session management.
By continuing visiting this website you consent the use of these cookies.

Ok

ChartExpo Survey


Home > Blog > Surveys

How to Connect Google Forms to Google Sheets?

Raw data scattered across email inboxes and shared drives costs teams hours every week. Google Forms to Google Sheets solves that problem by routing every submission directly into a structured spreadsheet the moment someone hits submit, with zero manual handling required.
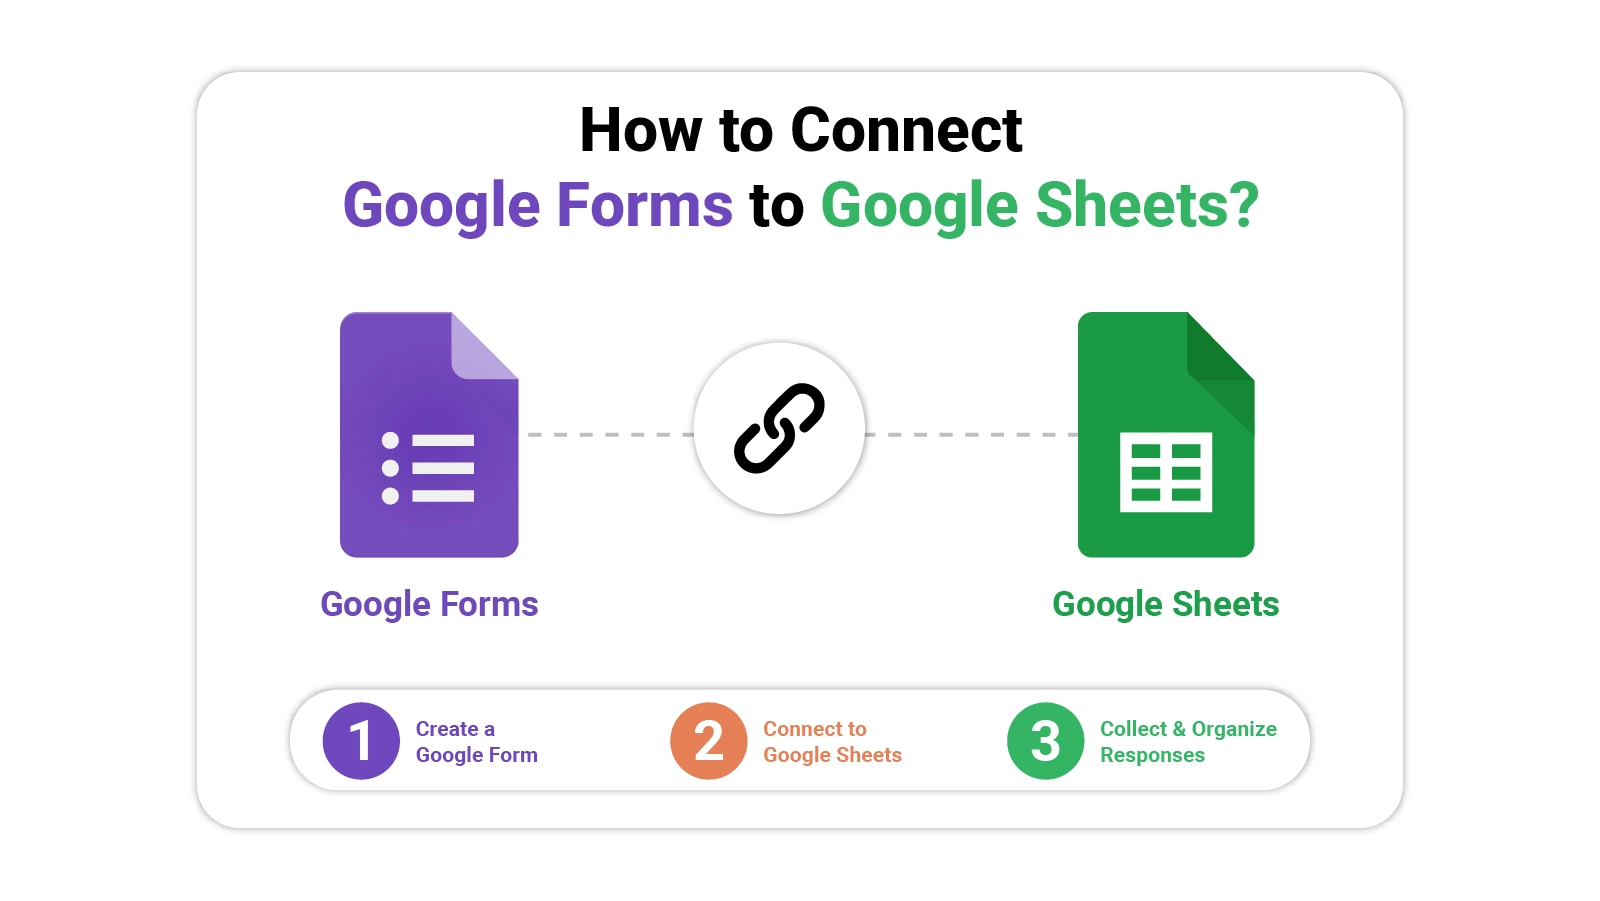
Google Forms to Google Sheets

Every response lands in the right column, labeled and ready to work with. This guide covers the connection methods, step-by-step setup, filtering techniques, real-world use cases, and best practices that help you get the most out of this workflow.

Whether you manage customer feedback, event registrations, or internal surveys, combining these two tools turns raw form data into organized, actionable information your team can use right away.

Why Connect Google Forms to Google Sheets?

Pairing these two Google tools turns scattered form submissions into a single, structured workspace where your team can read, sort, and act on information without switching applications or copying data by hand. Here’s why this connection is essential:

Here’s why this connection is essential:

  • Easy data collection: Submissions land in one place automatically, with no manual entry needed.
  • Real-time updates: New entries appear in the sheet the instant a respondent submits the form.
  • Centralized storage: Every response lives in a single, organized location your whole team can reach.
  • Automated organization: Incoming answers populate rows and columns immediately, keeping structure consistent.
  • Simplified reporting: Built-in tools let you build summaries, charts, and snapshots from the data fast.
  • Collaboration with team: Any team member with access can view or edit the sheet at the same time.
  • Data backup: All submissions are stored securely in Google Drive, protecting against accidental loss.

This setup is especially useful when you are exploring how Google Forms work in practical scenarios like customer feedback collection or employee surveys.

Methods of Connecting Google Forms to Google Sheets

You can connect Google Forms to Google Sheets in several ways, each suited to different levels of complexity and workflow requirements.
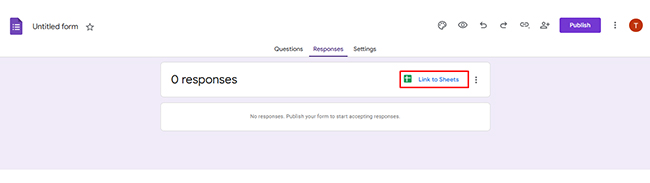
  • Direct linking: Select the built-in “Link to Sheets” option in the Responses tab to push form answers into a spreadsheet in real time.
Google Forms to Google Sheets
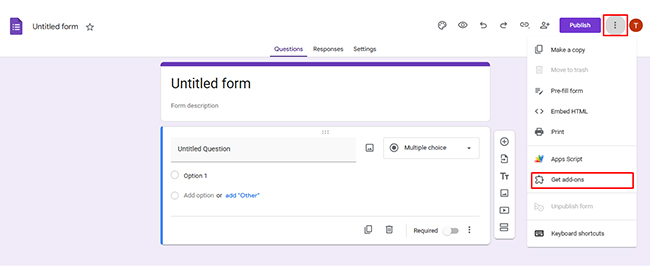
  • Add-ons: Install Marketplace extensions that expand what you can do, such as routing data to multiple sheets or triggering notifications automatically.
Google Forms to Google Sheets
  • Third-party tools: Use external automation platforms to build multi-step integrations, particularly when your form data needs to flow into other apps or complex pipelines.

If you are just getting started with how to create a survey in Google Forms, the direct linking method is the fastest path to a working connection.

Key Steps to Link Google Forms to Google Sheets

Setting up the link between these tools takes only a few minutes. Follow the steps below so your form responses flow automatically into a spreadsheet.

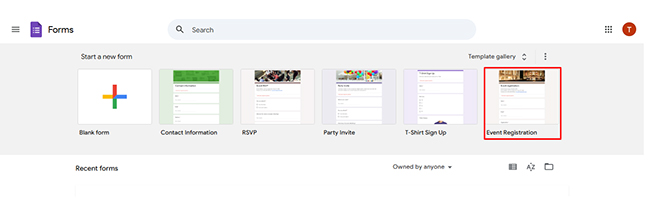
  • Open Google Form

Go to Google Forms and open the form you want to connect; if you haven’t created one yet, select an existing form from your dashboard.
Google Forms to Google Sheets
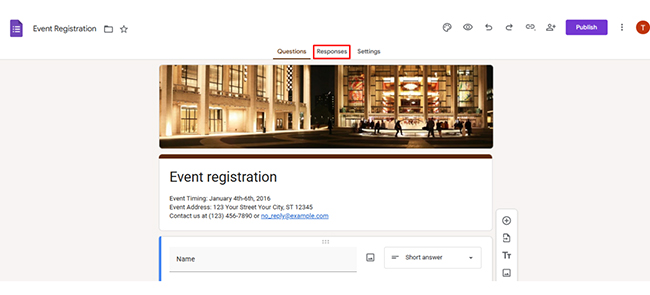
  • Click Responses Tab

At the top of the form editor, click on the “Responses” tab, where all submitted answers are collected and managed.
Google Forms to Google Sheets
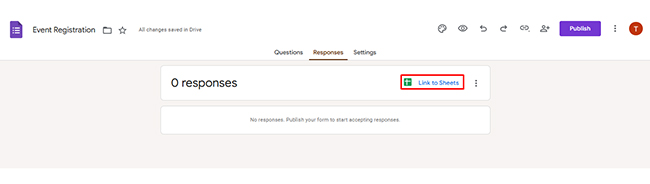
  • Select “Link to Sheets”

Inside the Responses tab, click the green Google Sheets icon to start linking your form to a spreadsheet.
Google Forms to Google Sheets
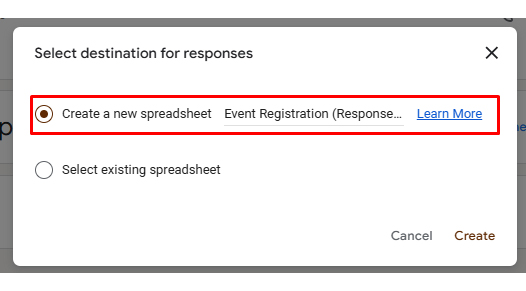
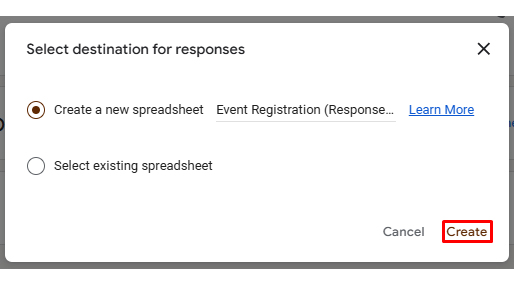
  • Create New or Select Sheet

A pop-up will appear where you can either create a new spreadsheet or choose an existing one to store responses.
Google Forms to Google Sheets
  • Confirm Connection

Click “Create” or “Select” to finalize the connection, and your form will now be linked to the chosen spreadsheet.
Google Forms to Google Sheets
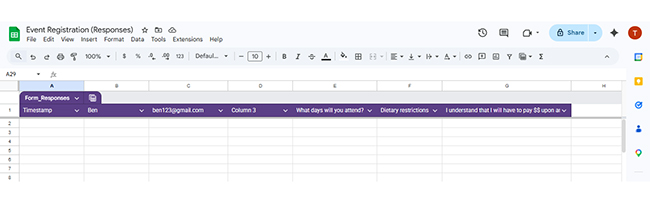
  • Test Data Flow

Submit a sample response in your form and check if it appears correctly in the sheet to ensure everything is working properly.
Google Forms to Google Sheets

Completing these steps lets you efficiently link from Google Sheets and keeps your response data current at all times. This is particularly valuable when you are collecting survey questions such as multiple-choice, rating-scale, or open-ended prompts.

How to Filter Responses from Google Forms to Google Sheets?

Once responses start arriving, filtering lets you isolate exactly the data you need for meaningful insights in your Google Forms-to-Google Sheets workflow.

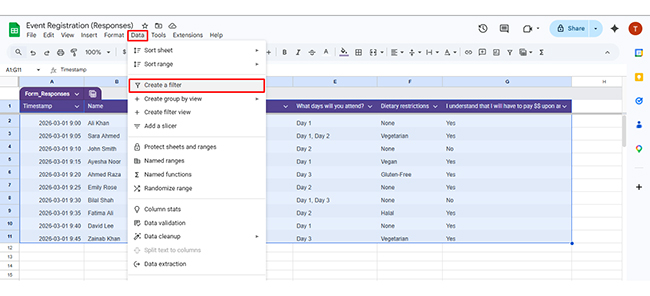
  • Use Filter view:

Select your data range, click Data → Create a filter, and use the dropdown arrows in each column to show only the data you need.
Google Forms to Google Sheets
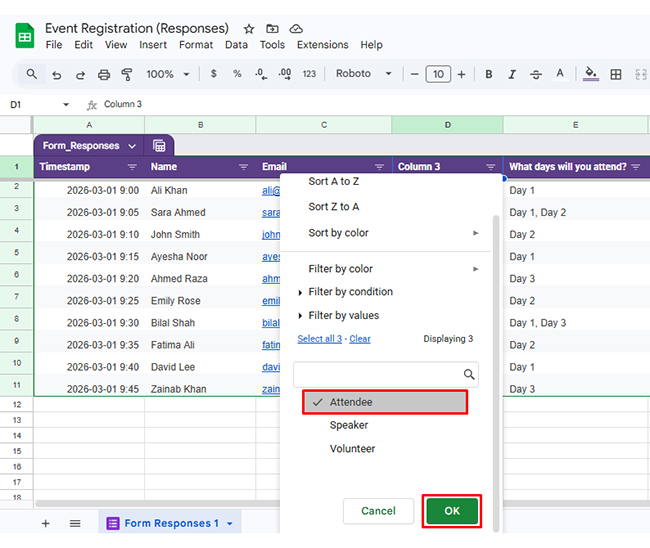
  • For example, you can click the dropdown in the “Column 3” field and select only “Attendee” to display specific records, making it easier to focus on a particular group.
Google Forms to Google Sheets
  • Apply conditions

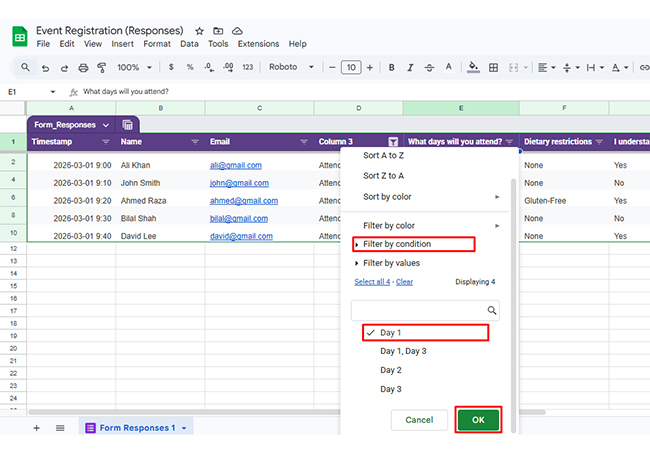
Click a column filter icon and set conditions, for example, click the filter icon in “What days will you attend?”, choose Filter by condition → Text contains, and enter “Day 1” to display relevant responses.
Google Forms to Google Sheets
  • Sort data

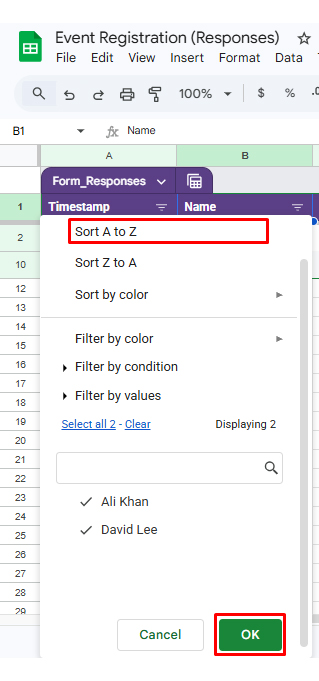
To sort data, use the dropdown in the “Name” column to select Sort A → Z, or sort the “Timestamp” column to view the latest entries first.
Google Forms to Google Sheets
  • Create a pivot table

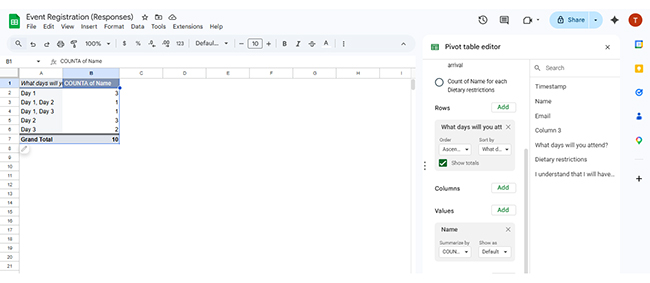
To create a pivot table, go to Insert → Pivot table, add “What days will you attend?” as Rows and “Name” as Values (COUNT) to summarize attendance.
Google Forms to Google Sheets
  • Use formulas

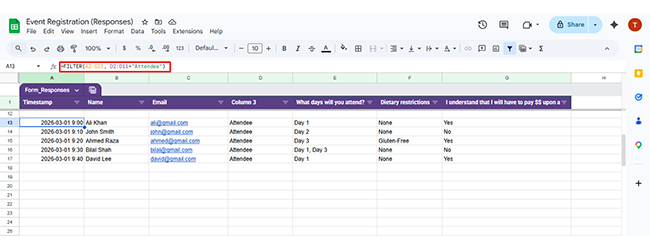
Apply formulas like FILTER, QUERY, or IF to automatically extract and display only relevant data based on defined rules. For example, click on an empty cell and enter a formula like =FILTER(A2:G11, D2:D11=”Attendee”), then press Enter.

This will automatically extract only attendee data into a new section, allowing you to analyze filtered results dynamically without modifying the original dataset.
Google Forms to Google Sheets

These techniques make it far simpler to handle large datasets and support data analysis in Google Sheets for sharper, faster decision-making.

Top 3 Google Forms to Google Sheets Use Cases

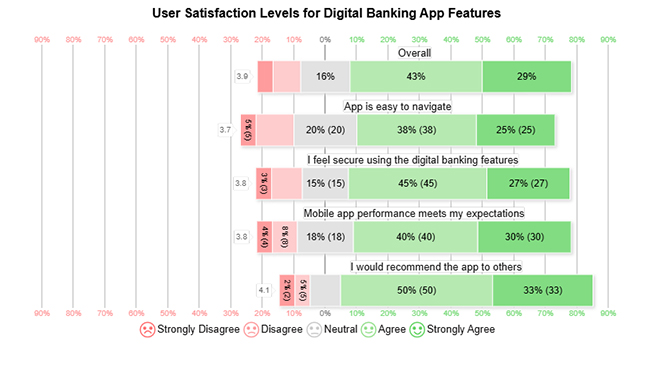
  • Digital Banking App Satisfaction Analysis

The digital banking app satisfaction analysis maps how user ratings across key product features reveal overall experience levels and areas of trust, pointing to both strengths and opportunities for improvement.

Example Insight: Shows user sentiment patterns across features to support product and experience decisions.
Google Forms to Google Sheets
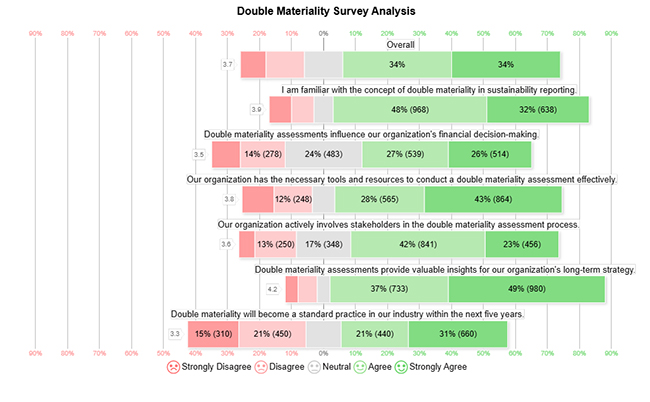
  • Double Materiality Survey Analysis

The double materiality survey analysis reflects broad agreement on the strategic value of the framework and its current organizational applications, while showing more varied views on how quickly the wider industry will adopt it.

Example Insight: Signals strong confidence in long-term value alongside measured uncertainty about sector-wide uptake.
Google Forms to Google Sheets
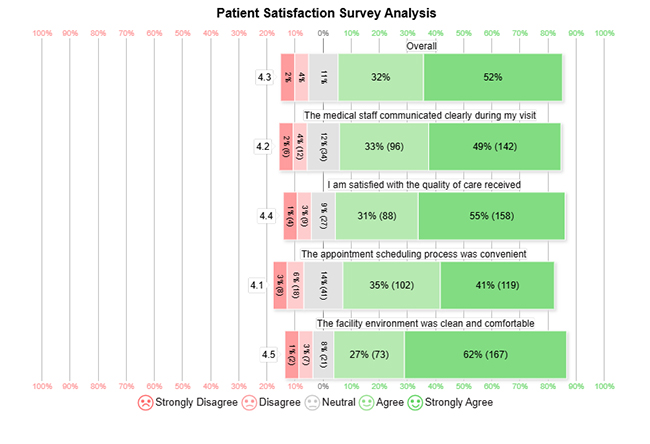
  • Patient Satisfaction Survey

The patient satisfaction survey reveals a broadly positive experience, with cleanliness and quality of care drawing the highest scores, while appointment scheduling receives slightly lower ratings.

Example Insight: Points to strong overall satisfaction with a targeted opportunity to streamline the booking process.
Google Forms to Google Sheets

Google Forms to Google Sheets: Analyzing Responses

Analyzing responses in Google Forms to Google Sheets converts collected submissions into decisions. Follow these structured steps to perform effective analysis:

  • Step 1: Prepare and Structure Response Data

Ensure your response data is properly organized with clear headers like name, attendance days, and categories. A clean structure makes it easier to filter, sort, and analyze responses without confusion.

  •  Step 2: Segment Responses for Better Understanding

Group responses based on categories such as attendee type or selected days. This helps you quickly identify patterns, like how many users are attending each day or category.

  • Step 3: Filter and Sort Key Information

Use filtering and sorting to focus on specific responses, such as attendees for Day 1 or only speakers. This allows you to narrow down large datasets and analyze relevant information efficiently.

  • Step 4: Summarize Data with Pivot Tables

Create pivot tables to count and group responses, such as total participants per day. This simplifies large datasets and provides a clear summary for comparison.

  • Step 5: Use Formulas to Extract Insights

Apply formulas like COUNTIF or FILTER to calculate totals or extract specific groups. This helps automate analysis and reduces manual effort.

  • Step 6: Visualize Survey Results Clearly

Use charts like Bar or Pie Charts to present trends such as attendance distribution. Tools like ChartExpo can help create more advanced visuals for better survey results presentation.

  • Step 7: Interpret Findings for Actionable Insights

Analyze the results to identify trends, such as peak attendance days or common preferences, and use these insights to improve planning and decision-making.
Google Forms to Google Sheets

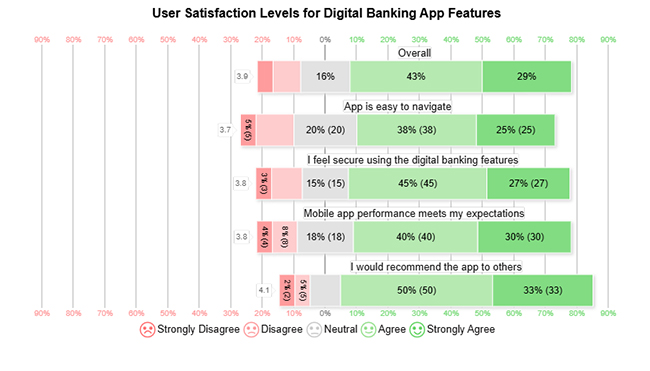
Key Insights

  • Positive sentiment dominates across app features, with most respondents landing in the Agree or Strongly Agree categories.
  • Security and recommendation stand out as top-rated areas, recording Strongly Agree rates of around 45% and 50% respectively.
  • Navigation and performance score well overall, yet show a higher share of neutral responses and less Strongly Agree momentum than the other measured areas.

Benefits of Connecting Google Forms to Google Sheets

Linking form to Google Sheet gives individuals and teams a reliable system for handling response data without the overhead of manual processes.

  • Real-time updates: Submissions appear in the connected sheet immediately after the form is completed.
  • Easy tracking: All responses are visible in one place, so reviewing and monitoring data requires no extra effort.
  • Centralized data: A single, organized location holds every collected record, making retrieval fast and straightforward.
  • Better collaboration: Team members can view, add notes, and analyze the same sheet at the same time.
  • Quick reporting: You can produce charts, summaries, and comparisons using the sheet’s built-in tools without exporting anything.
  • Data backup: Every submission is stored in Google Drive, cutting the chance of losing important records.

These advantages make the setup ideal for anyone managing a survey in Google Sheets, particularly when response volumes are high or ongoing.

Best Practices for Google Forms to Google Sheets Integration

Getting the most out of Google Forms to Google Sheets requires a consistent approach to organization, accuracy, and workflow design.

  • Regular checks: Review your sheet frequently to confirm that responses are syncing correctly and that no data errors have crept in.
  • Use clear headings: Give each column a descriptive label so anyone opening the sheet can understand what the data represents at a glance.
  • Avoid duplicate forms: Stick to a single form for each data collection task to prevent overlapping records and inconsistent inputs.
  • Protect sensitive data: Set appropriate sharing permissions and access controls to keep confidential responses private.
  • Keep Sheet organized: Maintain consistent formatting and a logical column order so the data stays readable as it grows.
  • Automate tasks: Use built-in formulas and tools to handle repetitive work, cutting down on manual intervention.

Applying these habits will increase efficiency and help you manage Google Forms responses with far fewer errors or disruptions.

Challenges of Linking Google Forms to Google Sheets

While linking a form to a Google Sheet is a powerful setup, several common issues are worth knowing about before you rely on it for high-stakes data.

  • Data errors: Poorly worded or ambiguous form questions can produce inconsistent or inaccurate entries that skew your analysis.
  • Missing responses: Network interruptions or browser issues at submission time can occasionally prevent a response from reaching the sheet.
  • Sync issues: Brief delays or connectivity problems may slow down the transfer of new entries between the form and the spreadsheet.
  • Sheet overload: High submission volumes can slow performance, making the sheet harder to navigate or process with formulas.
  • Formula errors: Incorrectly referenced cells or wrong formula logic can return misleading results that go unnoticed without regular review.
  • Access permissions: Overly restrictive or poorly configured sharing settings can lock out team members who need to view or update the data.

Keeping these points in mind helps you spot problems early and apply Google Sheets tips and tricks that keep your workflow running reliably.

FAQs

How to collect data from Google Forms to Google Sheets?

Open your form, go to the Responses tab, and click the Google Sheets icon to link it to a spreadsheet. Once that connection is set up, every new submission flows into the sheet automatically, making the entire Google Forms-to-Google Sheets data collection process hands-free.

Can you embed a Google Form into a Google Sheet?

Direct embedding is not supported. You can, however, link the two so that all form responses populate the spreadsheet automatically, giving you the same practical outcome without an embedded view.

Can I attach a Google Sheet to a Google Form?

Yes. Navigate to the Responses tab in your form and select the Sheets icon to attach an existing spreadsheet or create a new one. From that point, the sheet receives every response and stores it in a structured row.

Wrap Up

Google Forms to Google Sheets is one of the most practical combinations in the Google Workspace ecosystem. By routing every form submission directly into a structured spreadsheet, teams eliminate data entry delays, reduce errors, and give everyone access to the same current source of information.

From filtering and pivot tables to formula-driven analysis and visual reporting, the methods and steps covered in this guide provide a complete toolkit for turning raw submissions into clear, usable findings. Apply the best practices outlined here, stay alert to the common challenges, and your data pipeline will stay accurate and efficient over the long term.

How much did you enjoy this article?

GSAd1
Start Free Trial!
122520

Related articles

next previous
Surveys8 min read

Product Survey Questions: Product Survey Made Visual

Product survey questions reveal what customers truly think. Learn how to ask the right ones and act on the survey results. Read on!
Surveys11 min read

5-Point Performance Rating Scale With Examples:Quick Guide

Learn how the 5-Point Performance Rating Scale improves employee evaluations with clear, consistent, and fair performance reviews across teams.

Surveys9 min read

Fun Survey Questions: Turn Responses into Insights

Fun Survey Questions can raise response rates, reveal patterns, and guide survey planning across teams, classrooms, and customer research. Read on!


Surveys8 min read

How to Interpret 4-Point Likert Scale Results?

Learn how to create, collect, and analyze data using a 4-point Likert scale. A complete guide with definition, examples, advantages, and practical applications.

Surveys11 min read

5 Point Likert Scale: Analysis, Interpretation and Examples

Learn how to analyze and interpret a 5-point Likert scale with examples, charts, and step-by-step methods to turn survey responses into actionable insights.

ChartExpo logo

Turn Data into Visual
Stories

CHARTEXPO

  • Home
  • Gallery
  • Videos
  • Services
  • Pricing
  • Contact us
  • FAQs
  • Privacy policy
  • Terms of Service
  • Sitemap

TOOLS

  • ChartExpo for Google Sheets
  • ChartExpo for Microsoft Excel
  • Power BI Custom Visuals by ChartExpo
  • Word Cloud

CATEGORIES

  • Bar Charts
  • Circle Graphs
  • Column Charts
  • Combo Charts
  • Comparison Charts
  • Line Graphs
  • PPC Charts
  • Sentiment Analysis Charts
  • Survey Charts

TOP CHARTS

  • Sankey Diagram
  • Likert Scale Chart
  • Comparison Bar Chart
  • Pareto Chart
  • Funnel Chart
  • Gauge Chart
  • Radar Chart
  • Radial Bar Chart
  • Sunburst Chart
  • see more
  • Scatter Plot Chart
  • CSAT Survey Bar Chart
  • CSAT Survey Chart
  • Dot Plot Chart
  • Double Bar Graph
  • Matrix Chart
  • Multi Axis Line Chart
  • Overlapping Bar Chart
  • Control Chart
  • Slope Chart
  • Clustered Bar Chart
  • Clustered Column Chart
  • Box and Whisker Plot
  • Tornado Chart
  • Waterfall Chart
  • Word Cloud
  • see less

RESOURCES

  • Blog
  • Resources
  • YouTube
SIGN UP FOR UPDATES

We wouldn't dream of spamming you or selling your info.

© 2026 ChartExpo, all rights reserved.