Categories
By ChartExpo Content Team
Ever wondered what makes a data analyst tick? This role is a cornerstone in many industries, and its importance is only growing. So, what does a data analyst do? Let’s unpack this role and see why it’s so vital.
First, let’s tackle the big question: what does a data analyst do? Simply put, data analysts transform raw data into meaningful insights. They collect, process, and analyze data to help companies make informed decisions. It’s about turning numbers into narratives that drive action.
What does a data analyst do daily? They gather data from various sources, clean it up, and then dive into analysis. They use spreadsheets, SQL, and Python to find trends and patterns. Creating reports and visualizations, helps teams understand what the data is saying.
The impact of what a data analyst does is huge. They help businesses understand their performance, customer behavior, and market trends. This role is all about making data work for you. So, whether you’re looking to boost sales, improve operations, or understand your audience, a data analyst can be your guide.
First…
In today’s fast-paced environment, data is everywhere. But raw data, on its own, isn’t much help. The core purpose of data analysis is to turn this raw information into something useful. Data analysts do this by breaking down large sets of numbers and translating them into meaningful insights. These insights help businesses make data-driven decisions that drive growth and efficiency. It’s like taking a jumbled puzzle and putting the pieces together to see the whole picture.
Think of data analysts as the bridge between numbers and real-world decisions. They don’t just collect data; they interpret it. By doing so, they help businesses move from “What do these numbers mean?” to “Here’s what we should do next.” It’s a crucial role because, without this translation, data would be useless. Data analysts make sure that the right people get the right information at the right time.
Data analysis is no longer just about looking at the past. It’s about predicting the future. As technology advances, the role of data analysts is growing. They’re not just looking at what happened yesterday; they’re helping companies anticipate what’s coming tomorrow.
This shift is transforming how businesses operate, making data analysis more important than ever. However, the influx of data can sometimes lead to analysis paralysis, where the abundance of information hinders decision-making. Data analysts are at the forefront of this change, guiding businesses through a landscape that’s always in motion.
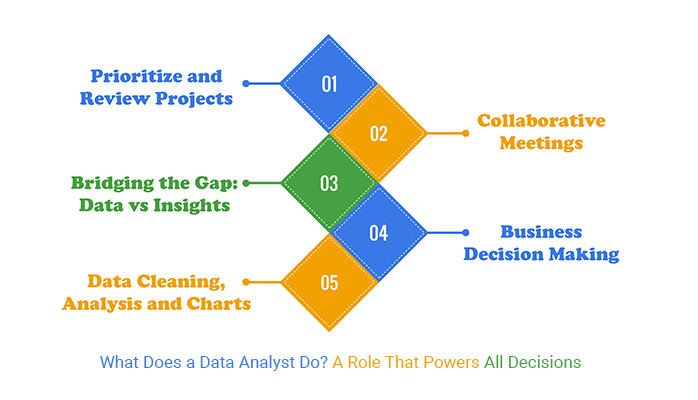
Every morning kicks off with a quick check of the day’s priorities. A data analyst’s inbox is a mix of project updates, urgent requests, and maybe a few surprises. First, they scan for anything pressing, like a last-minute change from a stakeholder. Keeping an eye on project status reports is crucial, as these documents provide a snapshot of where each project stands, helping the analyst prioritize tasks and address any urgent issues promptly.
Then, it’s about getting organized. Which projects need attention today? What’s on hold? What’s moving forward? Setting the day’s game plan is key. It’s not about juggling everything; it’s about focusing on what matters most.
Meetings are a big part of the day. But it’s not just sitting around chatting. These meetings are where the real work gets discussed. Analysts sit down (virtually or in person) with team members, managers, or clients.
They talk about data needs, project goals, and timelines, emphasizing the importance of data democratization to ensure everyone has access to the insights they need. It’s a chance to get everyone on the same page. Sometimes, it’s a brainstorming session. Other times, it’s about clarifying what the data shows. Either way, it’s all about clear communication.
After lunch, it’s go-time. The afternoon is for deep work, the kind that requires focus and concentration. Data cleaning is often the first step. This is where analysts dig into the raw data, employing various data cleansing techniques to ensure everything’s accurate and ready for analysis. By removing inconsistencies and errors, they pave the way for meaningful insights and reliable outcomes.
Then comes the analysis itself – running models, creating reports, or building best-designed dashboards. This is where the numbers start telling their story. Visualization is the final touch, transforming the data into compelling visual storytelling. This makes the data easy to understand for non-data folks, turning raw numbers into something meaningful and actionable.
As the day winds down, it’s time to tie up loose ends. Analysts document their findings, writing up reports or updating dashboards. It’s not just about what they found, but how they found it—whether through trend lines, segmentation, or calculating the No. of Days Between 2 Dates. This helps keep everything transparent and makes it easier to pick up where they left off the next day.
Before logging off, they take a few minutes to plan tomorrow. What’s next on the list? Any new priorities? A quick look ahead helps keep things on track.
You can’t be a data analyst without knowing SQL. It’s the backbone of data analysis. SQL is how you talk to databases, ask them questions, and get the answers you need. Whether you’re pulling data for a report or building a complex query, SQL is your go-to tool. Without it, you’d be lost in the data jungle.
Think Excel is just for simple tables? Think again. Excel is like a universal tool for data analysts. From pivot tables to complex formulas, Excel helps you crunch numbers, find patterns, and present data in a way that makes sense. It’s not just about rows and columns; it’s about turning data into insights that everyone can understand.
Sometimes, SQL and Excel aren’t enough. That’s where Python or R comes in. These coding languages let you handle big data, create visualizations, and perform advanced statistical analysis. They help you dig deeper into the data, for trend analysis and patterns that might not be obvious at first glance. Learning Python or R takes your analysis to the next level.
Data by itself doesn’t tell a story; you do. As a data analyst, you need to explain what the numbers mean in a way that others can understand. This means knowing your audience and speaking their language, whether it’s through a presentation, a report, or a casual conversation.
For example, using techniques like cohort analysis can help reveal trends and insights over time, enhancing your ability to communicate effectively. Good communication turns data into decisions.
Data analysis is more than just crunching numbers. It’s about asking the right questions before you even start. What problem are you trying to solve? What data do you need? Critical thinking helps you focus your analysis, avoid wasted time, and find the answers that matter.
It’s not about having all the answers – it’s about knowing which questions to ask.
Data analysts often have multiple projects on their plate. Prioritizing, staying organized, and managing your time effectively is key. Whether you’re working on a tight deadline or balancing competing demands, good time management keeps you on track and ensures that you deliver quality work on time.
It’s about staying cool under pressure and getting the job done.
Every journey needs a map. For a data analyst, that map starts with understanding the problem. You can’t solve what you don’t know, right? The first step is to clarify the objectives. What are you trying to figure out? What questions need answers? This is where you define the scope – what’s in, what’s out. Clear objectives keep you on track and focused.
Once you’ve got your map, it’s time to collect the pieces of the puzzle. Data doesn’t magically appear. You’ve got to dig it up. A data analyst pulls data from all kinds of sources – databases, surveys, sensors, you name it. The goal? Get the right data and enough of it. But, watch out! If you grab junk data, you’ll end up with junk results.
Collected data isn’t always pretty. Think of it like washing veggies before cooking – cleaning data is a must. You remove errors, fix inconsistencies, and deal with missing information. It’s like giving your data a good scrub before you start cooking up insights. Clean data leads to trustworthy results, and trust me, no one wants dirty data.
Now that your data’s sparkling clean, it’s time to dig in. This is where the fun begins. Exploratory data analysis (EDA) is about uncovering patterns, spotting trends, and seeing what the data is trying to tell you. It’s like being a detective – looking at data from every angle to figure out what’s going on. You’ll plot graphs, use a Treemap, run simple stats, and start piecing together the story.
With the story shaping up, you dive deeper. Statistical analysis is where you apply mathematical models to understand your data. Think of it as the heavy lifting part of the job. You’re not guessing here; you’re using solid math to pull out insights. This is where correlations, regressions, and predictions come into play. It’s all about turning numbers into knowledge.
Numbers are great, but they’re not always easy to digest. That’s where data visualization comes in. You turn those stats into engaging charts and graphs that tell the story at a glance. With various types of charts and graphs, you can highlight trends, comparisons, and key insights effortlessly. Visuals make it easy for others to understand what’s going on, transforming complex data into a clear and compelling narrative.
One tool that helps here is ChartExpo. It’s a handy tool for creating interactive data visualizations that make your data come alive. Whether it’s a bar graph, dot plots, slop charts, or heat maps, good visuals are key to effective communication.
Finally, you’ve got to share what you’ve found. Data analysis isn’t worth much if no one understands the results. You interpret the data, draw clear conclusions, and then report your findings. This is where you excel in analyzing and interpreting data, telling the story, and tying everything back to those initial objectives. Keep it clean, keep it simple. Your goal is to make sure everyone gets the message, whether they’re data-savvy or not.
Transform your raw numbers into visual masterpieces and discover the magic of a data analyst’s work. Dive into the process and see how data comes to life with vivid charts, making your insights more engaging and impactful. What does a data analyst do? They turn data into a compelling story you can see and understand in every detail.


Messy data is a daily grind for data analysts. Imagine trying to piece together a puzzle with missing or damaged pieces. It’s frustrating, right? But it’s part of the job. First, know your tools. Whether it’s spreadsheet, Python, or R, get comfortable with them. They’re your best friends. Start with identifying missing values, duplicates, and outliers. Then, clean up the mess – fill in gaps, remove duplicates, and decide how to handle outliers. It’s not glamorous, but it’s essential.
Stakeholders often want miracles from data. They’ve got big ideas, and you’ve got to show how data supports – or sometimes refines – those ideas. First, set clear expectations. What can the data realistically tell us? Then, communicate. Keep them in the loop with regular updates, and speak their language. Avoid jargon. Instead, tie your analysis directly to business goals. Make it clear how your work impacts their decisions. You’re the bridge between data and action – make sure they see the connection.
Data analysis isn’t static – it’s always moving forward. To stay on top, you’ve got to keep learning. But don’t panic. Start small. Follow industry blogs, take online courses, and participate in webinars. The key is consistency. A little time each week adds up.
Also, connect with others in the field. Networking isn’t just about finding jobs; it’s about sharing knowledge. Stay curious, and remember, you don’t need to know everything – just enough to keep pushing forward.
Here’s the classic dilemma: Should you focus deeply on one area or know a bit about everything? Both paths have their perks. Specializing makes you an expert in one area, but generalizing keeps you flexible. What’s the right choice? It depends on your goals.
If you love diving deep into one topic, go for specialization. But if you enjoy variety, keep your skills broad. It’s about finding the right balance for you. Either way, stay adaptable because the landscape is always shifting.
In finance, data analysts are the sentinels of security. They sift through mountains of transaction data, spotting patterns that might signal fraudulent activity. Ever wonder how your bank catches odd charges so fast? That’s a data analyst at work.
By crunching numbers, they assess risks, helping institutions avoid financial disasters. Imagine a data analyst as the one who notices the small leaks in a dam before it bursts. They analyze, predict, and keep the financial systems secure.
In healthcare, data analysts are the quiet architects of better outcomes. They collect and analyze patient data to spot trends in treatment effectiveness. For example, if a particular medication works better for certain patients, analysts will find that out. This is the power of healthcare analytics at work.
They also help hospitals manage their resources – think of them as the ones who ensure the hospital doesn’t run out of beds or staff during a busy flu season. By understanding where resources are most needed, healthcare analytics help save lives and money.
In e-commerce, data analysts are the matchmakers between products and customers. They study buying habits to figure out what customers want before the customer even knows it. Ever wonder why the perfect product shows up in your recommendations? That’s data analysis in action.
They also optimize inventory, ensuring that popular items are always in stock while avoiding overstock of items that don’t sell. It’s like making sure your favorite candy is always available at the checkout aisle.
In marketing, data analysts are the strategists behind successful campaigns. They measure the impact of marketing efforts, helping companies figure out what works and what doesn’t, including insights gained from market segmentation.
Think of them as the ones who know which TV commercial or social media post will get the most attention, including insights from the analytics of YouTube, all documented in a comprehensive marketing report.
They also segment customers into groups, making it easier to target the right audience with the right message. It’s like knowing which friends will enjoy a movie before you even send the invite. A well-crafted marketing report provides the insights needed to tailor strategies and maximize impact.
In manufacturing, data analysts are the guardians of quality. They analyze production data to spot defects before they turn into costly problems. Imagine them as the inspectors who catch a loose bolt before it causes a breakdown.
They also optimize the supply chain, ensuring materials arrive on time and production runs smoothly. It’s like being the person who plans the perfect road trip, making sure every stop is timed just right to keep things moving without a hitch. Key performance indicators for the manufacturing industry are their tools, helping to measure efficiency, quality, and productivity to drive continuous improvement.
So, you’re starting as a junior data analyst. What’s next? Moving up isn’t just about time served; it’s about mastering the tools, understanding the data, and showing you can deliver insights that matter.
As you gain experience, you start tackling more complex projects. Your skills sharpen, and soon, you’re the go-to person for the trickiest data puzzles. From there, senior roles open up. You might lead a team, manage larger datasets, or handle projects with a bigger impact. The key is to keep learning and stay curious.
Data analysis is your base, but where can it take you? Some analysts shift into data science, diving deeper into machine learning and predictive models. Others lean toward business intelligence analytics, focusing on turning data into actionable strategies for the company.
These moves aren’t about leaving your role behind; they’re about expanding your toolkit. Whether it’s crunching numbers in Python or creating dashboards that drive decisions, these paths let you branch out while still building on what you already know. It’s about evolving your skills to stay ahead in the data-driven world.
Not all analysts are the same. Some specialize, focusing on a particular industry or method. Maybe you’re fascinated by healthcare data, or you’ve got a knack for financial forecasting. By zeroing in on a niche, you become the expert others rely on. It’s about finding what excites you and digging in.
Over time, your reputation grows, and so do your opportunities. This kind of expertise can set you apart, opening doors to roles where your specific knowledge is in high demand.
Leadership isn’t for everyone, but if you’re interested, there are clear paths to follow. You might start by mentoring junior analysts, sharing your experience, and helping them grow. From there, management roles can follow, where you’re not just analyzing data but also leading a team and making strategic decisions.
Alternatively, consultancy might appeal to you, where you bring your data skills to different companies, solving unique challenges. Either way, moving into leadership or consultancy is about more than just numbers; it’s about vision and communication.
Data analysts handle loads of data, and with that comes a big responsibility. Keeping sensitive information safe isn’t optional; it’s a must. Whether it’s customer details or company secrets, a data analyst needs to make sure it’s all locked down tight.
Encrypting data, using secure storage, and controlling access are a few ways to keep prying eyes out. If you’re sharing data, it’s important to anonymize it. This means stripping out any details that could link the data back to a person. It’s like putting up a high fence around your backyard – keeps the right people in and the wrong ones out.
Bias in data can sneak in quietly, and when it does, it messes up everything. A data analyst needs to be on the lookout for it. Imagine you’re baking cookies but keep adding salt instead of sugar – you’ll end up with a bad batch.
The same goes for bias in data analysis. If you don’t catch it, your results could be skewed, leading to unfair outcomes. Regularly check your data sources and methods. Use tools that help spot biases and remove them. It’s like cleaning your glasses before you read – everything’s clearer when the lenses are spotless.
Ever tried to follow a recipe with missing steps? It’s frustrating, right? The same happens when data analysts don’t document their methods. Transparency is key. Every step taken, every tool used, and every decision made should be written down.
This way, others can follow the same process and get the same results. It’s like leaving a trail of breadcrumbs for those who come after you – clear, straightforward, and easy to follow. It’s not just about getting it right once; it’s about making sure anyone can get it right again.
AI and machine learning aren’t science fiction – they’re transforming the way data analysts work today. You’re probably noticing how these technologies are automating tasks that used to take hours, even days. Imagine sifting through mountains of data and having algorithms do the heavy lifting. This is AI for data analytics in action, freeing you up to focus on what matters – finding insights that machines can’t.
But don’t get too comfortable. These technologies are constantly evolving. Staying ahead means you’ve got to keep learning. Dive into how AI models work, not just what buttons to press. Understanding the “why” behind the tech keeps you in the driver’s seat, ensuring you harness its full potential while staying relevant in a rapidly changing field.
Big data isn’t just a buzzword anymore – it’s your reality. The data you deal with is getting bigger, faster, and more complex. But here’s the kicker: it’s not just about handling large amounts of data. It’s about making sense of it. You’ve got to develop strategies to filter out the noise and focus on the signals that matter.
This means sharpening your skills in data management tools and platforms. Tools that can handle the load, and maybe a bit more. And it’s not just about technical skills – understanding the business side is key too. Knowing what data is worth diving into can save you time and energy.
Automation is reshaping the job. Some tasks that used to be a part of your daily routine are getting automated. That’s not a threat – it’s an opportunity. By automating repetitive tasks, you can focus on higher-level analysis. But, you need to adapt.
Learn to work with automation, not against it. This means understanding how automated tools work and where they fit into your workflow. Don’t be afraid to pivot your role to include more strategic thinking and less data crunching. Automation can’t replace the human touch you bring to interpreting data.
Data analysis isn’t a solo gig anymore. You’re part of a larger team that includes marketers, developers, and even legal folks. Each brings something to the table. To solve complex problems, you’ve got to speak their language. This means understanding the basics of what they do and how it connects to your work.
Collaboration is key. It’s not just about sharing data; it’s about sharing ideas. Sometimes the best insights come from conversations with someone outside your field. So, build those bridges. The problems you’re tackling aren’t confined to spreadsheets – they’re real-world issues that need diverse perspectives.
A data analyst collects, processes, and interprets data to help organizations make informed decisions. They transform raw numbers into meaningful insights that drive actions.
A data analyst needs strong analytical skills, proficiency in tools like Excel, SQL, and Python, and an understanding of data visualization. They should also communicate findings clearly to non-technical folks.
A data analyst’s day involves cleaning data, running queries, creating reports, and meeting with teams to discuss findings. They often spend time troubleshooting data issues and refining processes.
Data analysts work across various industries, including finance, healthcare, marketing, and technology. Anywhere there’s data, analysts are needed to make sense of it.
Yes, coding is often required. Knowledge of SQL is essential for querying databases, while Python or R can be used for more advanced data analysis.
A data analyst focuses on interpreting existing data and providing actionable insights. A data scientist digs deeper, using advanced techniques to predict future trends and behaviors.
Data analysts present their findings through reports, dashboards, and visualizations. They use tools like Tableau or Power BI to make data easy to understand.
While data analysts often work independently on specific tasks, they also collaborate with teams, including business leaders, IT, and marketing, to ensure their insights align with company goals.
Common challenges include dealing with messy or incomplete data, finding the right questions to ask, and ensuring their insights are understood and acted upon by decision-makers.
Yes, the role is evolving as data becomes more integral to decision-making. Analysts are expected to continuously learn new tools and methods to keep up with the growing demands.
A data analyst’s role is like being the detective of the data world. You’re the one piecing together the puzzle, finding the story in the numbers, and making sense of the chaos. It’s a job that demands sharp thinking, curiosity, and a knack for problem-solving.
The role isn’t one-dimensional. You’ve got to wear many hats – sometimes you’re a statistician, other times a storyteller. Each day brings a new challenge, and with it, a chance to learn something fresh. So, keep those skills sharp and stay curious. The field of data analysis is always changing, and you’ve got to change with it.
As you move forward, embrace the opportunities that data analysis offers. Whether you’re crunching numbers for a small business or driving insights for a big company, your work has an impact. The world runs on data, and you’re in the driver’s seat. Keep pushing boundaries, ask the tough questions, and never stop exploring the possibilities.
The future is bright for those who can turn data into insights. It’s a path full of discovery, and you’re the one holding the map. So, go ahead – dig into those numbers and see where they lead you.
How much did you enjoy this article?


Calculate accounts receivable turnover ratio to measure credit collection speed, improve cash flow, and strengthen your financial strategy. Read on!

Change Management KPIs are the key to tracking adoption, performance, and ROI during transitions. Find out which metrics matter. Read on!

Data collection methods and techniques determine the quality of every insight you act on. Explore key approaches for gathering reliable data. Read on!


