• Home
  • Tools dropdown img
    • Spreadsheet Charts

      • ChartExpo for Google Sheets
      • ChartExpo for Microsoft Excel
    • Power BI Charts

      • Power BI Custom Visuals by ChartExpo
    • Word Cloud

  • Charts dropdown img
    • Chart Category

      • Bar Charts
      • Circle Graphs
      • Column Charts
      • Combo Charts
      • Comparison Charts
      • Line Graphs
      • PPC Charts
      • Sentiment Analysis Charts
      • Survey Charts
    • Chart Type

      • Box and Whisker Plot
      • Clustered Bar Chart
      • Clustered Column Chart
      • Comparison Bar Chart
      • Control Chart
      • CSAT Survey Bar Chart
      • CSAT Survey Chart
      • Dot Plot Chart
      • Double Bar Graph
      • Funnel Chart
      • Gauge Chart
      • Likert Scale Chart
      • Matrix Chart
      • Multi Axis Line Chart
      • Overlapping Bar Chart
      • Pareto Chart
      • Radar Chart
      • Radial Bar Chart
      • Sankey Diagram
      • Scatter Plot Chart
      • Slope Chart
      • Sunburst Chart
      • Tornado Chart
      • Waterfall Chart
      • Word Cloud
    • Google Sheets
      Microsoft Excel
  • Services
  • Pricing
  • Contact us
  • Blog
  • Support dropdown img
      • Gallery
      • Videos
      • Contact us
      • FAQs
      • Resources
    • Please feel free to contact us

      atsupport@chartexpo.com

Categories
All Data Visualizations Data Analytics Surveys
Add-ons/
  • Google Sheets
  • Microsoft Excel
  • Power BI
All Data Visualizations Data Analytics Surveys
Add-ons
  • Google Sheets
  • Microsoft Excel
  • Power BI

We use cookies

This website uses cookies to provide better user experience and user's session management.
By continuing visiting this website you consent the use of these cookies.

Ok

ChartExpo Survey


Home > Blog > Data Analytics

Project Status Reports Template: Elevate Reporting Game

Project status report templates may not be the most glamorous part of a project, but they are undeniably crucial.

Why?

First, project status reports are the ultimate truth serum in project management. They provide an unfiltered snapshot of the project’s progress, exposing both triumphs and tribulations. No fluff, no sugar-coating, just raw data.

Project Status Reports Template

Secondly, these reports serve as a lifeline for stakeholders, offering a glimpse into the project’s current state. Think of them as a GPS guiding everyone toward the project’s destination. Without them, disorder and confusion would prevail.

Furthermore, project status report templates are invaluable for accountability and transparency. They hold team members accountable for their tasks and keep them on their toes. It’s like having a watchful eye over their shoulders, ensuring they’re not slacking off. Or playing Sudoku in the breakroom.

With these reports, everyone knows what’s happening, who’s responsible, and when things are due.

But this is just the tip of the iceberg. Continue reading for a deep understanding of the importance of these project templates. You’ll also learn how to create project status report templates and analyze them.

Table of Content:

  1. What is a Project Status Report?
  2. Why are Project Status Reports Important?
  3. Types of Project Status Reports
  4. Key Elements of a Status Report
  5. Project Status Report Template Examples
    1. Daily Project Status Report Template:
    2. Weekly Project Status Report Template:
    3. Monthly Project Status Report Template:
  6. 7 Steps To Writing An Effective Project Status Report
  7. How to Represent a Project Status Report Template: Step-By-Step
    1. Step 1: Collect And Arrange Your Data
    2. Step 2: Install ChartExpo
    3. Step 3: Add New Chart 
    4. Step 4: Create a Progress Circle Chart 
    5. Step 5: Customize Your Chart 
    6. Step 6: Add Title in Chart And Save Changes
    7. Step 7: Final Project Status Template
  8. How to Download a Project Status Report Template?
  9. How to Use a Project Status Report Template?
  10. Benefits of Project Reporting Templates
  11. 7 Tips For Making a Good Project Status Report Template
  12. Make Your Decisions Better With Project Status Reporting Template
  13. Project Status Report: Frequently Asked Questions
  14. Wrap Up

First”¦

What is a Project Status Report?

Definition: A project status report is a dynamic tool in project management, encapsulating key project details. It highlights progress, challenges, and future steps.

This template transforms raw data into a comprehensive visual narrative, providing stakeholders with a clear overview. From timelines to budget summaries, it streamlines project communication, ensuring everyone is on the same page.

Why are Project Status Reports Important?

Project status reports are pivotal in maintaining order and clarity in the chaotic world of project management. Here are some reasons why it is a handy project management tool.

  • Consistency

Project status reports instill consistency in reporting methods. The predefined structure maintains uniformity in presenting project updates, facilitating easier tracking and understanding.

  • Efficiency

Efficiency is a hallmark of project status reports. They eliminate the need for reinventing the reporting wheel for each project. These reports have a pre-defined project status report format. Thus, they streamline the reporting process, saving time and effort.

  • Clarity

The visual clarity offered by the project status report is invaluable. These reports translate complex project data into easily understandable visualizations.

As a result, they provide a clear snapshot of project progress, key milestones, and potential roadblocks. This clarity ensures all stakeholders, regardless of their familiarity with project intricacies, can grasp the project’s current status.

  • Communication

Effective communication is a cornerstone of successful project management, and project status reports serve as communication enablers. They provide a concise, structured format for project updates to stakeholders and team members. This clear communication ensures everyone is on the same page, fostering collaboration and preventing misunderstandings.

  • Accountability

Project status outlines key metrics and responsibilities. Thus, they create a framework for holding team members accountable for their contributions to the project. This accountability is vital for maintaining a proactive, responsible team committed to achieving project milestones.

  • Decision–Making

These reports present critical information, such as project risks, challenges, and achievements, in a digestible format. This provides the insights needed for informed decision-making, efficient resource allocation, and addressing potential issues before they escalate.

  • Transparency

The project status report offers a comprehensive view of project dynamics, fostering stakeholder transparency. Stakeholders can track project progress, understand the decision-making process, and identify deviations from the original plan. This openness is key to maintaining solid relationships between project teams and stakeholders.

  • Documentation

Consistent recording of project updates, decisions, and milestones creates a documented trail of the project’s evolution. This documentation is not only useful for retrospective analysis but also provides a foundation for;

    • Learning from past experiences.
    • Refining project management strategies.
    • Ensuring continuous improvement in future projects.

Types of Project Status Reports

  1. Summary Status Reports: Offer a concise overview of project progress, focusing on key achievements, milestones, and major issues.
  2. Detailed Status Reports: Provide in-depth insights into project activities, including task updates, work completed, and upcoming activities.
  3. Dashboard Reports: Present project metrics and KPIs in a visual format, allowing stakeholders to quickly grasp project performance at a glance.
  4. Weekly/Monthly Reports: Offer regular updates on project progress, typically on a weekly or monthly basis, to keep stakeholders informed and engaged.
  5. Executive Reports: Tailored for senior management, these reports provide strategic insights, financial performance, and overall project health, enabling informed decision-making at the executive level.

Key Elements of a Status Report

  1. Progress Update: Description of progress made since the last report, including milestones achieved, tasks completed, and any challenges encountered.
  2. Issues and Risks: Identification and description of any issues or risks that may impact the project’s success, along with proposed solutions or mitigation strategies.
  3. Next Steps: Outline of planned activities and milestones for the next reporting period.
  4. Key Metrics: Presentation of key performance indicators (KPIs) or metrics relevant to the project’s success, with comparisons to targets or benchmarks.
  5. Recommendations: Suggestions or recommendations for actions to address challenges, capitalize on opportunities, or improve project performance.

Project Status Report Template Examples: Daily, Weekly, and Monthly

Daily Project Status Report Template:

Project Name: Date:

Summary of Work Completed Today:

  • Description of tasks completed
  • Any milestones achieved

Challenges Faced:

  • Description of any obstacles encountered
  • Actions taken to address them

Plan for Tomorrow:

  • Tasks planned for the next day
  • Goals to accomplish

Remarks/Notes:

  • Any additional comments or observations

Weekly Project Status Report Template:

Project Name: Reporting Period: [Start Date] to [End Date]

Overall Progress:

  • Summary of progress made during the week
  • Percentage completion of key tasks/milestones

Key Accomplishments:

  • Major achievements during the week
  • Milestones reached

Issues and Risks:

  • Description of any issues or risks encountered
  • Mitigation strategies

Upcoming Tasks:

  • Tasks planned for the next week
  • Goals to achieve

Remarks/Notes:

  • Any additional comments or observations

Monthly Project Status Report Template:

Project Name: Reporting Period: [Month, Year]

Executive Summary:

  • Overview of project progress
  • Key highlights

Progress Summary:

  • Percentage completion of overall project
  • Summary of achievements

Challenges and Mitigation:

  • Description of challenges faced
  • Actions taken to mitigate risks

Financial Status:

  • Budget vs. Actuals
  • Expenses incurred

Upcoming Milestones:

  • Milestones planned for the next month
  • Timeline for completion

7 Steps To Writing An Effective Project Status Report

Creating impactful project status reports requires a strategic balance of clear communication, data visualization, and goal alignment:

  1. Define objectives and audience: Clearly define the objectives and identify the target audience. Understanding the purpose and audience ensures the report aligns with specific goals and meets stakeholder expectations.
  2. Select a template: Choose a project status report template that suits the project’s nature and complexity. Templates provide a structured format, streamlining the reporting process and ensuring consistency across updates.
  3. Collect data: Gather relevant data to populate the report. This includes progress updates, milestones achieved, challenges faced, and any deviations from the project plan. Moreover, ensure the data is accurate and complete to present a comprehensive view of the project’s status.
  4. Be consistent: Maintain consistency in reporting formats and language throughout the project status reports. Consistency makes it easier for stakeholders to track trends over time and understand the information presented. In simple terms – it fosters clarity and understanding.
  5. Prioritize key metrics: Identify and prioritize key metrics that align with project objectives. Focus on highlighting critical information, such as project timelines, budget status, and potential risks. This ensures stakeholders can quickly grasp the most crucial aspects of the project’s status.
  6. Provide context: Offer context for data presentation by providing explanations, insights, and narratives. Contextual information helps stakeholders understand the reasons behind project outcomes. It facilitates a deeper comprehension of the project’s overall health and trajectory.
  7. Visualize data: Use visualizations to enhance the impact of the data. Charts, graphs, and visual representations can make complex information more accessible and engaging. They provide a quick overview and aid in conveying trends, patterns, and relationships within the project data.

How to Represent a Project Status Report Template: Step-By-Step

Data visualization is the superhero of data analysis, making complex information simple. However, while great for spreadsheets, Google Sheets falls short in the data visualization department.

This is where ChartExpo comes into play as the knight in shining armor.

ChartExpo transforms project status reports into visually appealing, insightful charts, including Chord diagrams. It helps you extract key insights from your project status reports in just a few clicks.

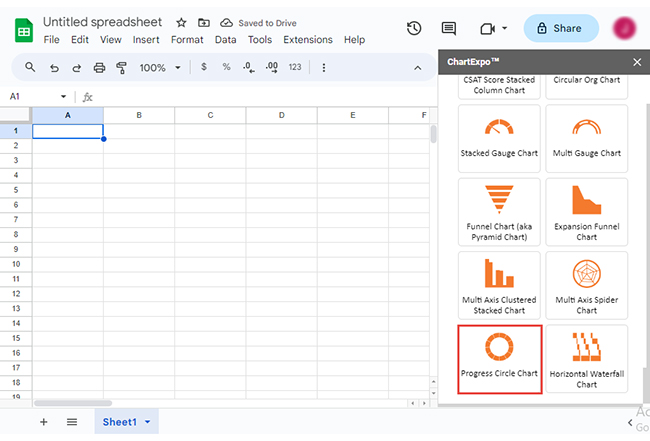
How to Install ChartExpo in Google Sheets?

  1. To start using ChartExpo, download it directly from the Google Sheets program. To do this, select Extensions from the top toolbar.
  2. A menu will appear. Click the Get add-ons option.
  3. Search for ChartExpo, and click on Charts, Graphs & Visualizations by ChartExpo when it appears in the results.
  4. Click the Install button. You will have to confirm your Google account and accept some permissions.

ChartExpo charts are available both in Google Sheets and Microsoft Excel. Please use the following CTA’s to install the tool of your choice and create beautiful visualizations in a few clicks in your favorite tool.
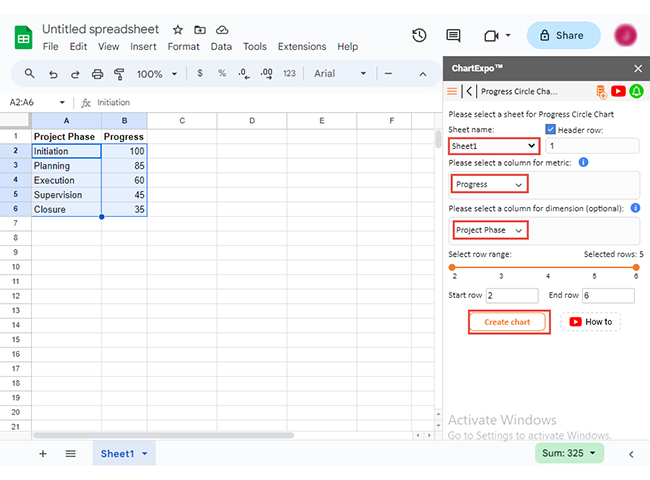
Step 1: Collect And Arrange Your Data

Project Phase Progress
Initiation 100
Planning 85
Execution 60
Supervision 45
Closure 35

Follow the steps below to create a chart for this data using ChartExpo. Then, glean insights to help you evaluate the project’s progress.

Step 2: Install ChartExpo

open chartexpo in google sheets

Step 3: Add New Chart

add new chart in google sheets

Step 4: Create a Progress Circle Chart

search Progress Circle chart in google sheets

Step 5: Customize Your Chart

  • Put the data table in the sheet first. Then, choose the Sheet name from the drop-down in the ChartExpo section.
  • Select the metric column; metric is the numeric column in your data sheet (in this example, it is the Project).
  • Select the dimensions column; the dimension is the categorical column in your datasheet that contains text information (in this case, it is the Project Phase).
  • Click the Create chart button to complete the process.
Create Chart From Selection ce475
  • Your tabular data will turn into a Progress Circle Chart, as shown below.
  • Click the Edit chart button to make custom changes.
Project Status Reports Template Design

Step 6: Add Title in Chart And Save Changes

  • To change the title of the chart, click the pencil icon next to the Chart Header.
  • It will open the properties dialog. Under the Text section, you can add a heading in Line 1 and enable the Show option. Give the appropriate title of your chart and click the Apply button.
Apply Tittle on Chart ce475
  • Change all the legend shapes into circles and click the “Save” button:
Save Progress Circle Chart ce475

Step 7: Final Project Status Template Below

Final Project Status Reports Template

Insights

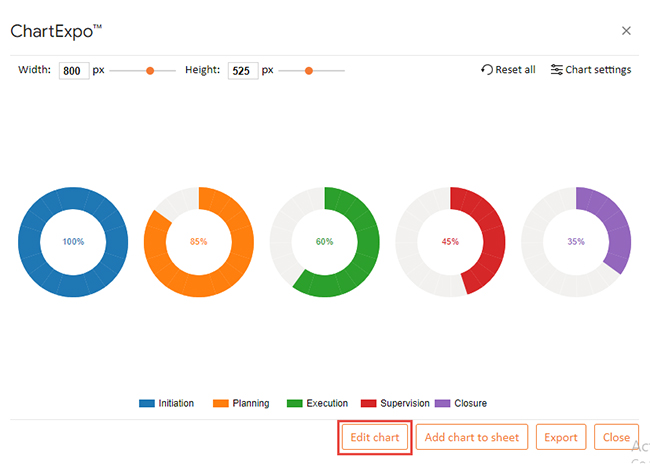
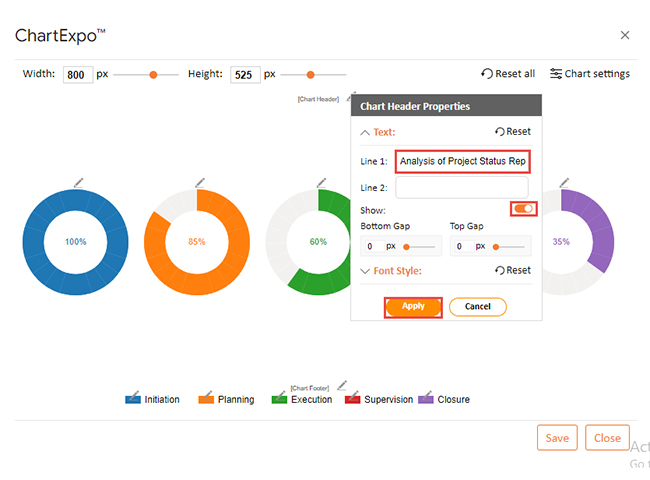
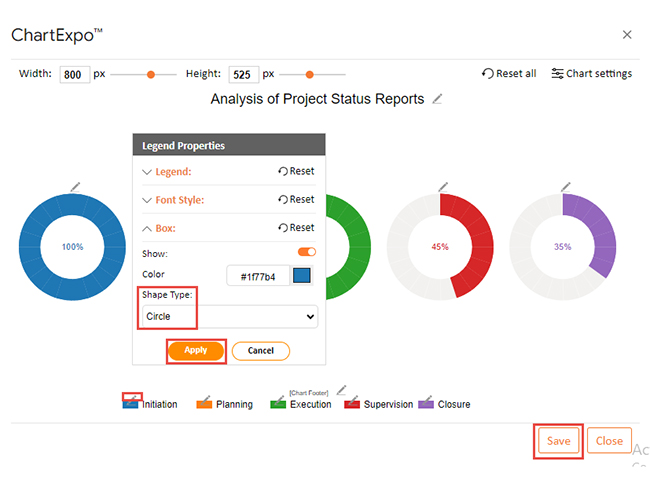
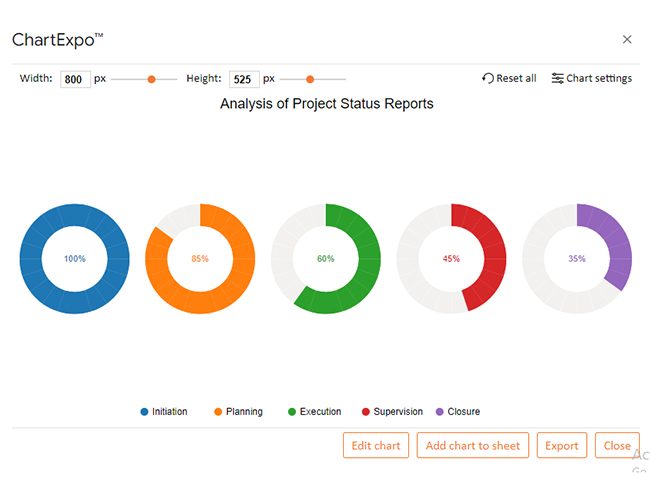
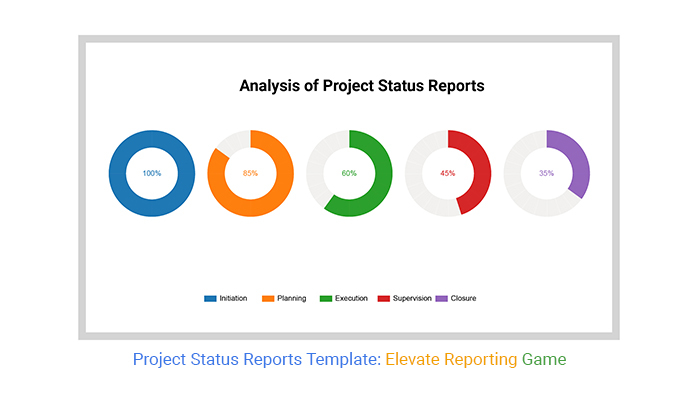
The visual project status report showcases phase completion through gauges:

  • Initiation: Fully Complete (100%)
  • Planning: 85% Completed
  • Execution: 60% Completed
  • Supervision: 45% Completed
  • Closure: 35% Completed

Create Your Project Status Report Template.

How to Download a Project Status Report Template?

Search Online

Look for “Project Status Report Template” on popular template platforms like Microsoft Office, Google Sheets, or websites like ChartExpo.com or PPCexpo.com.

Choose a Format

Select a format that works for you Excel, Word, Google Docs, or PDF based on your project needs and team preferences.

Download the Template

Click the download button on the website to get the template in your chosen format. Make sure to save it to an easily accessible folder.

Customize the Template

After downloading, customize the template by adding your project’s specific details, metrics, and goals.

How to Use a Project Status Report Template?

  1. Select Template: Choose the appropriate template for your reporting frequency (daily, weekly, or monthly).
  2. Fill in Details: Input project name, reporting period, and date.
  3. Update Progress: Summarize completed tasks and milestones achieved.
  4. Note Challenges: Describe any obstacles faced and steps taken to address them.
  5. Plan Ahead: Outline upcoming tasks and goals for the next reporting period.
  6. Review Finances: Include budget vs. actual expenses if relevant.
  7. Executive Summary: Add a brief overview for higher-level stakeholders (monthly reports).
  8. Additional Notes: Include any relevant observations or remarks.
  9. Review and Revise: Check for accuracy and make necessary revisions.
  10. Distribute and Discuss: Share with team and stakeholders for discussion and feedback.

Benefits of Project Reporting Templates

Consistency

Project reporting templates ensure a standardized format for all reports, making it easier to compare and track progress across different projects. This consistency improves clarity and helps maintain professional reporting standards.

Time-Saving

Using templates saves time by eliminating the need to create a new report from scratch for every project update. The structured format speeds up the reporting process, allowing teams to focus more on project execution.

Improved Communication

Templates provide a clear and organized way to present information, ensuring that team members and stakeholders can easily understand project updates. This enhances overall communication and helps prevent misunderstandings.

Better Decision-Making

By offering a comprehensive view of the project’s progress, budget, risks, and resources, project reporting templates empower managers to make data-driven and informed decisions that guide the project toward success.

Transparency

Reporting templates provide transparency into project performance by clearly highlighting milestones, challenges, and key metrics. This fosters accountability among team members and helps stakeholders stay informed about the project’s health.

7 Tips For Making a Good Project Status Report Template

1. Define Key Metrics

Include essential metrics like progress, budget, timeline, and risks to ensure stakeholders get a clear view of the project’s health.

2. Keep It Simple

Use a clean and straightforward layout. Avoid overwhelming the report with too much detail stick to critical information.

3. Use Visuals

Incorporate charts, graphs, or tables to represent data visually, making it easier to understand complex information quickly.

4. Include Clear Milestones

Clearly outline the key milestones achieved and upcoming to track progress and ensure alignment with the project timeline.

5. Ensure Flexibility

Design the template to be adaptable to different projects and industries, allowing customization without losing the core structure.

6. Regular Updates Section

Include a section for regular updates on progress, roadblocks, and changes, ensuring the report reflects the latest project status.

7. Highlight Risks and Issues

Include a dedicated area for highlighting potential risks, issues, or challenges, helping stakeholders anticipate and address problems early.

Make Your Decisions Better With Project Status Reporting Template

  1. Review Regularly: Regularly review the project status report to stay updated on project progress, challenges, and milestones.
  2. Analyze Trends: Look for trends and patterns in the data presented in the report, such as recurring issues or areas of improvement.
  3. Identify Risks: Pay attention to any risks or issues highlighted in the report and assess their potential impact on project timelines and objectives.
  4. Evaluate Performance: Use the report to evaluate team performance, track progress against goals, and identify areas where additional support may be needed.
  5. Make Informed Decisions: Use the insights gained from the project status report to make informed decisions about resource allocation, task prioritization, and project strategies.

Project Status Report: Frequently Asked Questions

How do you indicate project status?

Use visual indicators like gauges and progress bars for quick comprehension. Incorporate color-coded charts and label stages for easy tracking and understanding. Also, provide percentage completion for each project phase.

What makes a good project status report?

A good project status report is clear, concise, and visually engaging. It focuses on key metrics, highlights achievements, and communicates challenges transparently. Consequently, it facilitates informed decision-making and stakeholder understanding.

What is the difference between a progress report and a status report?

A progress report details work done, while a status report provides a broader project overview. Moreover, a status report encompasses achievements, challenges, and plans. Both communicate updates but cater to different levels of detail and audience needs.

Wrap Up

Project status report templates play a pivotal role in the communication infrastructure of a project. They are a beacon of clarity, ensuring all stakeholders understand the project’s trajectory. The structured approach to reporting offers a predefined format that simplifies complex information for a diverse audience.

Their efficiency is a significant asset, saving time and resources by streamlining the reporting process. Prioritizing key metrics helps keep the focus on critical aspects of the project, enabling more effective decision-making. Moreover, the context they provide enhances understanding, rendering the data more actionable.

Furthermore, these templates play a crucial role in fostering accountability within the project team. Their standardized reporting structure creates a sense of ownership among team members, contributing to a culture of responsibility.

Combining these templates and ChartExpo enhances efficiency and turns project updates into engaging informative experiences. As a result, it ensures trust among stakeholders, fostering a sense of credibility.

In essence, the project status reports template and ChartExpo redefine project communication. They transform mundane data into visual narratives, ensuring stakeholders effortlessly grasp project dynamics. Embrace them today to shape your project’s narrative and propel it towards success.

How much did you enjoy this article?

ExcelAd1
Start Free Trial!
131354

Related articles

next previous
Data Analytics7 min read

Financial Forecasting for Startups: A Complete Guide

This guide dives deep into financial forecasting for startups. You'll also discover elements of a financial projection for a startup, and tips for creating one.

Data Analytics32 min read

Data Reporting: Making Your Reports Irresistible

Data reporting turns numbers into insights that guide decisions. Learn how to simplify complex data and make confident choices. Read on for key strategies!

Data Analytics10 min read

Employee Performance KPIs: Insights That Drive Action

Employee performance KPIs track productivity and success. Learn the key metrics, measurement methods, and analysis techniques to boost performance.

Data Analytics27 min read

Prescriptive Analytics: From Forecasts to Fixes

Prescriptive analytics helps you turn data into action. Learn how it improves decision-making, drives results, and supports smarter strategies. Get started!

Data Analytics32 min read

Predictive Analytics: See What's Coming Before It Happens

Predictive analytics helps businesses cut costs, reduce risks, and act fast when it matters most. Want results that stick? Predictive analytics works—read on!

ChartExpo logo

Turn Data into Visual
Stories

CHARTEXPO

  • Home
  • Gallery
  • Videos
  • Services
  • Pricing
  • Contact us
  • FAQs
  • Privacy policy
  • Terms of Service
  • Sitemap

TOOLS

  • ChartExpo for Google Sheets
  • ChartExpo for Microsoft Excel
  • Power BI Custom Visuals by ChartExpo
  • Word Cloud

CATEGORIES

  • Bar Charts
  • Circle Graphs
  • Column Charts
  • Combo Charts
  • Comparison Charts
  • Line Graphs
  • PPC Charts
  • Sentiment Analysis Charts
  • Survey Charts

TOP CHARTS

  • Sankey Diagram
  • Likert Scale Chart
  • Comparison Bar Chart
  • Pareto Chart
  • Funnel Chart
  • Gauge Chart
  • Radar Chart
  • Radial Bar Chart
  • Sunburst Chart
  • see more
  • Scatter Plot Chart
  • CSAT Survey Bar Chart
  • CSAT Survey Chart
  • Dot Plot Chart
  • Double Bar Graph
  • Matrix Chart
  • Multi Axis Line Chart
  • Overlapping Bar Chart
  • Control Chart
  • Slope Chart
  • Clustered Bar Chart
  • Clustered Column Chart
  • Box and Whisker Plot
  • Tornado Chart
  • Waterfall Chart
  • Word Cloud
  • see less

RESOURCES

  • Blog
  • Resources
  • YouTube
SIGN UP FOR UPDATES

We wouldn't dream of spamming you or selling your info.

© 2025 ChartExpo, all rights reserved.