• Home
  • Tools dropdown img
    • Spreadsheet Charts

      • ChartExpo for Google Sheets
      • ChartExpo for Microsoft Excel
    • Power BI Charts

      • Power BI Custom Visuals by ChartExpo
    • Word Cloud

  • Charts dropdown img
    • Chart Category

      • Bar Charts
      • Circle Graphs
      • Column Charts
      • Combo Charts
      • Comparison Charts
      • Line Graphs
      • PPC Charts
      • Sentiment Analysis Charts
      • Survey Charts
    • Chart Type

      • Box and Whisker Plot
      • Clustered Bar Chart
      • Clustered Column Chart
      • Comparison Bar Chart
      • Control Chart
      • CSAT Survey Bar Chart
      • CSAT Survey Chart
      • Dot Plot Chart
      • Double Bar Graph
      • Funnel Chart
      • Gauge Chart
      • Likert Scale Chart
      • Matrix Chart
      • Multi Axis Line Chart
      • Overlapping Bar Chart
      • Pareto Chart
      • Radar Chart
      • Radial Bar Chart
      • Sankey Diagram
      • Scatter Plot Chart
      • Slope Chart
      • Sunburst Chart
      • Tornado Chart
      • Waterfall Chart
      • Word Cloud
    • Google Sheets
      Microsoft Excel
  • Services
  • Pricing
  • Contact us
  • Blog
  • Support dropdown img
      • Gallery
      • Videos
      • Contact us
      • FAQs
      • Resources
    • Please feel free to contact us

      atsupport@chartexpo.com

Categories
All Data Visualizations Data Analytics Surveys
Add-ons/
  • Google Sheets
  • Microsoft Excel
  • Power BI
All Data Visualizations Data Analytics Surveys
Add-ons
  • Google Sheets
  • Microsoft Excel
  • Power BI

We use cookies

This website uses cookies to provide better user experience and user's session management.
By continuing visiting this website you consent the use of these cookies.

Ok

ChartExpo Survey


Home > Blog > Microsoft Excel

How to Create & Use Task Tracking Spreadsheet Template?

Are you struggling to keep track of your tasks and deadlines? Do you find yourself overwhelmed by the sheer volume of things you need to get done? Fear not, because creating a task-tracking spreadsheet can be your game-changer.

Creating a task-tracking spreadsheet will help you stay organized and on top of your responsibilities. The result? You’ll increase productivity and efficiency.

Task Tracking Spreadsheet

The concept of task tracking dates back to early paper-based to-do lists. In today’s digital age, the evolution of task tracking has seen remarkable strides. Spreadsheet software like Microsoft Excel and Google Sheets has made task tracking more customizable and efficient.

In this guide, we’ll learn how to create a task-tracking spreadsheet that aligns with your unique needs. Whether you’re a professional managing project or a student organizing assignments, this guide is tailored to empower you. From spreadsheet structuring to incorporating advanced features, you’ll gain the expertise to create a powerful task management tool.

By the end, you’ll be equipped with the knowledge and skills to revolutionize your approach to task management.

So, let’s dive in and transform how you manage your workload.

Table of Content:

  1. What is a Task Tracking Spreadsheet?
  2. Why Do You Need a Task Tracker Template?
  3. What Does the Task Tracking Template Include?
  4. Task Tracking Spreadsheet Examples
  5. How to Create a Task Tracking Spreadsheet?
  6. How To Customize Your Task List in Template?
  7. How to Visualize Tasks in a Spreadsheet?
  8. How to use a Task Tracker in Excel?
  9. Benefits of using an Excel-based Task Tracker
  10. How to Download Your Task Tracking Spreadsheet?
  11. FAQs About Task Tracking Spreadsheet Template
  12. Wrap Up

But first”¦

What is a Task Tracking Spreadsheet?

Definition: A task-tracking spreadsheet is a digital document or file, typically created using spreadsheet software like Microsoft Excel. This versatile tool is used to monitor and manage various tasks efficiently.

A task-tracking sheet typically consists of rows and columns. Each row represents a specific task, and each column contains information such as task description and assigned personnel. You can input and update data easily, allowing real-time visibility into project progress. Additionally, it serves as a centralized document for team members to collaborate, ensuring everyone stays informed about task developments.

The spreadsheet’s structure makes organizing, updating, and prioritizing tasks easy. You can also apply conditional formatting to highlight overdue or critical tasks. Some sheets include features like checkboxes for task completion and formulas for automatic status calculations.

Why Do You Need a Task Tracker Template?

A task tracker template helps organize and manage tasks efficiently, ensuring nothing falls through the cracks. It provides a clear structure for tracking deadlines, priorities, and progress, which enhances productivity.

Using a template allows you to monitor workload distribution, stay on top of team performance, and quickly identify any potential bottlenecks.

Additionally, it promotes accountability by assigning tasks and making it easy to review completed work. A task tracker also helps streamline project management by offering a consistent approach to organizing tasks.

What Does the Task Tracking Template Include?

  1. Task Name: A list of tasks organized by project or category.
  2. Priority Level: Urgency level, such as high, medium, or low.
  3. Assigned Team Member: Indicates who is responsible for the task.
  4. Due Date: The deadline for completing each task.
  5. Status: The current progress (e.g., “In Progress,” “Completed”).
  6. Notes/Comments: Additional details or instructions for each task.
  7. Completion Percentage: A measure of how much of the task is completed (optional).

Task Tracking Spreadsheet Examples

1. Basic Task Tracker

  • Columns: Task Name, Priority, Due Date, Status, Assigned To
  • Description: A simple layout ideal for small projects, focusing on essential task details.

2. Project Task Tracker

  • Columns: Task Name, Project Name, Start Date, End Date, Status, Assigned To, Notes
  • Description: Suitable for managing tasks across multiple projects with additional columns for project-specific details.

3. Team Task Tracker

  • Columns: Task Name, Team Member, Priority, Due Date, Status, % Complete, Comments
  • Description: Designed for team collaboration, including details on task progress and team member assignments.

4. Kanban Task Tracker

  • Columns: Task Name, To-Do, In Progress, Completed, Assigned To, Due Date
  • Description: Uses a Kanban board approach to visualize tasks moving through different stages of completion.

5. Weekly Task Tracker

  • Columns: Task Name, Week, Priority, Status, Deadline, Notes
  • Description: Focuses on weekly task management, helping track and organize tasks every week for better time management.

How to Create a Task Tracking Spreadsheet?

Embarking on a project without a clear roadmap can lead to chaos. That’s where the power of a well-structured task-tracking spreadsheet comes into play. Here is a comprehensive guide on how to create one to ensure your project stays on course.

  1. Open Excel: Launch Excel on your computer to initiate the creation of your task-tracking spreadsheet. The principles remain the same if you use Google Sheets or another spreadsheet software.
  2. Create headers: Establish the foundation by creating headers for essential categories such as “Task Name”, “Assigned To”, and “Due Date”. Add any relevant information specific to your project.
  3. Enter tasks: Begin inputting your tasks into the spreadsheet, allocating each to a separate row. This establishes the groundwork for a detailed overview of your project.
  4. Format the spreadsheet: Enhance readability by formatting the spreadsheet. Adjust cell sizes, font styles, and colors to make information easily digestible and visually appealing.
  5. Set up dates: Allocate due dates for each task. Excel’s date formatting capabilities allow you to represent deadlines clearly and track them efficiently.
  6. Add Status column: Include a “Status” column to keep track of each task’s progress. Utilize labels such as “Not Started,” “In Progress,” and “Completed” for a quick visual update.
  7. Assign tasks: Specify responsible individuals for each task in the “Assigned To” column. This ensures accountability and a clear understanding of who is responsible for what.
  8. Add formulas (optional): For more advanced tracking, consider incorporating formulas. Formulas can automatically calculate task durations, completion percentages, or any other metrics relevant to your project.
  9. Conditional formatting optional): Apply conditional formatting to enhance visibility. This feature allows you to highlight cells based on specific criteria. As a result, it makes it easier to identify overdue tasks or those nearing completion.
  10. Create filters: Enable filters to streamline data analysis. Filters help you sort and view specific task categories, individuals, or statuses. Thus, it offers a dynamic perspective on your project’s progress.
  11. Review and adjust: Regularly review your task-tracking spreadsheet. Adjust dates, statuses, or assignments as needed. This ongoing review ensures your plan remains aligned with the project’s evolving dynamics.
  12. Save the spreadsheet: Regularly save your work to prevent data loss. Establish a consistent naming convention and file location for easy retrieval.
  13. Share or collaborate (optional): If working in a team, consider sharing the spreadsheet through collaborative platforms like Google Sheets or cloud storage services. This promotes real-time updates and seamless collaboration.
  14. Regularly update: Maintain the accuracy of your task-tracking spreadsheet by updating it regularly. Also, encourage team members to input their progress and communicate any changes promptly.

How To Customize Your Task List in Template?

1. Add or Remove Columns

You can modify the template by adding extra columns for details like “Estimated Time” or removing fields that are not needed.

2. Use Conditional Formatting

Apply conditional formatting to visually highlight urgent tasks or overdue items using color coding for better clarity.

3. Personalize Priority Levels

Adjust the priority levels to fit your workflow, such as adding custom labels like “Critical” or “Low” urgency.

4. Modify Layout

Rearrange columns, adjust row height, or add sections to customize the template layout according to your needs.

5. Incorporate Formulas

Include Excel formulas to automate tracking, such as calculating task completion percentages or setting due date reminders.

6. Include Custom Filters

Set up filters to quickly sort tasks by assigned team member, status, or deadline for easier navigation.

How to Visualize Tasks in a Spreadsheet?

Analyzing tasks in a spreadsheet can be daunting, often involving complex data that is challenging to interpret. Here, data visualization emerges as a crucial tool, aiding in comprehending and representing task-related insights.

While Excel is a popular platform for spreadsheet management, it has limited visualization capabilities. Its limitations can impede a comprehensive understanding of task-related data.

This is where ChartExpo comes into play.

ChartExpo offers advanced visualization capabilities to enhance the visualization of tasks within a spreadsheet.

Let’s learn how to Install ChartExpo in Excel.

  1. Open your Excel application.
  2. Open the worksheet and click the “Insert” menu.
  3. You’ll see the “My Apps” option.
  4. In the office Add-ins window, click “Store” and search for ChartExpo on my Apps Store.
  5. Click the “Add” button to install ChartExpo in your Excel.

ChartExpo charts are available both in Google Sheets and Microsoft Excel. Please use the following CTA’s to install the tool of your choice and create beautiful visualizations in a few clicks in your favorite tool.

Sample Data

Below is sample data from a task tracker template.

Task Resource Name Hours Spent
Exercise Allen 97
Exercise Smith 88
Exercise Jeorge 79
Exercise Shaun 95
Exercise Pollak 82
Reading Books Allen 62
Reading Books Smith 63
Reading Books Jeorge 74
Reading Books Shaun 54
Reading Books Pollak 74
Gardening Allen 60
Gardening Smith 62
Gardening Jeorge 51
Gardening Shaun 86
Gardening Pollak 71
Socializing Allen 50
Socializing Smith 77
Socializing Jeorge 82
Socializing Shaun 55
Socializing Pollak 56

Let’s visualize this task-tracking data with ChartExpo and glean valuable insights.

  • To use ChartExpo, first install it in Excel.
  • Access My Apps under the INSERT menu.
insert chartexpo in excel
  • Choose ChartExpo and click the “Insert” button.
open chartexpo in excel
  • After ChartExpo loads, choose the “Comparison Bar Chart” from the chart list.
search comparison bar chart in excel
  • Select the data from the sheet, and click the “Create Chart From Selection” button.
Create Chart From Selection ce510
  • ChartExpo will create the visualization below for you.
Task Tracking Spreadsheet Design Template
  • If you want to add a chart title, click the “Edit Chart” button.
  • To modify the title, click the pencil icon next to “Chart Header”. Add the appropriate heading in Line 1 under the Text section. Enable the Show option and click the “Apply” button.
Apply Tittle on Chart ce510
  • Click the “Save Changes” button to ensure the changes are permanent.
Save All Changes ce510
  • Your final chart will then resemble the image below.
Final Task Tracking Spreadsheet

Insights

  • Exercise (97) and Reading Books (62) consumed most of Allen’s time, reflecting diverse interests.
  • Shaun allocated substantial hours to Gardening (86), revealing a preference for outdoor pursuits.
  • Jeorge evenly distributed hours across various activities, displaying consistency in engagement.
  • Smith and Pollak exhibited differing levels of involvement in various tasks, indicating varied interests.

Analyze Task Completion with a Spreadsheet and Precise Bar Chart Comparisons:

  1. Open your Excel Application.
  2. Install ChartExpo Add-in for Excel from Microsoft AppSource to create interactive visualizations.
  3. Select the Comparison Bar Chart from the list of charts.
  4. Select your data.
  5. Click on the “Create Chart from Selection” button.
  6. Customize your chart properties to add header, axis, legends, and other required information.
  7. Export your chart and share it with your audience.

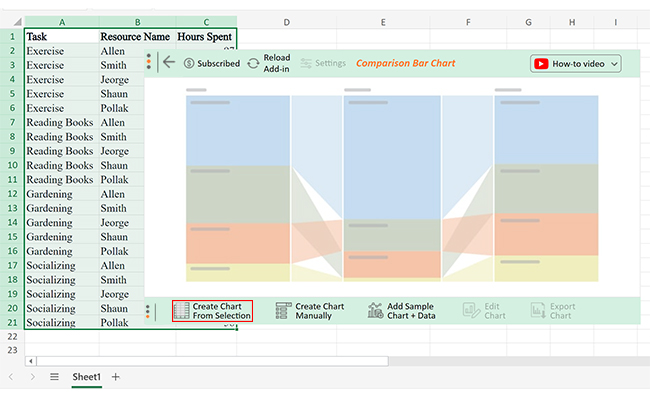
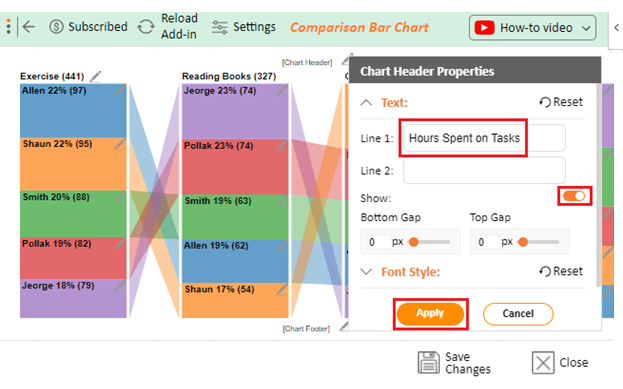
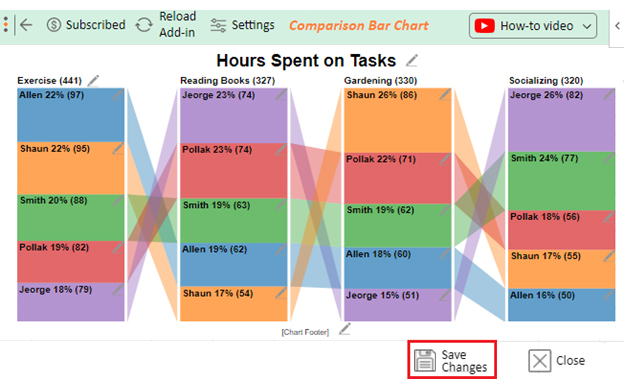
The following video will help you to create a Comparison Bar Chart in Microsoft Excel.

How to Use a Task Tracker in Excel?

1. Create a Task List

In the first column, enter all the tasks you need to track. If necessary, categorize them by project or department.

2. Add Columns for Task Details

Include columns for essential information like priority, status, due date, assigned team member, and any notes related to the task.

3. Apply Conditional Formatting

Use Excel’s conditional formatting to automatically color-code tasks based on priority (e.g., high-priority tasks in red) or deadlines (e.g., overdue tasks).

4. Update the Task Tracker Regularly

As tasks are completed or new ones are assigned, update the tracker to reflect the current status, ensuring it’s always up to date.

5. Filter and Sort Tasks

Utilize Excel’s sorting and filtering options to easily prioritize tasks by status, deadline, or other factors.

6. Track Progress with Formulas

Incorporate Excel formulas, such as percent complete, to visually track the progress of each task and project.

Benefits of using an Excel-based Task Tracker

In the dynamic landscape of project management, staying organized, transparent, and adaptive is crucial for success. A spreadsheet task tracker emerges as an indispensable tool that brings a multitude of benefits to the table:

  • Organization and structure: Task-tracking spreadsheets provide a systematic structure for listing and managing tasks. Its designated columns for task details, deadlines, and responsible individuals make it a hub for organized information.
  • Visibility and transparency: Project stakeholders gain real-time visibility into task statuses and overall project progress. This transparency fosters a collaborative environment and minimizes the chances of miscommunication.
  • Efficient resource allocation: A task tracking sheet template clearly outlines tasks and their requirements to facilitate optimal resource allocation. This ensures you assign team members tasks based on their skills, availability, and the insights provided by skills matrix templates.
  • Time management: Task tracking spreadsheets aid in effective time management through deadlines and milestones. You can prioritize tasks, allocate time judiciously, and meet project deadlines more precisely.
  • Prioritization: The ability to prioritize tasks is a key feature. You can focus on high-priority items to address critical aspects promptly and efficiently.
  • Collaboration and communication: Task-tracking spreadsheets are collaborative platforms where team members can input updates, share notes, and communicate seamlessly. This fosters a cohesive team environment.
  • Accountability: Clear assigning of tasks increases individual accountability. Team members know their responsibilities, fostering a sense of ownership and commitment.
  • Adaptability: In the face of changing project dynamics, task-tracking spreadsheets allow for easy adaptation. You can modify, add, or remove tasks as project requirements evolve.
  • Historical record: Task tracking spreadsheet maintains a historical record, providing insights into past projects. This serves as a valuable resource for future planning, learning from successes, and avoiding previous pitfalls.
  • Cost management: Tracking resource allocation supports effective cost management. It ensures judicious utilization of financial resources throughout the project lifecycle.
  • Decision-making support: The wealth of data in these spreadsheets facilitates informed decision-making. As a project manager, you can analyze trends, assess performance, and make data-driven decisions.
  • Flexibility: Task-tracking spreadsheets offer flexibility, accommodating different project management methodologies. Whether following Agile, Scrum, or traditional approaches, you can tailor the spreadsheet accordingly.
  • Accessibility: You can access task-tracking spreadsheets from various devices. This ensures that team members can stay connected and contribute updates, irrespective of their location.
  • Integration with Other Tools: You can integrate these spreadsheets with other project management tools. This enhances their functionality and provides a comprehensive solution for project tracking.

How to Download Your Task Tracking Spreadsheet?

Open Your Task Tracking Spreadsheet

Once you’ve created or customized your task-tracking spreadsheet in Excel or Google Sheets, ensure it’s ready for download.

Click on File Menu

In the top-left corner of your spreadsheet application, click on the “File” menu to access the download options.

Select Download As

In Google Sheets, choose “Download As” and select your preferred format, such as Excel (.xlsx) or PDF. In Excel, select “Save As” and choose where to save the file on your device.

Save Locally

Make sure to choose a local directory on your device where the file will be saved for easy access. For added security, consider backing up your task tracker on cloud storage services available in your region, such as Google Drive or Dropbox.

FAQs About Task Tracking Spreadsheet Template

How do you track work and tasks?

To track work efficiently, utilize task-tracking spreadsheets. Open Excel and create headers for tasks, due dates, and status. Then, assign responsibilities, set dates, and use formulas if needed. Finally, regularly update and save for seamless task management and project success.

What is the best way to track tasks?

Utilize task-tracking spreadsheets for optimal task management. Create headers for tasks, due dates, and status. Assign responsibilities and regularly update the spreadsheet. This method ensures clarity, organization, and effective tracking of tasks for successful project management.

How do you keep track of multiple tasks at work?

To manage multiple tasks at work efficiently, employ task-tracking spreadsheets. This method enhances organization and ensures successful tracking of diverse work tasks.

Wrap Up

Creating a task-tracking spreadsheet is pivotal to organized and efficient project management.

Open your chosen spreadsheet software, Excel or Google Sheets, and initiate the process. Establish clear headers, including essential categories like task names, assigned individuals, due dates, and status updates. Then, input your tasks into separate rows, laying the foundation for a comprehensive overview.

Format the spreadsheet to enhance readability, adjusting cell sizes and employing colors for clarity. Also, allocate due dates to each task, utilizing the software’s date formatting features.

Include a “Status” column to visually track progress, employing labels such as “Not Started,” “In Progress,” and “Completed.” Then, assign responsible individuals to ensure accountability and a clear distribution of tasks.

Consider incorporating formulas to calculate task durations or completion percentages automatically for advanced tracking. You can also apply conditional formatting for visual cues, highlighting specific criteria. Moreover, enabling filters to streamline data analysis offers dynamic perspectives on project progress.

Regularly review and update the spreadsheet, adjusting dates, statuses, or assignments as needed. Save your work consistently by establishing a consistent naming convention and file location to prevent data loss. If collaborating, share the spreadsheet through platforms like Google Sheets for real-time updates.

Mastering the art of task tracking is a game-changer, and ChartExpo elevates the process to new heights. With its user-friendly interface, creating a task-tracking spreadsheet becomes a breeze.

Do not hesitate.

Embrace this structured approach with ChartExpo to witness enhanced productivity and successful project outcomes.

How much did you enjoy this article?

ExcelAd2
Start Free Trial!
133120

Related articles

next previous
Microsoft Excel8 min read

Excel Task Tracker Template for Smarter Task Insights

Task tracker template in Excel organizes tasks, tracks deadlines, and boosts efficiency. Learn its benefits, and explore expert tips to simplify task management.

Microsoft Excel10 min read

Invoice Tracker Template in Excel for Better Insights

An invoice tracker Excel template helps track invoices, due dates, and payments. Learn how to use this template for better financial management.

Microsoft Excel12 min read

Key Performance Indicators in Healthcare for Better Insights

Key Performance Indicators in healthcare track patient care and efficiency. Learn about these KPIs, top examples, and how to use them to improve outcomes.

Microsoft Excel10 min read

BMI Calculation Formula in Excel for Better Fitness Insights

The BMI calculation formula in Excel helps track and analyze body mass index. Explore step-by-step instructions and tips to simplify BMI tracking in Excel.

Microsoft Excel29 min read

How to Create a Tornado Chart in Excel? A Complete Guide

Click to learn how to plot a Tornado Chart in Excel using easy-to-follow steps. Also, we’ll address the following question: what is a Tornado Diagram?

ChartExpo logo

Turn Data into Visual
Stories

CHARTEXPO

  • Home
  • Gallery
  • Videos
  • Services
  • Pricing
  • Contact us
  • FAQs
  • Privacy policy
  • Terms of Service
  • Sitemap

TOOLS

  • ChartExpo for Google Sheets
  • ChartExpo for Microsoft Excel
  • Power BI Custom Visuals by ChartExpo
  • Word Cloud

CATEGORIES

  • Bar Charts
  • Circle Graphs
  • Column Charts
  • Combo Charts
  • Comparison Charts
  • Line Graphs
  • PPC Charts
  • Sentiment Analysis Charts
  • Survey Charts

TOP CHARTS

  • Sankey Diagram
  • Likert Scale Chart
  • Comparison Bar Chart
  • Pareto Chart
  • Funnel Chart
  • Gauge Chart
  • Radar Chart
  • Radial Bar Chart
  • Sunburst Chart
  • see more
  • Scatter Plot Chart
  • CSAT Survey Bar Chart
  • CSAT Survey Chart
  • Dot Plot Chart
  • Double Bar Graph
  • Matrix Chart
  • Multi Axis Line Chart
  • Overlapping Bar Chart
  • Control Chart
  • Slope Chart
  • Clustered Bar Chart
  • Clustered Column Chart
  • Box and Whisker Plot
  • Tornado Chart
  • Waterfall Chart
  • Word Cloud
  • see less

RESOURCES

  • Blog
  • Resources
  • YouTube
SIGN UP FOR UPDATES

We wouldn't dream of spamming you or selling your info.

© 2025 ChartExpo, all rights reserved.