Categories
Data cleansing is the practice of identifying and correcting data that is inaccurate. The data is then erased, changed, and replaced with newly developed or relevant data. There are various data cleansing techniques available within Power BI.


Power BI provides a range of tools that facilitate the process of data cleansing. These tools include the ability to:
These methodologies enhance precision, uniformity, and preparedness for data analysis and visualization.
In this article, we explore data cleansing techniques. We begin by defining them and discussing why data cleansing is important. We then look at the benefits that data cleansing offers. We’ll also delve into some of the tools you can use.
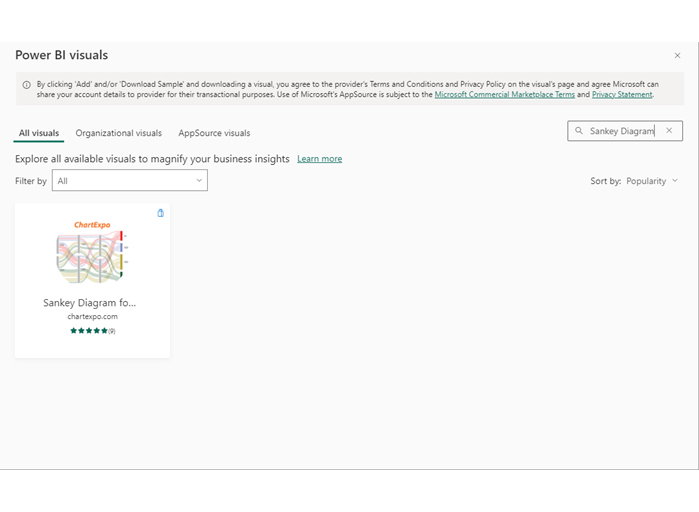
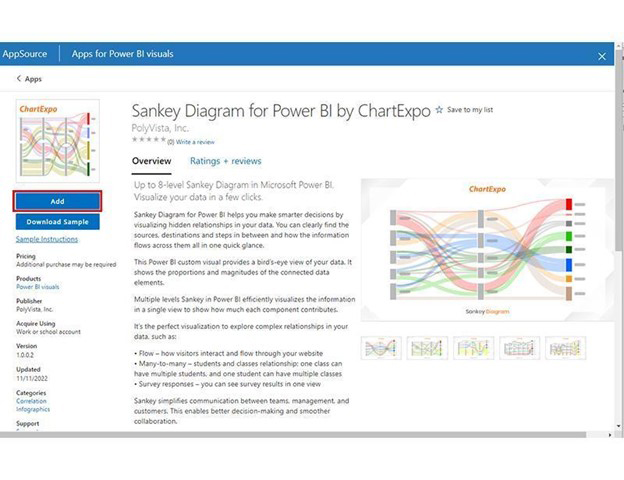
We then learn how to perform data cleansing using Power BI. We’ll use the ChartExpo Sankey diagram as an example.
First…
Definition: Data cleansing techniques are methods used to identify and rectify errors, inconsistencies, and inaccuracies within a dataset.
These techniques are essential for ensuring data accuracy, consistency, and trustworthiness during data analysis.
There are several data cleaning methods. These include:
Data cleansing techniques are critical to maintaining data quality, accuracy, and reliability. These factors are indispensable for organizations to derive meaningful insights and make informed decisions.
The accuracy of data is ensured by having clean data. Incorrect data can result in incorrect conclusions, ineffective decision-making, and squandered resources. Through data cleansing, inaccuracies, duplications, and disparities are recognized and remedied, leading to more dependable insights.
Insufficient data can obstruct analysis and result in prejudiced outcomes. The procedure of data cleansing entails the identification and resolution of missing values or the elimination of deficient records.
This guarantees that the dataset is all-encompassing and appropriate for analysis. Additionally, understanding concepts like Power BI cross-filter direction is crucial, as it influences how data relationships are interpreted, ensuring accurate insights from the cleansed dataset.
Data integration involves the incorporation of data from various sources, which often results in inconsistencies and discrepancies. Cross-tabulation can be a valuable technique in this process, allowing for a clearer comparison of different datasets. To ensure seamless integration and accurate analysis, it is essential to perform data cleansing to reconcile differences between these datasets.
Accurate data leads to better insights, which help with well-informed decision-making. Reliable data enables organizations to see opportunities, trends, and patterns more quickly, which improves their ability to make strategic decisions.
Consistency is key when it comes to effective decision-making and data analysis. Data cleaning techniques help to standardize formats, spellings, and other variations within a dataset. They ensure everything is consistent and reliable.
With enhanced data consistency, such as that achieved through a Power BI income statement, you can trust the insights you gain from your analysis and make better-informed decisions. So don’t overlook the importance of data cleansing, it’s an essential step towards success.
Effective data cleansing ensures that data is accurate, consistent, and ready for analysis. Below are some key techniques used in data cleansing:
Duplicate data can lead to misleading insights and errors in analysis. Removing duplicate data helps maintain data integrity and prevents inflated results. Using automated tools or Excel functions like “Remove Duplicates” ensures a clean dataset.
Incomplete data can affect analysis accuracy. Handling missing values involves techniques like mean imputation, predictive modeling, or removing incomplete records. Choosing the right approach depends on the data type and its impact on analysis.
Inconsistent formats can create confusion and errors. Standardizing data formats ensures that all data entries follow a uniform structure, such as consistent date formats, unit measurements, and naming conventions. This improves compatibility across different systems.
Incorrect data entries can distort analysis and lead to poor decisions. Correcting inaccuracies involves validating data against reliable sources, checking for typos, and ensuring all information is up to date. Automated validation tools help streamline this process.
Extreme values can skew results and reduce the reliability of insights. Removing outliers helps in maintaining data accuracy by identifying unusual values that do not align with expected patterns. Statistical methods like Z-score analysis can help detect and eliminate outliers.
Ensuring that data is accurate, complete, and reliable is essential. Validating data integrity includes cross-checking entries, performing audits, and using validation rules. This step prevents inconsistencies and ensures data is ready for analysis.
Mismatched data types can cause errors in calculations and analysis. Converting data types ensures that numerical values, text entries, and date formats are correctly assigned, making data processing smooth and efficient.
Data cleaning is a crucial step in the data preprocessing stage of any data analysis. It involves identifying and correcting (or removing) errors and inconsistencies in data to improve its quality and ensure data integrity. Here are some common tools and techniques used in data cleaning, which can later help you create clear visualizations using a Sankey diagram generator.
In Power BI, the cleaning of data is predominantly carried out using the Power Query Editor. The Power Query Editor is an efficient and user-friendly data transformation tool. It is seamlessly integrated into Power BI.
Users can link, clean, and alter data from various sources before importing it into the data model.
OpenRefine is an open-source tool that has been designed to effectively clean and transform data. The tool is commonly utilized for data-cleaning purposes.
OpenRefine supports the import of several data formats, so users can conveniently upload their datasets.
Upon importing the data, OpenRefine provides users with features like faceting, filtering, and sorting. These features help users comprehend the structure and quality of the data.
OpenRefine enables users to standardize data formats and values to ensure consistency across the dataset.
The tool provides tools for identifying and removing duplicate records based on user-defined criteria.
TIBCO Clarity is a specialized platform designed for interactive data cleaning. The tool provides a user-friendly interface that streamlines data quality improvements, data discovery, and data transformation.
This tool is capable of processing various types of raw data and preparing it for various applications. Additionally, it facilitates deduplication operations and address verification before moving the information to its destination.
The cleansing process configuration can be reused for future raw data.
DemandTools is an efficient data quality suite that is intended to assist organizations in enhancing their data.
It is compatible with Microsoft Dynamics 365 and Salesforce CRM.
DemandTools has a module called Cleansing Tools that is dedicated to improving data quality by:
The deduplication matching algorithm utilized in this module employs advanced techniques to identify more matches.
The Discovery Tools module enables you to validate CRM data by comparing it with external data sources.
The Maintenance Tools module streamlines CRM data management tasks, including loading, reporting, record reassignments, backups, and manipulation.
IBM InfoSphere Information Server is a comprehensive data integration platform. It offers a range of top-notch data-cleaning tools.
This tool allows for various services like standardizing information, validating and classifying data, and deduplicating records.
The platform ensures the cleanliness and quality of your data through continuous monitoring. Moreover, it also offers address cleaning services.
IBM’s InfoSphere provides real-time integration, digital transformation, governance, data monitoring, and smooth scalability of data.
Salesforce data cleansing is essential for maintaining high-quality CRM data. Over time, Salesforce databases accumulate duplicate contacts, outdated leads, and incorrect entries. A company using Salesforce for sales tracking may encounter:
B2B data cleansing focuses on refining business contact databases for better marketing and sales outreach. Companies that rely on email campaigns, lead generation, and account-based marketing need clean and up-to-date B2B data. Common issues include:
| Aspect | Data Cleaning | Data Cleansing |
| Definition | Removing errors, duplicates, and inconsistencies from data. | Standardizing, correcting, and enriching data for accuracy and usability. |
| Scope | Basic error correction. | More comprehensive, including validation and enrichment. |
| Focus | Fixing existing issues. | Improving overall data quality and consistency. |
| Techniques | Removing duplicates, fixing typos, and handling missing values. | Standardization, validation, deduplication, and data enhancement. |
| Outcome | Cleaned but not necessarily optimized data. | High-quality, structured, and reliable data for analysis. |
Data cleansing in Power BI ensures accuracy, consistency, and reliability in reports and analysis. Follow these steps to clean your data effectively:
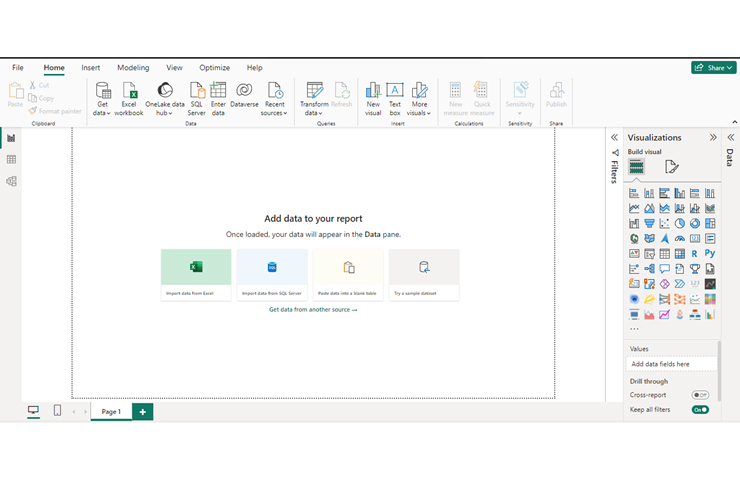
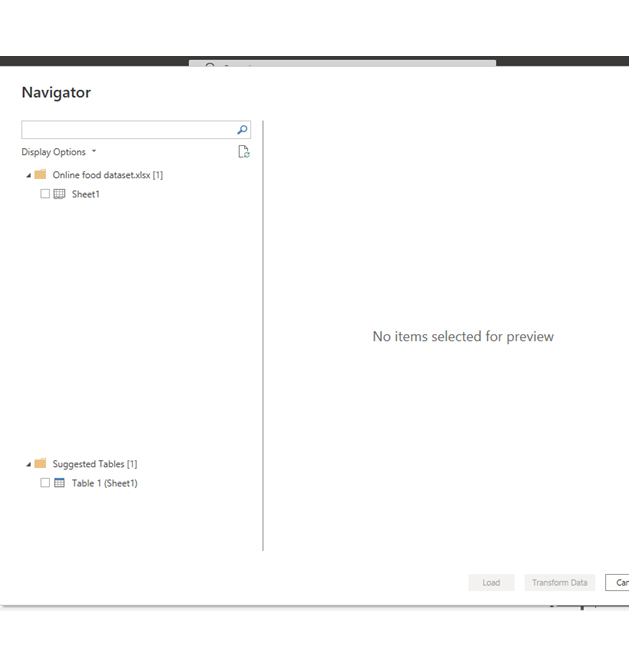
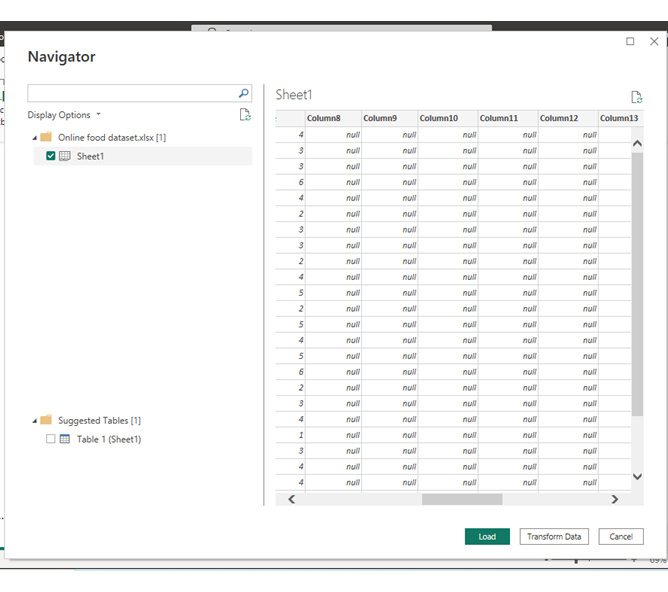
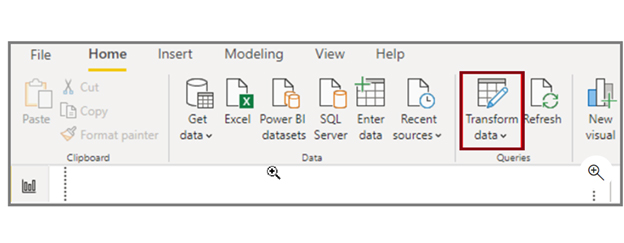
Start by importing data from Excel, databases, or other sources into Power BI. Use Power Query Editor to access the raw data and begin the cleansing process.
Duplicate data can cause inconsistencies in reports. In Power Query, select the relevant column, click Remove Duplicates, and ensure your dataset is free from redundant entries.
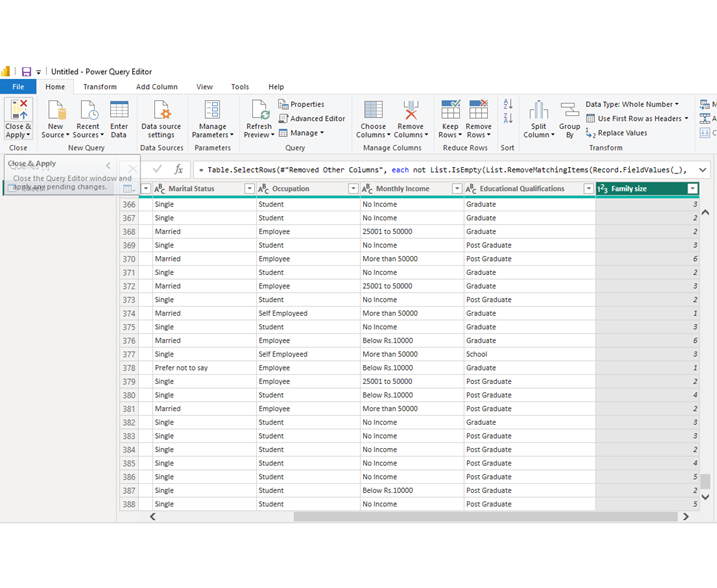
Missing values can impact data accuracy. Use the Replace Values function to fill in missing entries or the Remove Rows option to eliminate incomplete records.
Ensure consistency in data, text, and numerical values. Use Transform Options in Power Query to change text cases, modify date formats, and ensure numeric consistency.
Check for incorrect spelling, formatting errors, and mismatched values. Use the Find & Replace tool to correct typos and maintain data accuracy.
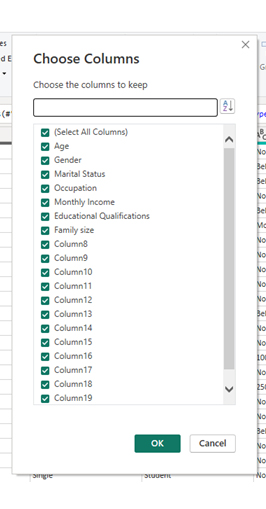
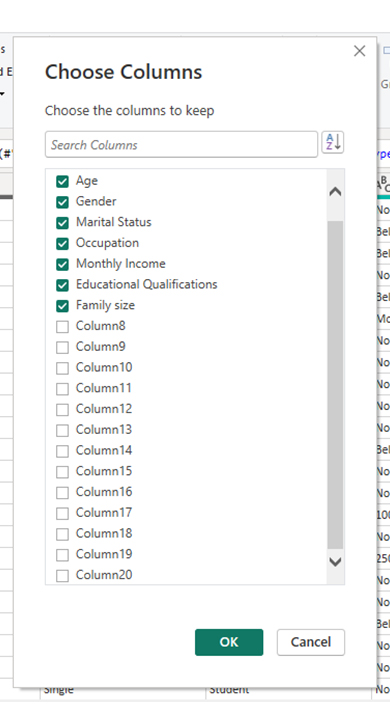
Eliminate columns that are not needed for analysis. Select unwanted columns and click Remove Columns to keep only relevant data.
Extreme values can skew results. Use Conditional Formatting or statistical functions to identify and remove unusual values that distort insights.
Review the cleansed data, ensure it meets accuracy standards, and click Close & Apply to finalize the changes in Power BI before creating insights with Power BI charts.
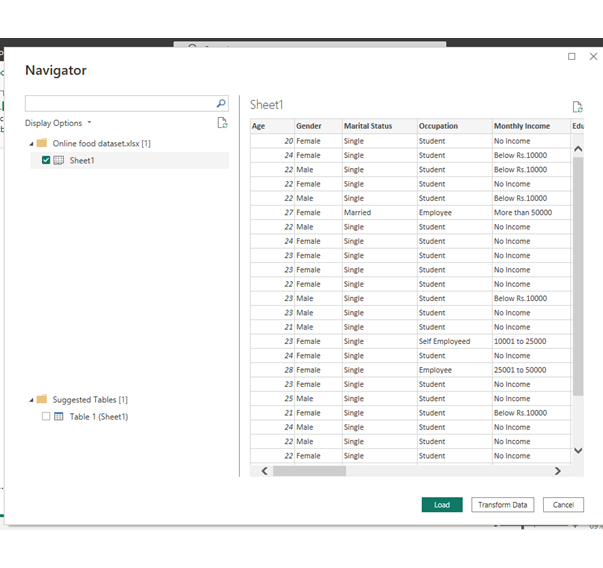
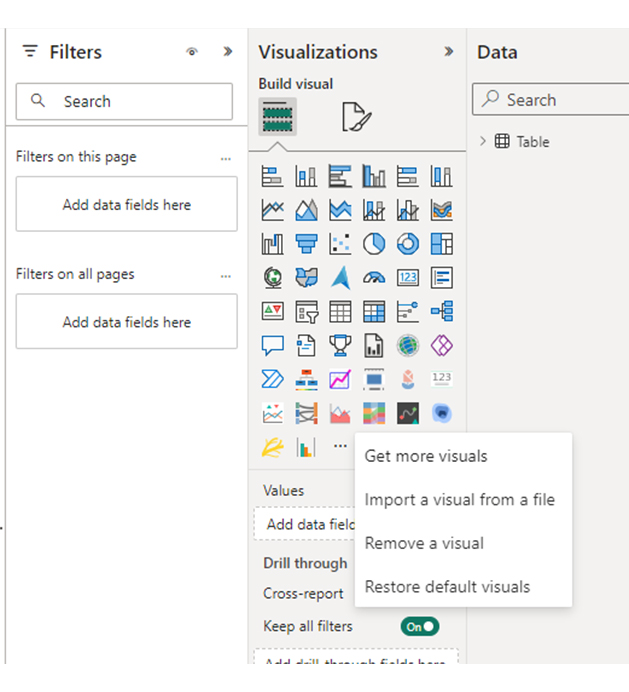
In this section, we’ll learn how to clean data using Power BI. We’ll use the Sankey diagram in Power BI (also known as the Sankey chart) as an example in Power BI Desktop.


| Age | Gender | Marital Status | Occupation | Monthly Income | Educational Qualifications | Family size |
| 20 | Female | Single | Student | No Income | Post Graduate | 4 |
| 24 | Female | Single | Student | Below Rs.10000 | Graduate | 3 |
| 22 | Male | Single | Student | Below Rs.10000 | Post Graduate | 3 |
| 22 | Female | Single | Student | No Income | Graduate | 6 |
| 22 | Male | Single | Student | Below Rs.10000 | Post Graduate | 4 |
| 27 | Female | Married | Employee | More than 50000 | Post Graduate | 2 |
| 22 | Male | Single | Student | No Income | Graduate | 3 |
| 24 | Female | Single | Student | No Income | Post Graduate | 3 |
| 23 | Female | Single | Student | No Income | Post Graduate | 2 |
| 23 | Female | Single | Student | No Income | Post Graduate | 4 |
| 22 | Female | Single | Student | No Income | Post Graduate | 5 |
| 23 | Male | Single | Student | Below Rs.10000 | Post Graduate | 2 |
| 23 | Male | Single | Student | No Income | Post Graduate | 5 |
| 21 | Male | Single | Student | No Income | Graduate | 4 |
| 23 | Female | Single | Self Employed | 10001 to 25000 | Post Graduate | 5 |
| 24 | Female | Single | Student | No Income | Post Graduate | 6 |
| 28 | Female | Single | Employee | 25001 to 50000 | Post Graduate | 2 |
| 23 | Female | Single | Student | No Income | Graduate | 3 |
| 25 | Male | Single | Student | No Income | Graduate | 4 |
| 21 | Female | Single | Student | Below Rs.10000 | Post Graduate | 1 |
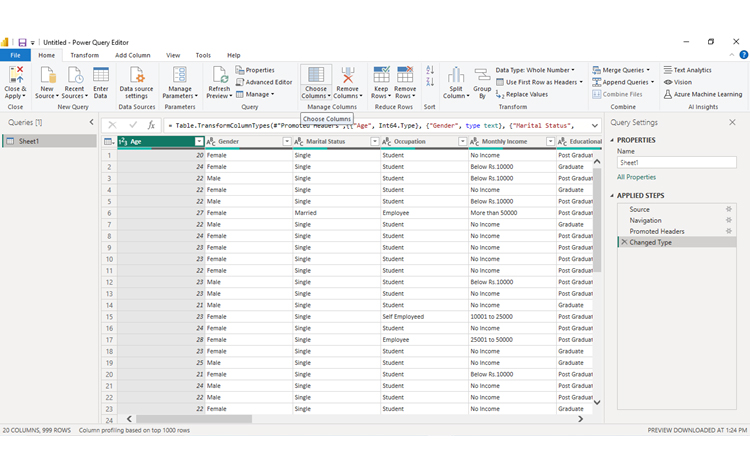
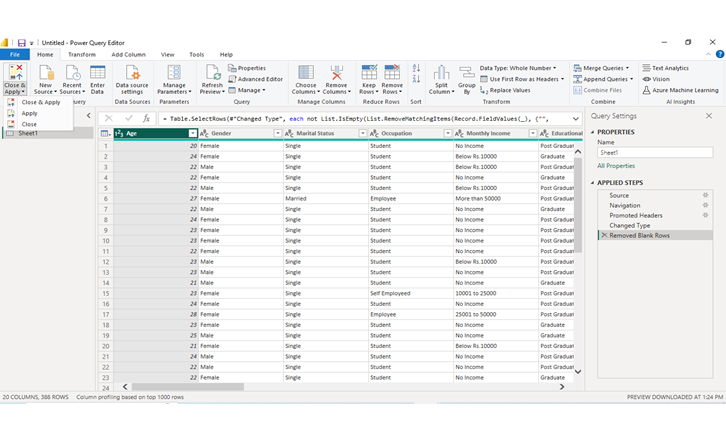
The data in your selected query is displayed in the middle of the screen. To the left, the queries pane list is available and to the right, a list of your steps is available in the Query Settings pane.

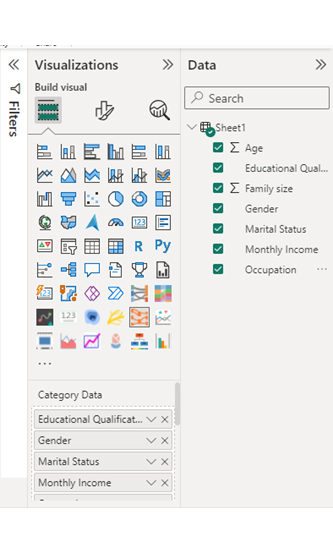
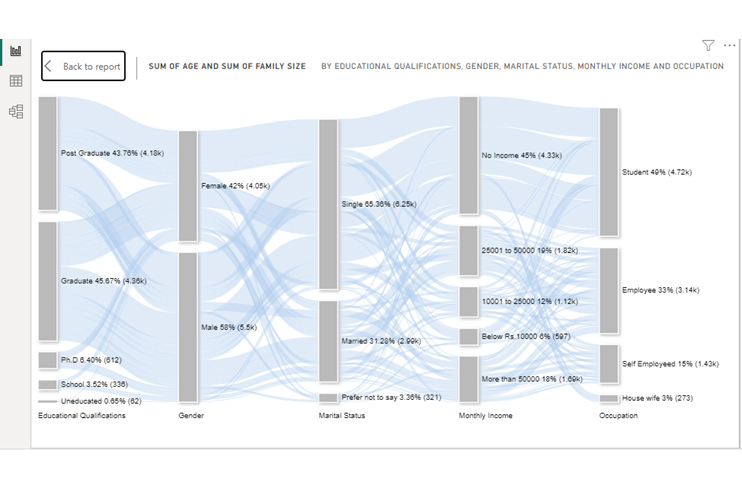
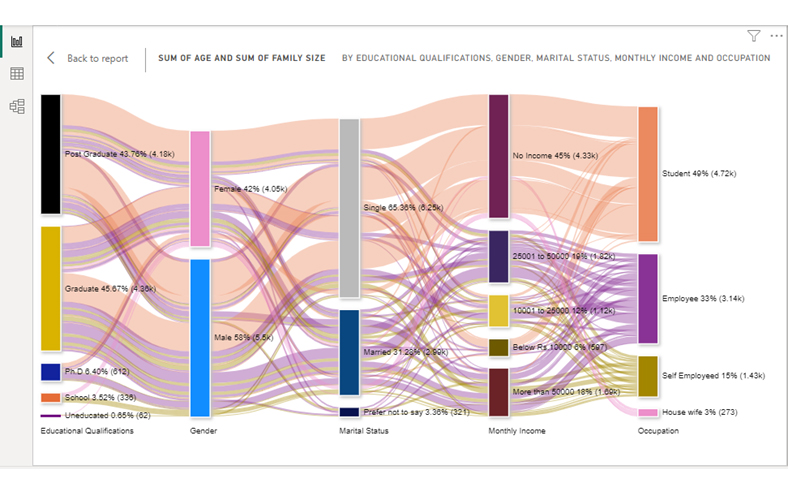
The dataset above was gathered from an online based platform for ordering food. It includes different characteristics linked to occupation, family size, feedback, and more.
This dataset is used to examine how demographic and location factors relate to online food ordering habits.
Cleaning massive amounts of data requires significant time and computing power, making the process complex and resource-intensive.
Duplicate records often appear in different formats, making it difficult to detect and merge them without losing critical information.
Missing values can lead to biased analysis. Deciding whether to remove, fill, or predict missing data is a major challenge.
Merging data from multiple sources often results in inconsistencies in formats, naming conventions, and data structures, requiring additional cleaning efforts.
Even after cleansing, data quality can degrade due to outdated information, requiring continuous monitoring and updates.
In this section, we delve into the transformative benefits of data cleansing techniques. We explore how they empower organizations to extract actionable insights from their data assets.
Here are some key advantages of implementing data cleaning techniques:
Power BI provides a variety of tools and techniques to identify and rectify data errors. Whether it’s incorrect values, misspellings, or typos, these tools can help you get rid of them. This boosts the accuracy and reliability of your data.
Clean data is easier to integrate across different systems and platforms. This facilitates seamless data exchange and interoperability between various applications within an organization.
Teams can make informed decisions based on a shared understanding of clean and accurate data. This alignment ensures that everyone is working towards common goals and objectives.
Data cleansing often involves identifying and removing redundant or obsolete data. This reduces the risk of data breaches and unauthorized access. By maintaining a clean data environment, organizations can enhance data security and protect sensitive information.
Many industries have strict compliance and regulatory requirements regarding data accuracy and privacy. Data cleansing helps organizations ensure compliance with these regulations by maintaining accurate and secure data.
Frequent audits help identify errors, duplicates, and inconsistencies before they impact decision-making. Schedule periodic reviews to maintain clean and reliable data.
Leverage AI-driven tools and scripts to streamline the cleansing process. Automated solutions help remove duplicates, standardize formats, and validate missing values efficiently.
Ensure consistency in data formats, such as dates, currencies, and text capitalization. This minimizes discrepancies and enhances data integration across platforms.
Duplicates distort analysis and confuse. Use built-in deduplication features in tools like Excel, Power BI, or Salesforce to eliminate redundant records.
Cross-check data from multiple sources before using it for analysis. Implement validation rules to prevent incorrect or incomplete entries from entering your system.
Data cleansing involves a range of tasks aimed at improving the quality and dependability of datasets.
Examples of data cleansing include:
Data cleansing involves three critical points: accuracy, completeness, and consistency.
Accuracy entails the elimination of errors, inconsistencies, and duplicates. This ensures the data is reliable for decision-making and analysis.
Completeness ensures that a dataset has all the necessary information. This information includes the missing values to provide a comprehensive view of the subject matter.
Consistency focuses on standardizing data formats, resolving variations in entries, and promoting uniformity across different sources. This enables seamless integration and reliable analysis.
Addressing these aspects can improve the quality and reliability of the data. This enables organizations to gain valuable insights and make informed decisions.
Data cleansing is an essential process for ensuring data quality, accuracy, and reliability.
Businesses increasingly rely on data-driven insights for critical decisions. The importance of clean and trustworthy data, therefore, cannot be overstated.
This article discusses data cleansing techniques that can be used to transform raw data into valuable assets. These include:
Power BI provides the intuitive Power Query Editor to help you streamline the data cleansing process.
After cleaning our data via Power Query, we then used it in a Sankey diagram.
We hope that these data-cleaning techniques will empower you to work with accurate and reliable data. Better still, make decisions based on high-quality data and keep everyone moving in the same direction.
How much did you enjoy this article?


Discover diverse and high-quality Power BI report examples for inspiration and insights. Elevate your reporting with strategic visualization techniques.

A Customer Relationship Management Dashboard centralizes data, tracks key metrics, and drives smarter business decisions. Discover now!

Explore Healthcare Dashboard Examples and learn how to turn complex healthcare data into clear, actionable insights for better decision-making.


