Categories
By ChartExpo Content Team
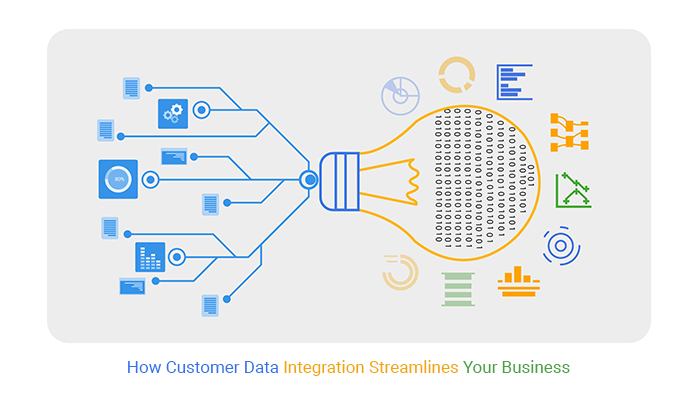
Customer Data Integration is more than a technical solution—it’s the backbone of modern businesses. When your data lives in scattered silos, it’s like trying to connect the dots without seeing the full picture. This disjointed setup leads to inefficiencies, missed opportunities, and frustrated customers. Integration isn’t optional—it’s the key to staying competitive.
Think about how many ways your business interacts with customers—emails, social media, in-store visits, and more. Without Customer Data Integration, these touchpoints become fragmented pieces of a puzzle.


A centralized approach allows your teams to work together, delivering a seamless customer experience. It’s not just about organizing data; it’s about aligning your business for success.
Customer Data Integration empowers your team to act smarter and faster. From improving lead qualifications to identifying cross-sell opportunities, integrated data gives you a clear, actionable view.
Whether you’re marketing a product or solving a customer’s problem, having all the right information in one place makes all the difference.
First…
When you have customer data all over the place, it’s like trying to bake a cake with ingredients scattered around a massive kitchen. You might find the flour but forget where the eggs are!
Centralizing customer data is exactly like getting all your ingredients on one counter. Suddenly, everything is easier, quicker, and less prone to errors. This setup not only saves time but also reduces the chances of overlooking valuable information that could help in making data-driven decisions.
Imagine a relay race where each runner knows exactly where to hand off the baton. A unified customer data system works similarly, enhancing teamwork across departments.
Marketing can seamlessly pass insights to Sales, who then use sales follow-up statistics to inform Customer Service about potential issues or opportunities. This smooth exchange of information leads to quicker responses and more coordinated efforts, ultimately boosting the overall performance of the company.
Working with siloed data systems is like trying to solve a jigsaw puzzle with pieces from different boxes. It’s frustrating and inefficient.
Each department might be seeing only a part of the customer’s story, leading to miscommunications and missed opportunities. Additionally, maintaining multiple systems can be costly and complex, draining resources that could be better used elsewhere.
In many organizations, data silos often spring up without a clear, intentional plan. These silos typically originate from different departments using separate systems for handling their data needs.
For instance, the marketing team might rely on a customer relationship management dashboard, while the finance team uses separate accounting software. This separation can create isolated information pools, hindering a unified view of data across the organization.
One effective strategy for breaking down data silos involves implementing organization-wide software that supports all departments. This might look like adopting an enterprise resource planning system that integrates data from sales, accounting, customer service, and more.
Additionally, establishing regular cross-departmental meetings helps align data priorities and improve data flow. Incorporating data flow diagrams can provide clarity on how information moves between systems. Using middleware software further enhances this by connecting disparate systems, enabling efficient communication and data sharing without the need for replacement.
Maintaining data consistency involves regular audits to check for discrepancies and ensure that all systems are updated simultaneously. Data governance policies can be established to set standards for data entry, storage, and processing, ensuring that data remains reliable and accurate across all systems.
Implementing tools like master data management (MDM) can also play a crucial role by creating a single source of truth for core business data, which reduces errors and duplication.
Every interaction a customer has with your brand—be it online, in-store, or via customer service—creates a touchpoint, a chance to impress and engage.
By integrating these touchpoints, the data collected at each step informs the next, creating a cohesive, personalized customer journey maps. Imagine a customer browsing a product online and then receiving a related coupon on their next visit to the store. This level of personalization not only delights the customer but also boosts loyalty and sales.
Nothing beats the convenience and efficiency of real-time data access. In today’s fast-paced world, customers expect quick and informed responses. Whether they’re making a purchase or seeking support, real-time access to data allows businesses to provide answers and solutions without delay. This immediacy can dramatically improve the overall customer experience, making interactions smoother and more satisfying.
Ever felt frustrated when you had to repeat your issue to multiple representatives? That’s a common pain point in multi-channel customer journeys.
However, with unified data, businesses can track and analyze the customer’s path across all channels. This means no matter where the interaction picks up, the context is maintained. A service rep can see what the customer did on the website, what they purchased in-store, and what issue they called about—all in one place.
This holistic view enables businesses to provide a consistent, informed, and efficient service that customers appreciate.
Incorporating various data visualization tools like Heatmaps, Scatter plots, and Sankey Diagrams can further enhance understanding and decision-making around these integrated customer journeys. Each of these types of charts and graphs provides unique insights that help fine-tune the customer experience from multiple angles, ensuring that every interaction is both pleasant and productive.
The following video will help you create a Sankey Chart in Microsoft Excel.
The following video will help you to create a Sankey Chart in Google Sheets.
The following video will help you create a Sankey Chart in Microsoft Power BI.
Imagine marketing, sales, and support as members of a relay race team. To win, each runner must be in sync, passing the baton smoothly. In business, that baton is customer data.
When these teams work in harmony, leveraging tools like CRM analytics or integrated software platforms, the customer experience becomes seamless. Customers no longer need to repeat themselves with each department, and teams can anticipate their needs and preferences with precision, enhancing overall satisfaction.
Unified customer data isn’t just about understanding your customers—it’s about strategic advantage. With all data points—from demographic info to engagement metrics—centralized, the guesswork in lead qualification is drastically reduced.
Sales teams can prioritize leads who have shown a genuine interest through their interactions, making their efforts more focused and effective. It’s like having a radar chart of customer engagement, helping pinpoint exactly where to focus energies for maximum conversion.
When you fully understand your customers’ journeys and preferences, spotting opportunities to upsell or cross-sell becomes much easier.
This is where a well-organized crosstab chart becomes invaluable. By incorporating customer behavior analytics, it reveals patterns in behavior and preferences, highlighting which products or services customers may be interested in based on past interactions.
For example, a customer who purchased a high-end camera might be interested in a tripod or extra lenses. Sales teams equipped with this data can make relevant, timely offers, enhancing the customer experience and boosting revenue.
Ever tried fitting a square peg in a round hole? Doesn’t work, right? That’s just like using incorrect customer segmentation for your marketing strategies.
By pulling together all your data sources, you can see who your customers really are, not just who you think they are. This clarity allows businesses to tailor their marketing efforts more effectively, ensuring the right messages reach the right ears.
Imagine being a detective with all the clues at your fingertips. Integrated data acts just like that. It pulls together insights from various channels, helping marketers understand what’s working and what’s not.
This way, they can tweak their campaigns in real-time, boosting efficiency and ROI. It’s about making every dollar count, and every campaign shine brighter.
Have you ever watched a mystery movie and figured out the twist before it was revealed? That’s a bit like tracking customer behavior across different channels.
Whether they’re scrolling through a website, engaging on social media, or shopping in-store, each action tells a part of their story. By mapping these behaviors, companies can craft experiences that are not just good, but memorable.
When businesses merge their customer data from different sources, they often find that they have multiple records of the same information. This duplication can lead to confusion and inefficiency.
By centralizing data, companies can identify and remove these redundancies, streamlining data management and improving accuracy. This not only speeds up data retrieval but also reduces the chances of errors that can occur when dealing with multiple data sets.
Integrating customer data into a unified system simplifies the workflow, reducing the need for manual data entry and manipulation. This integration allows for automation of tasks that were previously done by hand, such as compiling reports or updating records.
Workers can now focus on more strategic tasks rather than getting bogged down by routine data management. This shift not only speeds up operations but also increases job satisfaction among employees who can engage in more meaningful work.
With all customer data in one place, businesses can speed up their operations dramatically. Decision-makers have quick access to the information they need, enabling faster responses to market changes or customer needs.
This unified data approach supports better decision-making and more agile business practices. For instance, marketing teams can quickly adjust campaigns based on real-time customer data, leading to better outcomes and more efficient use of resources.
Imagine having a complete story of your customer’s journey, from the first interaction to the latest purchase. By linking transactional data (like purchase history) with engagement data (such as website visits and social media interactions), businesses gain a holistic view.
This connection helps identify patterns that might not be visible when examining data silos separately.
With a robust dataset combining transactional and engagement information, businesses can foresee future trends.
Predictive analytics uses this data to forecast customer behaviors, such as predicting who might churn or identifying who is likely to make a purchase soon. This foresight allows companies to act proactively, enhancing customer satisfaction and retention.
By focusing on the lifetime value of customers, businesses can tailor strategies to enhance retention. This metric offers a long-term view, encouraging investments in relationship-building and personalized marketing.
It shifts the focus from one-time transactions to ongoing engagement, helping businesses cultivate a loyal customer base.
To truly understand your customers, you need to gather data from various sources and bring them together into a unified view. This approach allows businesses to see a complete picture of customer interactions and behaviors.
By merging data from social media, purchase histories, and customer service interactions, companies can form a detailed profile of each customer. This rich insight leads to more effective marketing strategies and improved customer experiences.
Visual tools like Mosaic Plots or Tree Maps can be incredibly useful in displaying these complex data sets in an easy-to-understand format.
With all customer information in one place, businesses can apply analytics to uncover patterns and trends that were previously hidden.
For example, using a Multi axis line chart, analysts can compare different data attributes and their impacts on customer retention simultaneously, providing clear insights into what factors most influence customer loyalty.
Predictive analytics modeling takes the insights drawn from advanced analytics to the next level. By integrating diverse data streams, businesses can create models that forecast future customer actions with a high degree of accuracy.
These models can predict which customers are likely to churn or what products are likely to become best-sellers.
Techniques like the Sankey Diagram can illustrate the flow of customers through different stages of the buying process, helping businesses to identify critical touchpoints that influence purchasing decisions.
Additionally, using a Pareto chart can help highlight the most significant factors contributing to customer churn rate, enabling targeted intervention strategies.
Data integration can get messy. You’ve got loads of data coming in from all corners, and it’s not always in the best shape. The first thing you need to focus on is cleaning this data. This means fixing typos, aligning date formats, and correcting any inaccuracies that pop up.
Think of it as prepping your ingredients before you start cooking—a crucial step if you don’t want to end up with a data disaster on your hands!
Duplicates are the pesky flies of the data world—always buzzing around and doubling up where you don’t need them.
When you merge data from different sources, it’s common to see the same information popping up more than once. Applying deduplication tools can help squash these duplicates, making your dataset cleaner and more efficient.
Standardizing formats is just as important. Ensure that all data follows the same format rules so that an email address looks like an email address and a phone number looks like a phone number, no matter where it comes from.
Once your data is neat and tidy, you’ll want to keep it that way, right? This is where monitoring tools step in. These handy tools keep an eye on your data to catch any new errors that try to sneak in. Think of them like the vigilant lifeguards at the data pool, always on duty to ensure everything stays in order. Regular audits and checks are a must to maintain the integrity of your data.
Using tools like heatmaps for spotting trends and anomalies, or a neatly organized crosstab chart to visualize complex relationships in your data can be incredibly effective. Don’t forget about the power of a Pareto chart to highlight the most significant issues that could impact your data quality, allowing you to focus your efforts where they’re needed most.
Businesses today are faced with managing customer interactions across a variety of channels. These channels range from online platforms like websites and social media to offline interactions such as in-store visits and call centers. The key to effective management lies in integrating customer data from all these sources. This integration offers a unified view of the customer journey, enhancing service delivery and personalization.
Combining data from both digital and physical touchpoints presents a clear, holistic view of the customer journey.
Imagine a customer who browses products online but makes the purchase in a physical store. Tracking these interactions together rather than separately helps businesses understand the complete path to purchase.
This can involve data from point-of-sale systems, online browsing patterns, and even customer service interactions.
Once data from various channels is integrated, businesses can analyze which channels are performing best. They can look at metrics like conversion rates, time spent, and customer satisfaction across different channels.
This isn’t just about numbers; it’s about understanding which touchpoints bring value to customers and drive them towards a purchase. This kind of analysis often utilizes tools like heatmaps or scatter plots to visualize data effectively.
Ensuring that customers have a consistently positive experience across all channels is a big challenge. Integrated data helps pinpoint inconsistencies and gaps in the customer journey.
For example, if customers receive excellent service online but poor service in-store, this issue can be identified and addressed. Using tools like journey maps and service blueprints can help visualize the entire customer experience, highlighting areas for improvement.
Centralized dashboards act like a control room for your business’s vital stats. They pull in key metrics from different departments and present them in an easy-to-understand format.
Think of it as your business’s scoreboard, where every crucial number is displayed. From here, making decisions becomes faster, as all the needed data is right in front of your eyes, presented in visual forms like heatmaps or a sleek Sankey plot.
The old way of waiting for data to trickle in from various channels can feel like watching paint dry. By setting up systems that synchronize data collection, the lag in data aggregation is drastically cut down.
This means you’re always working with the most current data, whether it’s showing up in a histogram or a dynamic scatter plot chart.
Streamlining reporting processes is like clearing a jam-packed highway. When you remove the roadblocks in data processing, information flows faster.
Automation tools can transform raw data into actionable insights, ready to be explored in a multi-axis line chart or a detailed mosaic plot. This not only speeds up the reporting cycle but also frees up your team to focus on what they do best – making strategic decisions based on solid data.
Each of these steps not only accelerates the reporting process but transforms raw data into a strategic asset that can guide better business decisions.
With tools like radar charts and waterfall charts at your disposal, the data visualization possibilities are extensive, enabling clearer insights and quicker action.
Why do some folks drag their feet during integration projects? Often, it’s fear of the new or unknown. To tackle this, clear communication is key. Keep everyone in the loop about what’s happening and why it’s good for them. Training and support can also help ease the transition, making new systems less scary for those who are set in their ways.
When you’re juggling multiple systems, things can get tricky. One big hurdle is the lack of interoperability. To get around this, consider using middleware that acts as a translator between systems, ensuring they can talk to each other without a hitch.
Also, plan for scalability from the start. You want a system that grows with your needs, not one that becomes obsolete the next year.
Maintaining data quality over time is no small feat. Regular audits are a must to catch any issues before they become big problems. Implementing automated data cleansing processes can also help keep your data in top shape without manual intervention.
And remember, training your team on the importance of data hygiene is crucial; after all, they’re the ones handling the data day in and day out.
Customer Data Integration is the process of combining customer data from various sources into a unified system. This ensures all teams—marketing, sales, and support—have access to the same information. By centralizing data, businesses can make informed decisions, enhance collaboration, and provide consistent customer experiences across all touchpoints.
Customer Data Integration eliminates data silos, allowing teams to work more efficiently and gain a complete understanding of their customers. It helps businesses reduce errors, avoid duplicate efforts, and improve customer engagement by ensuring accurate, real-time insights. This integration supports better decision-making and enhances operational effectiveness.
When customer data is unified, all teams work from the same information, breaking down communication barriers. Marketing can pass qualified leads to sales, and sales can inform customer service of potential issues or opportunities. This shared data fosters teamwork, reduces miscommunication, and improves overall company performance.
Without Customer Data Integration, businesses often face inefficiencies, such as duplicate records, incomplete customer profiles, and misaligned teams. These challenges lead to wasted time, poor customer experiences, and missed opportunities. Additionally, siloed systems make it harder to analyze and act on valuable customer insights.
To start integrating customer data, businesses should assess their existing systems, identify gaps, and choose an integration platform that fits their needs. Establishing data governance policies ensures consistency and accuracy. Regular audits and cross-departmental collaboration are key to maintaining a seamless integration process.
By unifying customer data, businesses can understand customer behaviors, preferences, and needs more effectively. This allows for personalized interactions, targeted marketing campaigns, and faster resolution of issues. A seamless experience across channels builds trust and strengthens customer relationships.
Absolutely. Small businesses often face limited resources, making efficiency even more critical. Customer Data Integration helps them manage data effectively, reduce errors, and build stronger customer relationships. With the right approach, small businesses can compete with larger companies by delivering exceptional, data-driven customer experiences.
Integrated data provides businesses with actionable insights into customer preferences, market trends, and operational inefficiencies. These insights enable informed strategies, helping businesses identify opportunities and improve customer retention. As businesses grow, a unified data system ensures scalability without losing operational efficiency.
Customer Data Integration isn’t just about merging systems—it’s about connecting the dots for smarter decisions and better teamwork. By unifying data, businesses can remove silos, improve collaboration, and build stronger customer relationships. This approach creates a foundation for faster decisions and seamless interactions.
Through integrated data, teams gain a complete view of the customer journey. Whether it’s targeting the right audience, improving service, or boosting sales, the results are clear. Businesses save time, reduce errors, and uncover opportunities they might’ve missed before.
The benefits go beyond internal efficiency. Integrated data helps companies meet customer needs with precision, offering meaningful experiences that build trust and loyalty. It’s not just a strategy—it’s the way forward for businesses that want to stay ahead.
Your data has the power to transform how you work and connect. Start making it count today.
How much did you enjoy this article?


Calculate accounts receivable turnover ratio to measure credit collection speed, improve cash flow, and strengthen your financial strategy. Read on!

Change Management KPIs are the key to tracking adoption, performance, and ROI during transitions. Find out which metrics matter. Read on!

Data collection methods and techniques determine the quality of every insight you act on. Explore key approaches for gathering reliable data. Read on!


