Categories
Your internal data requires protection and organization, and that’s where data governance comes in. Data governance acts as a form of insurance that ascertains that all pieces of information you gather are properly stored and distributed within the organization.


This guide answers the “What is data governance?” question. It also shows you the pillars of data governance and the benefits of data governance.
First…
Data governance involves managing frameworks, processes, policies, and standards that ensure high-quality data quality, compliance, and security within the organization. It involves defining rules, responsibilities, and procedures for collecting, processing, storing, and using data.
With effective data governance, organizations will be able to maintain data integrity, accuracy, and confidentiality while adhering to regulatory and legal requirements.
These are the common pillars of data governance strategy:
Ensure data consistency, accuracy, and reliability. You also need to establish processes and standards for data cleansing techniques, data validation, and maintenance.
Define responsibilities and roles for teams (or individuals) responsible for managing and maintaining data security, quality, and compliance throughout its lifecycle.
You have to address the protection of sensitive information and ensure compliance with privacy regulations. Also safeguard data against breaches, unauthorized access, or misuse.
Address the stages of data from creation to disposal. Also define processes for data acquisition, processing, storage, archiving, sharing, and deletion in a controlled manner.
Focuses on managing and capturing metadata. That includes information about the origin, structure, context, and usage of data. This will, in turn, enhance the understanding and discoverability of data assets.
Implementing data governance involves a structured approach to establish processes, controls, and policies for effective data management. You can get started by gaining organizational buy-in and commitment from leadership. You should also define clear goals, objectives, and key performance indicators (KPIs) for the data governance initiative.
Come up with a cross-functional data governance team with representatives from various departments. After that, develop a comprehensive data governance framework that outlines roles, responsibilities, and data-driven decision-making processes. Moving on, you’ll have to conduct a thorough assessment of existing data quality, assets, and processes.
Data policies and standards should be created and communicated, and that includes addressing data quality, compliance, security, and lifecycle management. Implement metadata management and document data lineage. Also, provide training to staff to ascertain adherence and understanding of data governance principles.
Your data governance framework should be continuously monitored, assessed, and refined to meet evolving business needs and industry regulations.
Here are the major challenges in data governance.
Inconsistencies and inaccuracies compromise decision-making reliability.
Ongoing privacy compliance and data security challenges amid cyber threats and evolving regulations.
Constraints in skilled personnel and monthly budgets hinder effective implementation.
Insufficient commitment from the top management hinders resource allocation.
Cultural resistance to a data-centric culture and lack of awareness impede organizational acceptance.
Diverse sources and systems pose challenges for standardized governance.
Continuous efforts are required to adapt to evolving privacy regulations and data protection.
Always strike a balance between fostering innovation and enforcing governance policies.
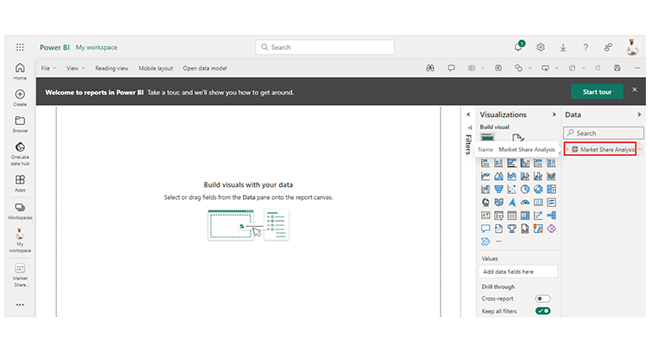
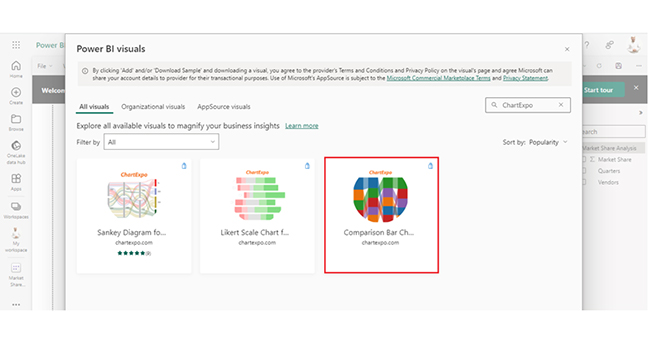
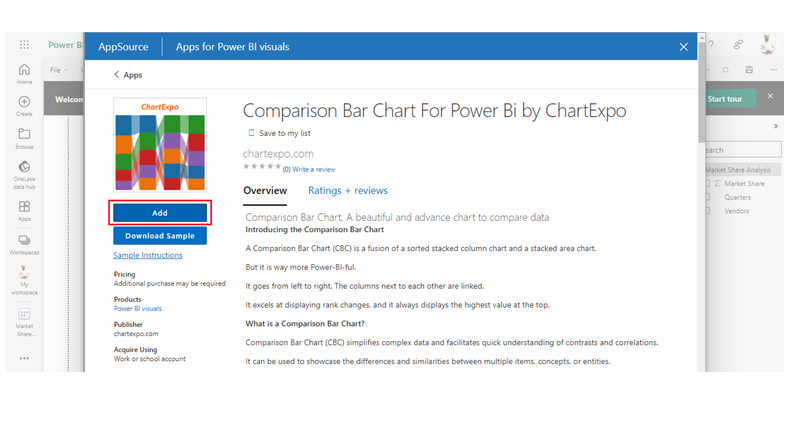
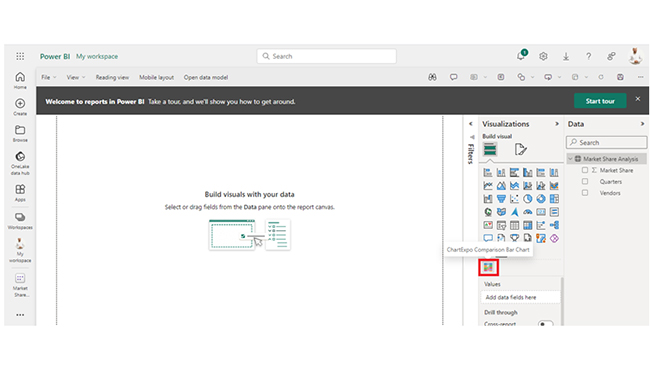
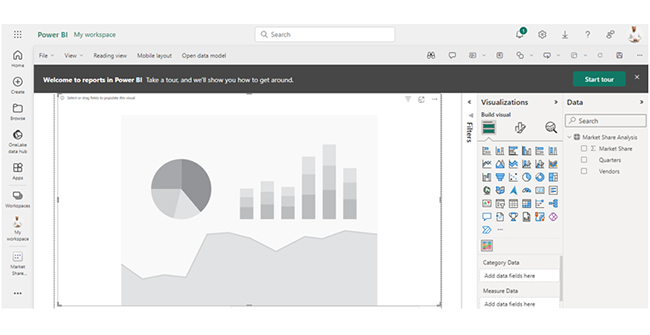
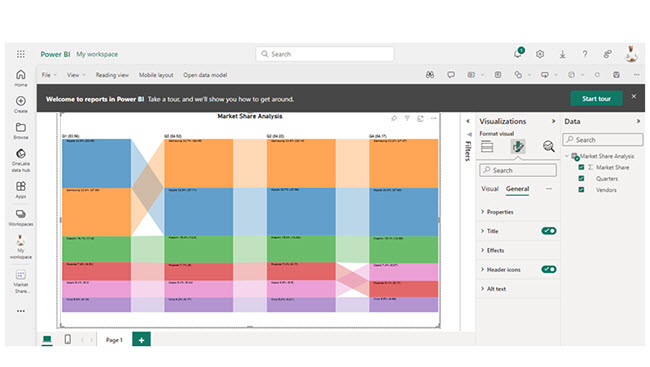
Here are five steps to help you establish data governance using Power BI.
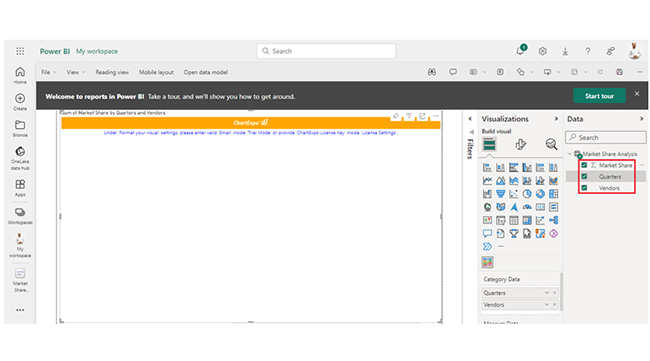
Define the data governance policies. And that includes security protocols, data quality standards, and compliance requirements.
Use the Power BI’s role-based access control (RBAC) to manage user access. Also, define roles and permissions to restrict (or grant) access to sensitive data.
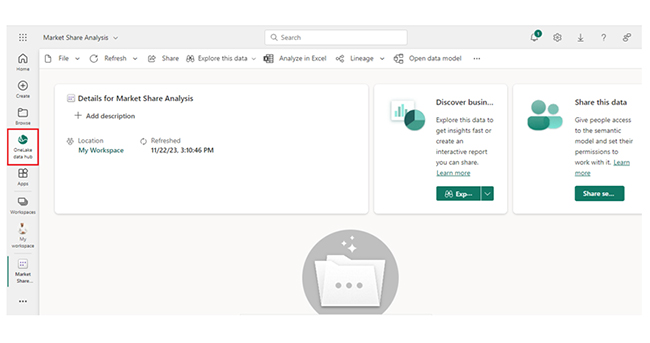
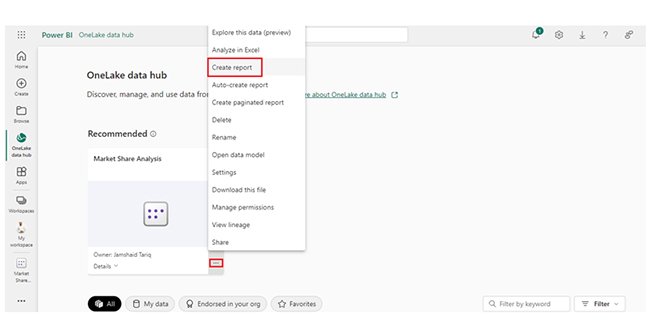
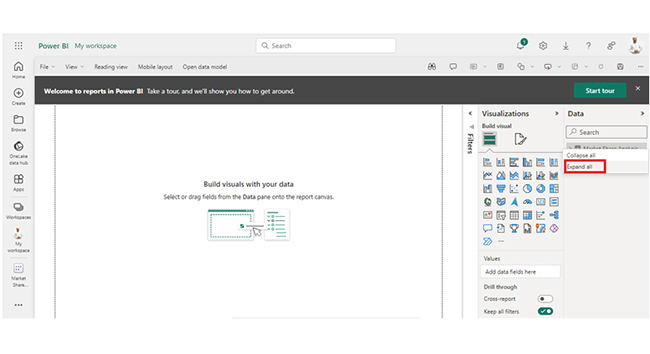
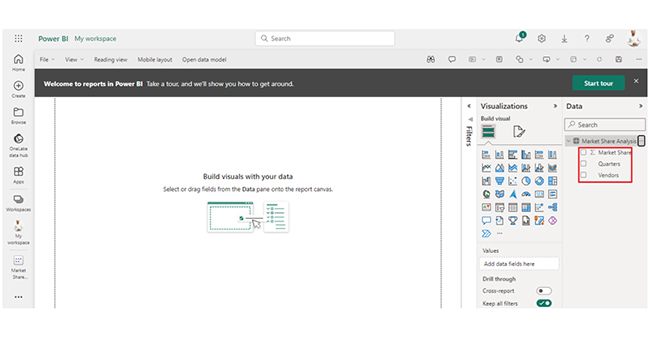
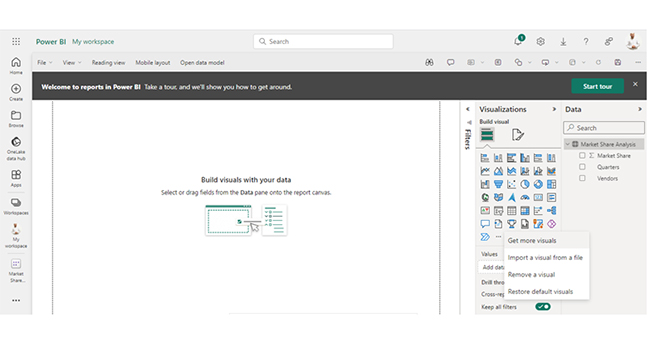
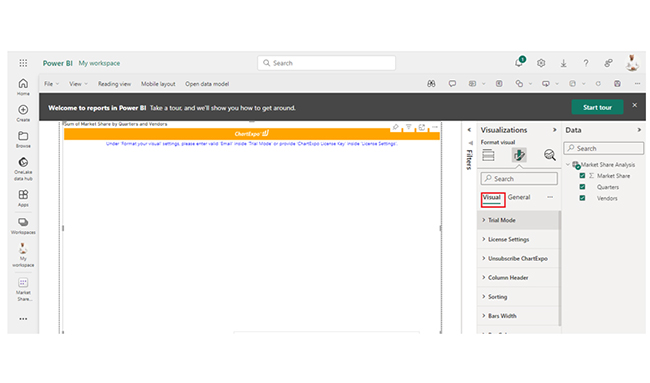
Document data sources, calculations, and transformations in Power BI. You also have to take advantage of the lineage view to understand the flow of data and maintain documentation for auditing purposes.
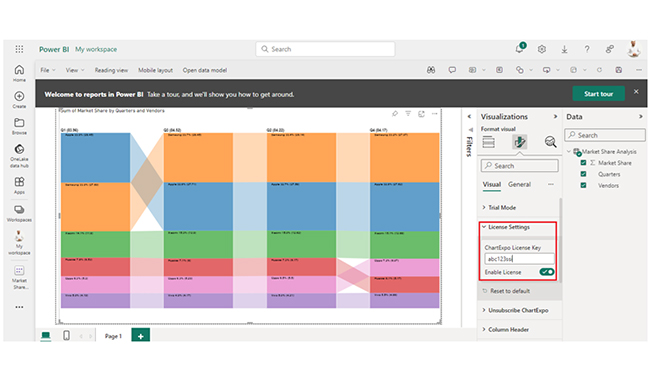
Apply Row-Level Security to restrict data visibility based on user roles. You need to define rules to control access to specific data based on user attributes or rules.
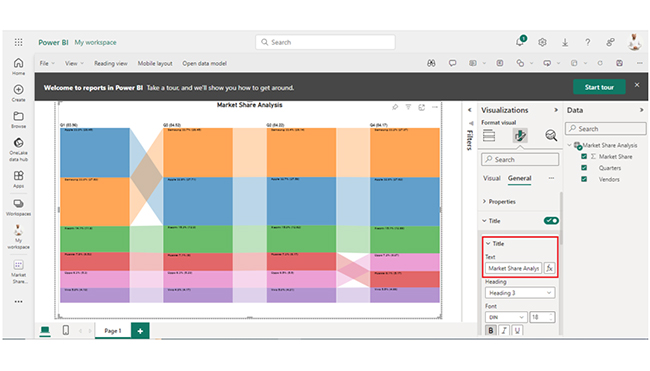
Monitor data refreshes, user activities, and usage in Power BI. Furthermore, you have to establish regular audits to ensure adherence to data governance policies and identify areas for improvement.


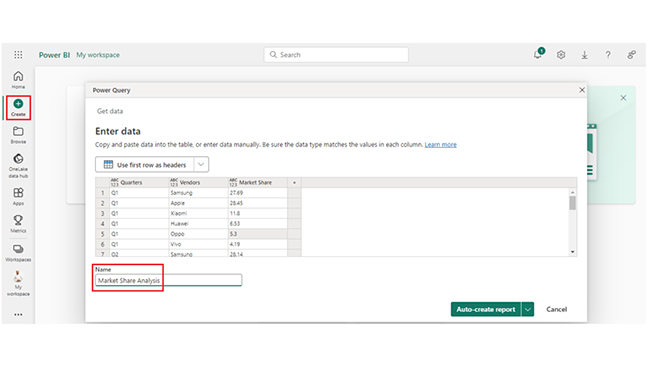
| Quarters | Vendors | Market Share |
| Q1 | Samsung | 27.69 |
| Q1 | Apple | 28.45 |
| Q1 | Xiaomi | 11.8 |
| Q1 | Huawei | 6.53 |
| Q1 | Oppo | 5.3 |
| Q1 | Vivo | 4.19 |
| Q2 | Samsung | 28.14 |
| Q2 | Apple | 27.58 |
| Q2 | Xiaomi | 12.62 |
| Q2 | Huawei | 6.17 |
| Q2 | Oppo | 5.5 |
| Q2 | Vivo | 4.21 |
| Q3 | Samsung | 28.45 |
| Q3 | Apple | 27.71 |
| Q3 | Xiaomi | 12.9 |
| Q3 | Huawei | 6 |
| Q3 | Oppo | 5.29 |
| Q3 | Vivo | 4.17 |
| Q4 | Samsung | 27.97 |
| Q4 | Apple | 27.62 |
| Q4 | Xiaomi | 12.68 |
| Q4 | Huawei | 5.17 |
| Q4 | Oppo | 6.07 |
| Q4 | Vivo | 4.66 |
Explore the importance of Data Governance with this hands-on video tutorial. This critical framework establishes policies and processes to ensure data accuracy, security, and consistency across your organization. Mastering Data Governance empowers you to maintain compliance, enhance data quality, and foster trust in your insights. With effective governance, you can unlock the full potential of your data, enabling better decision-making, improved collaboration, and long-term business success.
These are the key benefits of data governance:
Data governance fosters trust in data among stakeholders. This is done by ascertaining that data is secure, accurate, and aligned with business objectives. It also boosts confidence in the decision-making processes.
It enhances the consistency, reliability, and accuracy of data by establishing policies, standards, and processes for cleansing, validation, and maintenance.
It provides a clear understanding of data structures, sources, and relationships, and that helps in facilitating better utilization of data assets. It also enhances data accessibility and discoverability.
Data security is strengthened by implementing measures to protect sensitive information, control access, and prevent breaches or unauthorized use.
It reduces costs associated with data inefficiencies, errors, and compliance issues. Data governance also optimizes resource allocation by preventing unnecessary and redundant data activities.
It fosters trust in data among stakeholders by ensuring that data is secure, accurate, and aligned with business objectives. It also promotes confidence in decision-making processes.
Data governance ensures the security, quality, and compliance of data used for analysis. It also establishes control access, standards, and provides the framework for reliable, trustworthy insights.
Yes, Power BI is a data governance tool. Power BI brings new data governance features at all stages, and that includes data preparation and acquisition. These help in ensuring compliance with privacy regulations.
Data governance helps in ensuring the security, quality, and compliance of data used for analysis. It plays a major role in controlling access, providing a framework, and establishing standards for reliable, trustworthy insights.
Data governance ensures data security, accuracy, and compliance. It fosters trust in data, improves decision-making, mitigates risks, and aligns data practices with organizational goals.
Well-implemented data governance enhances transparency, accountability, and efficiency in data management processes. And this guide unveiled the pivotal steps needed to undertake this endeavor. It also showcased how to begin with the basics and set clear objectives.
When implementing data governance, you’ll experience challenges like a lack of standardization. That is, inconsistent data definitions across multiple departments will possibly hinder standardization and collaboration.
By following the steps outlined in this guide, you’ll become good at implementing data governance within your organization and also create more engaging and interactive visualizations.
How much did you enjoy this article?


Calculate accounts receivable turnover ratio to measure credit collection speed, improve cash flow, and strengthen your financial strategy. Read on!

Change Management KPIs are the key to tracking adoption, performance, and ROI during transitions. Find out which metrics matter. Read on!

Data collection methods and techniques determine the quality of every insight you act on. Explore key approaches for gathering reliable data. Read on!


