Categories
So, what is data lineage? Is it a trendy new DNA test for your spreadsheet?


No. Data lineage is the Sherlock Holmes of the digital world, revealing the data’s origins, transformations, and destinations.
Data lineage answers the fundamental question of “Where did this data come from?” This question lies at the heart of data governance, allowing you to trace data origins, movements, and transformations. Data lineage illustrates the journey of data from its source through various processes and systems to its destination. This transparency is invaluable for ensuring data quality, understanding data dependencies, and meeting regulatory requirements.
Moreover, data lineage empowers you to make informed decisions based on trustworthy data. Documenting the data flow enhances your analytical capabilities, mitigates risks, and streamlines compliance efforts.
In essence, understanding what is data lineage provides a foundation for leveraging data as a strategic asset.
Join us as we unravel the complexities of what is data lineage and explore its practical applications. This exploration will provide valuable insights into harnessing the power of data within your organization.
It’s time to decode the story hidden within your data’s lineage.
First…
Definition: Data lineage is the digital genealogy of data. It answers the fundamental question: where did the data originate, and where has it traveled? Think of it as a roadmap for your data’s journey. It guides you through the twists and turns of your data’s life cycle.
Without data lineage, your information is a puzzle, missing crucial pieces. Therefore, understanding what is data lineage is not just a tech-savvy luxury but a necessity in today’s data-driven era. It provides transparency, accountability, and control over data, ensuring you’re not lost in the sea of information.
Data Lineage Meaning refers to the process of tracking and visualizing the flow of data from its origin to its final destination. Understanding data lineage meaning helps ensure data accuracy, compliance, and transparency by showing how data moves, transforms, and is utilized across different systems. Organizations rely on data lineage to improve data governance and streamline decision-making.
Why do businesses willingly embrace and invest in data lineage? Let’s unravel the multifaceted reasons behind this strategic move.
| Aspect | Data Lineage | Data Provenance | Data Governance |
| Definition | The tracking and visualization of the flow and transformation of data throughout its lifecycle. | The historical record of the origin, movement, and changes made to data elements over time. | The overarching framework and set of practices ensure high data quality, compliance, and risk management. |
| Focus | Emphasizes the journey and relationships of data, highlighting its path from source to destination. | Concentrates on the historical context of data, capturing changes and activities related to its creation and modifications. | Encompasses policies, procedures, and standards to ensure data is handled consistently, securely, and ethically. |
| Purpose | Provides insights into data dependencies, helping organizations understand and manage their data assets. | Offers a detailed historical context, aiding in troubleshooting, auditing, and ensuring data credibility. | Establishes data usage, access, and management guidelines to maintain data integrity, security, and compliance. |
| Scope | Specific to the flow and transformation of data, offering a visual representation of its journey. | Focuses on the historical timeline of data, capturing its origin, changes, and movement across systems. | Encompasses a broad set of policies, procedures, and controls governing data across the organization. |
| Use Cases | Useful for impact analysis, understanding data dependencies, and ensuring data quality. | Valuable for auditing, troubleshooting, and maintaining the credibility and trustworthiness of data. | Critical for compliance with regulations, risk management, and establishing a structured approach to data handling. |
Data lineage is a choreographer orchestrating the dance of data through identification, documentation, mapping, and visualization. Let’s dive into the fascinating intricacies of this data choreography.
Understanding data lineage involves exploring an array of techniques. Each technique offers a unique approach to unraveling the intricate dance of information flow.
Manual documentation is a hands-on method where data professionals manually document data flow, Data transformations, and dependencies. While time-consuming, it allows for a detailed understanding of the data journey.
Automated discovery involves leveraging automated data lineage tools to scan and discover data sources, relationships, and transformations. This technique significantly reduces the manual effort, providing a quicker and more scalable approach.
Metadata harvesting involves extracting metadata from sources like databases and applications to build a comprehensive data elements profile. This technique ensures a rich foundation of information for the data lineage.
Data lineage tracking implements tracking mechanisms that monitor data movements in real-time. This technique is crucial for dynamic environments where data is in constant flux.
Reverse engineering unravels data lineage by working backward from the result to identify its sources and transformations. This method is particularly useful when the original lineage documentation is unavailable.
Visual Storytelling utilizes graphical models and notations to represent the relationships and data flow. This technique provides a visual abstraction, making it easier for stakeholders to comprehend complex data lineage structures.
Semantic lineage focuses on the meaning and semantics of data elements rather than just their physical attributes. This technique enhances understanding by considering the context and purpose of data.
Impact analysis examines how changes in data sources or transformations affect downstream processes. This technique is crucial for foreseeing potential consequences before implementing changes.
Data lineage visualization transforms complex information into visual representations like flow charts or diagrams. Data visualization enhances comprehension and facilitates communication of data lineage insights.
This involves employing comprehensive platforms that integrate various lineage techniques into a unified solution. These platforms often combine automated discovery, metadata harvesting, and visualization for a holistic approach.
Business lineage provides a high-level overview of how data flows between different business processes. It helps non-technical users understand data movement without getting into technical complexities, making it useful for decision-makers and compliance tracking.
Technical lineage focuses on the detailed flow of data, including transformations, dependencies, and processing logic. It is mainly used by data engineers and IT teams to troubleshoot issues, optimize data pipelines, and maintain data accuracy.
End-to-end lineage tracks the complete journey of data from its source to its final destination. It ensures transparency, data integrity, and compliance by providing a full view of how data is collected, processed, and consumed.
Operational lineage focuses on real-time data tracking and processing. It helps organizations monitor data changes, identify inefficiencies, and ensure seamless data operations by capturing live data flows and system interactions.
Banks and financial institutions use data lineage to track financial transactions, ensuring compliance with regulations like SOX and GDPR. It helps auditors verify the accuracy of financial reports by tracing data back to its source.
Hospitals and healthcare providers rely on data lineage to track patient records, ensuring accurate and secure data sharing between systems. It helps maintain data integrity and compliance with HIPAA regulations.
Online retailers use data lineage to analyze customer behavior across multiple platforms. It ensures that sales, marketing, and customer support teams work with accurate, up-to-date data for personalized recommendations and business strategies.
Organizations migrating to the cloud use data lineage to track data movement, ensuring that no information is lost or altered. It helps in verifying data integrity and improving efficiency during cloud transitions.
Banks utilize data lineage to track transactions in real-time, identifying unusual patterns that may indicate fraudulent activity. By mapping the flow of financial data, they can quickly detect and prevent fraud.
Power BI provides built-in data lineage features that help users track data sources, transformations, and dependencies within reports and dashboards. It enhances data governance and ensures transparency in analytics.
Informatica offers automated data lineage tracking, helping organizations visualize data flow across various sources. It improves compliance, governance, and data discovery.
Alation provides a user-friendly data lineage solution that integrates with multiple data sources. It allows teams to track data origins, transformations, and dependencies efficiently.
Collibra automates data lineage mapping, ensuring transparency and compliance. It visually represents how data moves and transforms across systems.
Talend provides end-to-end data lineage, allowing users to monitor data transformations and ensure quality control. It is widely used for ETL processes and data governance.
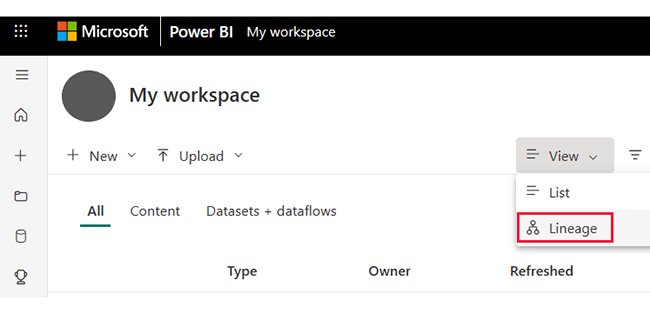
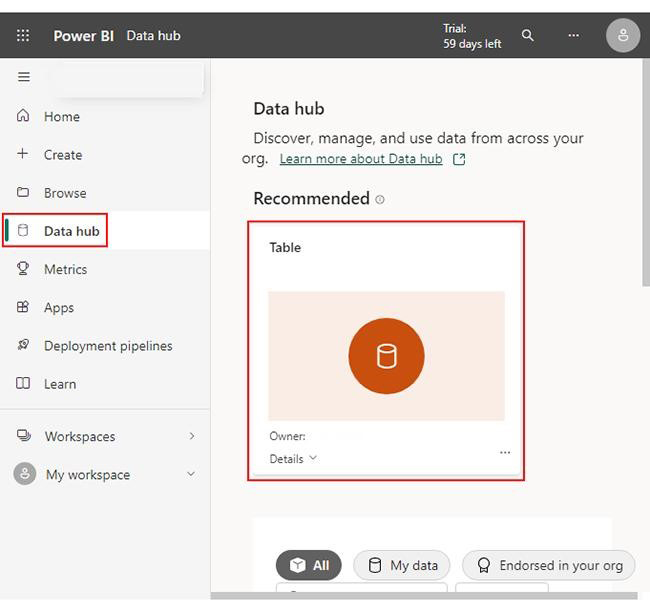
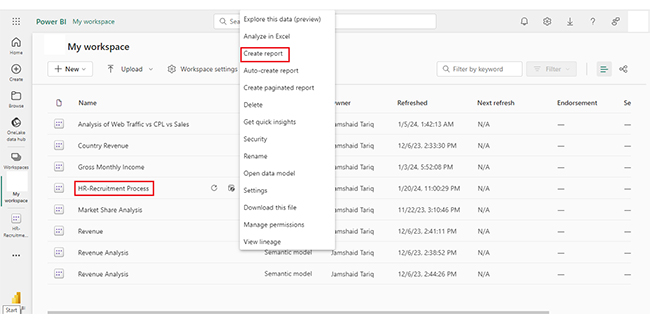
Every workspace automatically includes a lineage view, accessible with at least a Contributor role in the workspace.
To enter the lineage view, navigate to the workspace list view. Click the arrow next to View and choose Lineage.
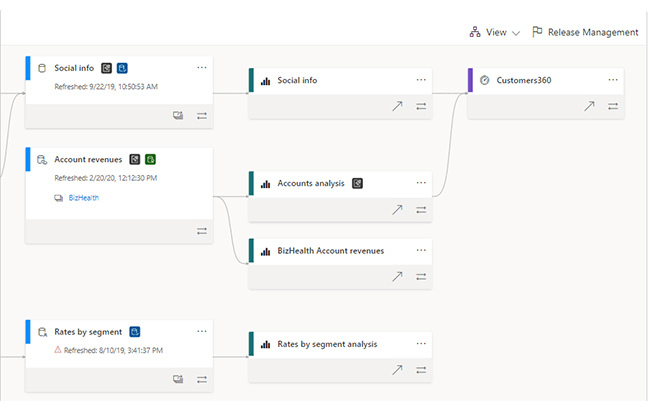
In this view, you’ll see all workspace artifacts and understand the data flow from one artifact to another.
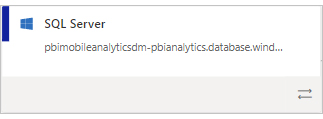
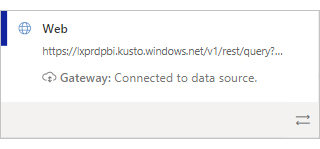
Identify the sources for semantic models and dataflows. Data source cards provide additional information, such as the database name for the Azure SQL server.
If a data source connects through an on-premises gateway, gateway details are included on the data source card. You can access additional information, such as the data gateway in the Power BI name if you have permission.
You can see the last refresh time and certification or promotion status on semantic models and dataflows.
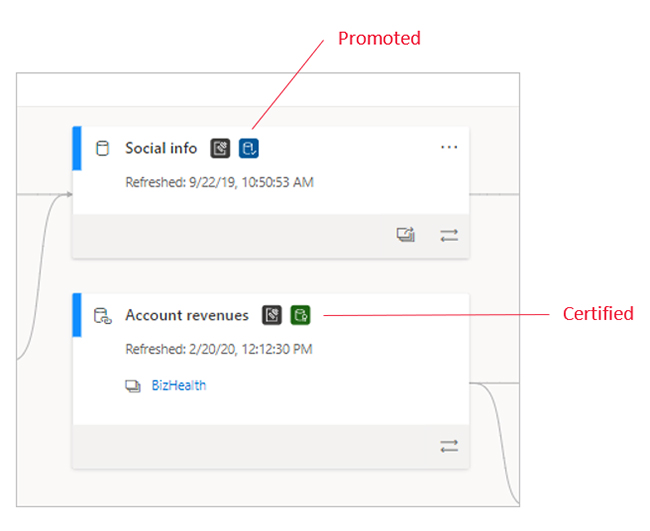
If a report within the workspace is built on a semantic model or dataflow from another workspace, the source workspace name appears on the respective card. Click the source workspace name to navigate to that workspace.
Access the options menu by selecting More options (…) for any artifact. It features all the same actions available in the list view.
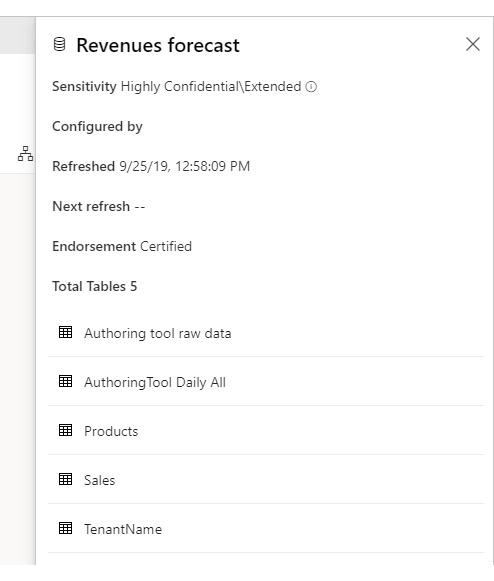
To view additional metadata for any artifact, click the artifact card. A side pane displays extra information about the selected artifact. In the image below, the side pane showcases metadata for a selected semantic model.
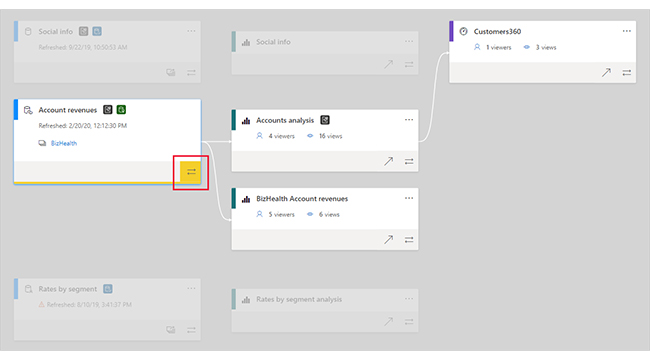
Select the double arrows under the artifact to display lineage for a specific artifact.
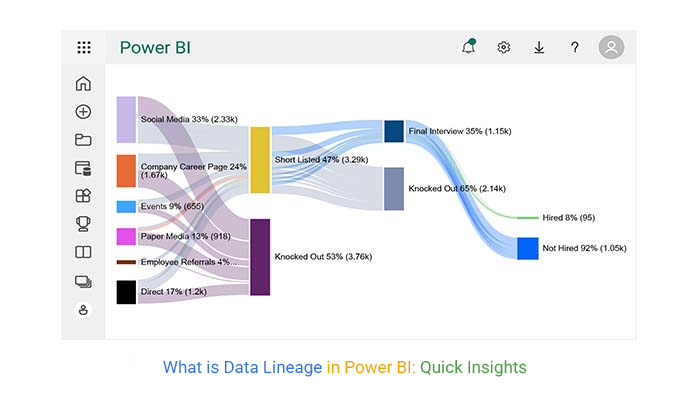
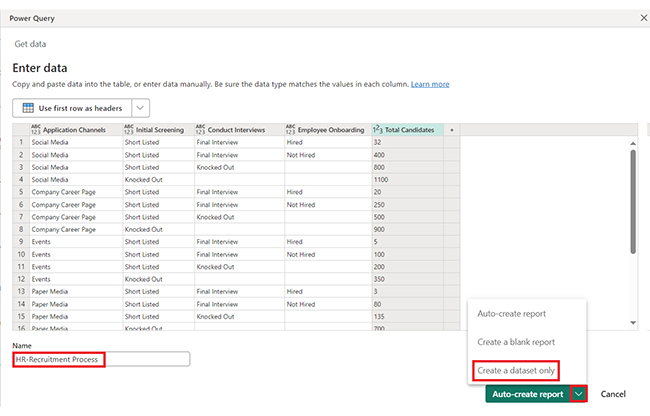
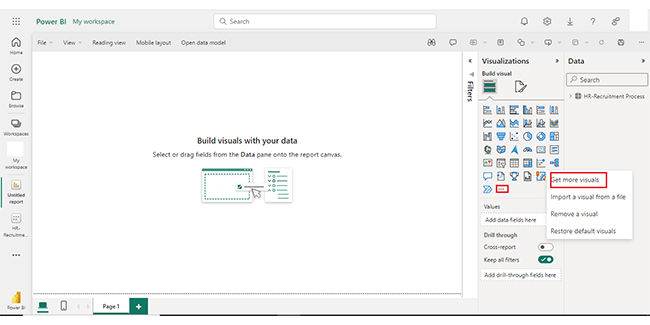
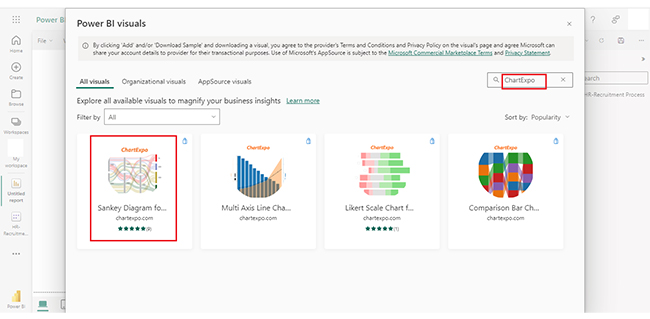
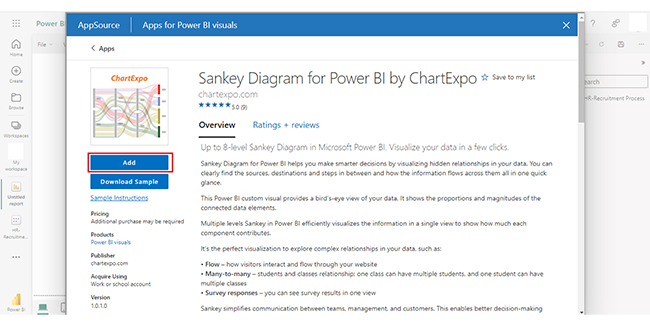
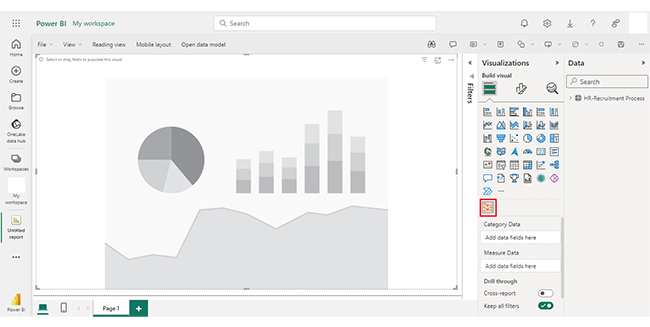
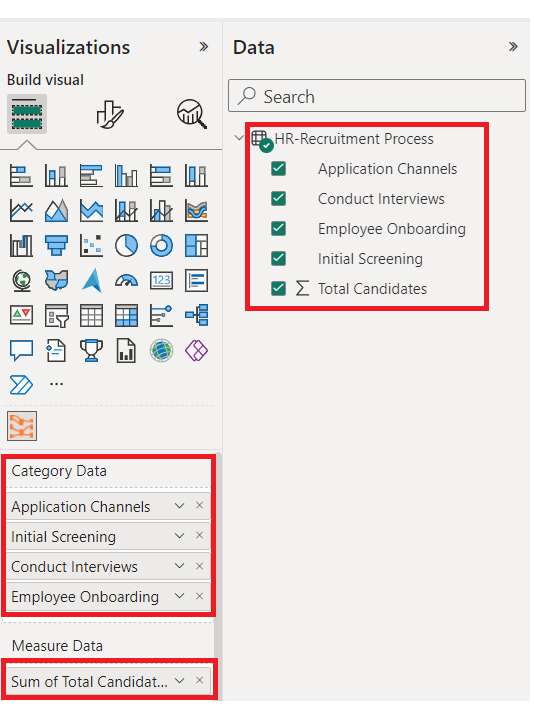
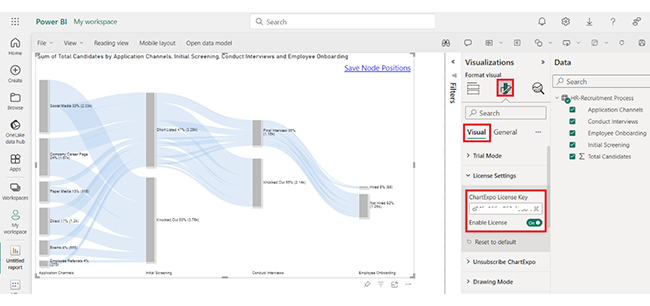
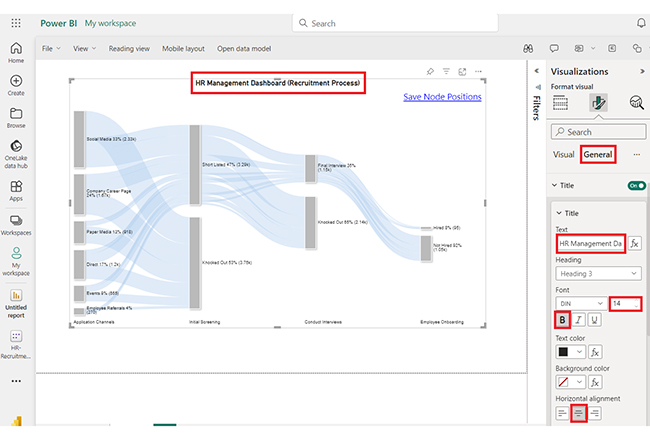
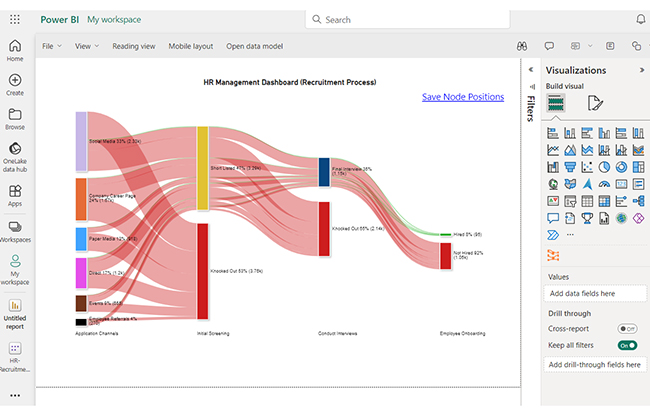
You can use the Sankey plot in Power BI to perform data lineage analysis and visually trace how data moves between sources, transformations, and reports using a Sankey diagram generator.


| Application Channels | Initial Screening | Conduct Interviews | Employee Onboarding | Total Candidates |
| Social Media | Short Listed | Final Interview | Hired | 32 |
| Social Media | Short Listed | Final Interview | Not Hired | 400 |
| Social Media | Short Listed | Knocked Out | 800 | |
| Social Media | Knocked Out | 1100 | ||
| Company Career Page | Short Listed | Final Interview | Hired | 20 |
| Company Career Page | Short Listed | Final Interview | Not Hired | 250 |
| Company Career Page | Short Listed | Knocked Out | 500 | |
| Company Career Page | Knocked Out | 900 | ||
| Events | Short Listed | Final Interview | Hired | 5 |
| Events | Short Listed | Final Interview | Not Hired | 100 |
| Events | Short Listed | Knocked Out | 200 | |
| Events | Knocked Out | 350 | ||
| Paper Media | Short Listed | Final Interview | Hired | 3 |
| Paper Media | Short Listed | Final Interview | Not Hired | 80 |
| Paper Media | Short Listed | Knocked Out | 135 | |
| Paper Media | Knocked Out | 700 | ||
| Employee Referrals | Short Listed | Final Interview | Hired | 10 |
| Employee Referrals | Short Listed | Final Interview | Not Hired | 70 |
| Employee Referrals | Short Listed | Knocked Out | 80 | |
| Employee Referrals | Knocked Out | 110 | ||
| Direct | Short Listed | Final Interview | Hired | 25 |
| Direct | Short Listed | Final Interview | Not Hired | 150 |
| Direct | Short Listed | Knocked Out | 425 | |
| Direct | Knocked Out | 600 |
Organizations deal with vast amounts of data from multiple sources, making it difficult to track data movement, transformations, and dependencies accurately.
Data lineage tools need to integrate with various databases, cloud platforms, and analytics tools, which can be challenging due to compatibility and technical constraints.
If metadata is missing or inconsistent, it becomes difficult to establish a clear lineage, leading to gaps in data tracking and governance.
Setting up a robust data lineage system requires significant investment in tools, resources, and skilled professionals, which can be a barrier for many organizations.
Data systems constantly evolve, and keeping data lineage documentation updated with changes in data sources, transformations, and workflows is an ongoing challenge.
Data lineage ensures transparency by tracking data movement, transformations, and usage, helping organizations maintain compliance with regulatory requirements.
By identifying errors and inconsistencies in data workflows, organizations can improve data accuracy and reliability for better decision-making.
Data lineage helps teams quickly trace data issues back to their sources, reducing the time required for debugging and error resolution.
With clear visibility into data origins and transformations, businesses can trust their analytics and make informed strategic decisions.
Organizations using tools like Power BI can leverage data lineage to seamlessly integrate various data sources while ensuring data consistency.
Establish the purpose of data lineage, whether for compliance, data governance, or improving data quality, to ensure alignment with business goals.
Use automated tools like Power BI to map data flow efficiently, reducing manual errors and ensuring real-time updates.
Keep metadata well-documented and up-to-date to track data transformations, sources, and dependencies accurately.
Encourage collaboration between IT, data analysts, and business teams to create a unified approach to managing data lineage.
Continuously review and update data lineage documentation to reflect changes in data sources, transformations, and workflows.
Data lineage traces the journey of data, highlighting its source, transformations, and destinations. In contrast, data flow represents the movement of data from one point to another. It illustrates the sequential steps in its transfer without necessarily capturing the full historical context.
A data lineage diagram visually depicts the path and transformations of data. It offers a clear illustration of its journey from source to destination. This provides a comprehensive and intuitive overview of data flow within a system or organization.
In ETL (Extract, Transform, Load), lineage refers to tracking and documenting the flow of data throughout the entire process. It involves understanding the origin, transformations, and destinations of data, ensuring transparency and accountability in the data integration pipeline.
Data lineage is the storyteller of the digital world, revealing the narrative of data from its origin to its application. It is the GPS guiding organizations through the labyrinth of information flow. Understanding what is data lineage unveils its role in managing the complex dance of data within systems.
Data lineage is not a mere concept; it’s a necessity in the dynamic landscape of technology. It answers the fundamental questions of where data comes from and where it goes. This transparency is the cornerstone for effective data governance, ensuring compliance, risk mitigation, and data quality assurance.
Businesses leverage data lineage for a multitude of reasons, from risk mitigation to enhanced decision-making. It is the guardian of data integrity, tracing every bit and byte’s journey and safeguarding against pitfalls. Impact analysis becomes intuitive, resource optimization becomes more strategic, and operational efficiency becomes a tangible outcome.
The techniques employed, whether manual documentation or automated discovery, contribute to the rich tapestry of data lineage implementation. Each technique brings a unique perspective, unraveling the complexity and revealing the interconnected web of data relationships.
As we conclude this exploration into what is data lineage, it’s evident that it’s more than a technical concept. It’s a strategic asset. It empowers you to navigate the data landscape with precision, unlocking the potential for informed decision-making and streamlined operations.
Follow the breadcrumbs, not the buzzwords. Dive into data lineage and unlock the secrets your data is dying to tell.
How much did you enjoy this article?


Discover diverse and high-quality Power BI report examples for inspiration and insights. Elevate your reporting with strategic visualization techniques.

A Customer Relationship Management Dashboard centralizes data, tracks key metrics, and drives smarter business decisions. Discover now!

Explore Healthcare Dashboard Examples and learn how to turn complex healthcare data into clear, actionable insights for better decision-making.


