• Home
  • Tools dropdown img
    • Spreadsheet Charts

      • ChartExpo for Google Sheets
      • ChartExpo for Microsoft Excel
    • Power BI Charts

      • Power BI Custom Visuals by ChartExpo
    • Word Cloud

  • Charts dropdown img
    • Chart Category

      • Bar Charts
      • Circle Graphs
      • Column Charts
      • Combo Charts
      • Comparison Charts
      • Line Graphs
      • PPC Charts
      • Sentiment Analysis Charts
      • Survey Charts
    • Chart Type

      • Box and Whisker Plot
      • Clustered Bar Chart
      • Clustered Column Chart
      • Comparison Bar Chart
      • Control Chart
      • CSAT Survey Bar Chart
      • CSAT Survey Chart
      • Dot Plot Chart
      • Double Bar Graph
      • Funnel Chart
      • Gauge Chart
      • Likert Scale Chart
      • Matrix Chart
      • Multi Axis Line Chart
      • Overlapping Bar Chart
      • Pareto Chart
      • Radar Chart
      • Radial Bar Chart
      • Sankey Diagram
      • Scatter Plot Chart
      • Slope Chart
      • Sunburst Chart
      • Tornado Chart
      • Waterfall Chart
      • Word Cloud
    • Google Sheets
      Microsoft Excel
  • Services
  • Pricing
  • Contact us
  • Blog
  • Support dropdown img
      • Gallery
      • Videos
      • Contact us
      • FAQs
      • Resources
    • Please feel free to contact us

      atsupport@chartexpo.com

Categories
All Data Visualizations Data Analytics Surveys
Add-ons/
  • Google Sheets
  • Microsoft Excel
  • Power BI
All Data Visualizations Data Analytics Surveys
Add-ons
  • Google Sheets
  • Microsoft Excel
  • Power BI

We use cookies

This website uses cookies to provide better user experience and user's session management.
By continuing visiting this website you consent the use of these cookies.

Ok

ChartExpo Survey


Home > Blog > Power BI

On-Premises Data Gateway in Power BI: A Complete Guide

Ah, the data gateway in Power BI.

It sounds like something out of a sci-fi movie, doesn’t it?

But, no, it’s not a gate to another dimension. Nor is it a portal to the underworld. It’s much more exciting than that. It’s the magical bridge that connects your Power BI with the promised land of data.

Data Gateway in Power BI

Like a busy bee, it buzzes back and forth between on-premises data and the cloud. It’s that reliable postman who always delivers on time, ensuring your reports and dashboards are always up-to-date. Not all heroes wear capes, you know.

So, why do we use it, you ask?

Picture this: your data is held hostage in your on-premises servers, yearning for the freedom of the cloud.

Who are you going to call?

Data gateway! This data superhero will liberate your data and make it accessible to Power BI in no time.

Brilliant, isn’t it?

So, grab your adventurer’s hat, and let’s delve into the mysterious world of the Power BI data gateway.

Table of Content:

  1. What is a Gateway?
  2. How Does a Gateway Work in Power BI?
  3. What Does a Gateway Do in Power BI?
  4. When to use Power BI gateway?
  5. Types of Power BI Gateway
  6. Requirements and Considerations
  7. How to Set Up On-Premises Data Gateway in Power BI?
    • Installing the Power BI Gateway
    • Run the Downloaded File and Install
    • Registering the Gateway
  8. Gateway Connection to The Dataset
  9. How to Use Power BI Gateway: Step-by-Step
  10. Troubleshooting of Power BI Gateway
  11. Benefits of Using an On-Premises Data Gateway in Power BI
  12. Power BI Data Gateway Best Practices
  13. Wrap Up

What is a Gateway?

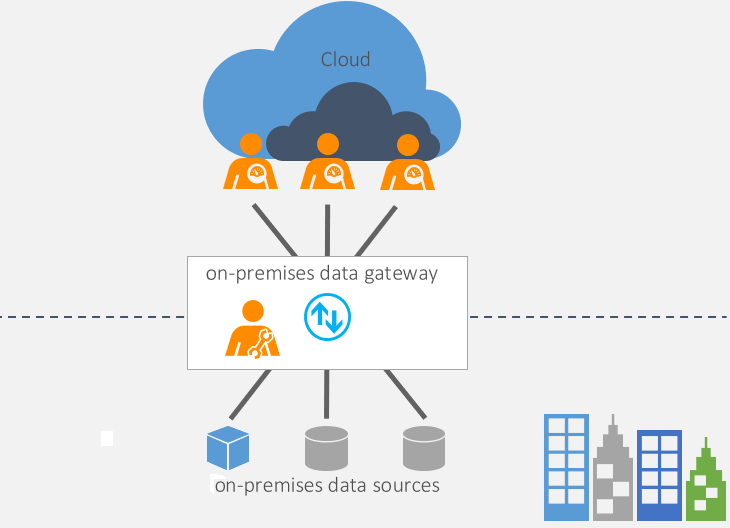
Definition: An on-premises data gateway in Power BI is like a secure bridge. It connects Power BI to data stored in various places, like on-premises servers or cloud platforms.

This allows Power BI to access, analyze, and update the data, ensuring reports and dashboards are always current. The data gateway also ensures data security by encrypting the connection and managing access to the data sources.

on premises data gateway

How Does a Gateway Work in Power BI?

Gateway Execution flow

A gateway in Power BI securely connects on-premises data sources to the Power BI service in the cloud. It retrieves data from local sources, encrypts it, and transfers it to Power BI for reporting and analysis, enabling scheduled refreshes and live queries without moving data to the cloud.

on premises data gateway 1

What Does a Gateway Do in Power BI?

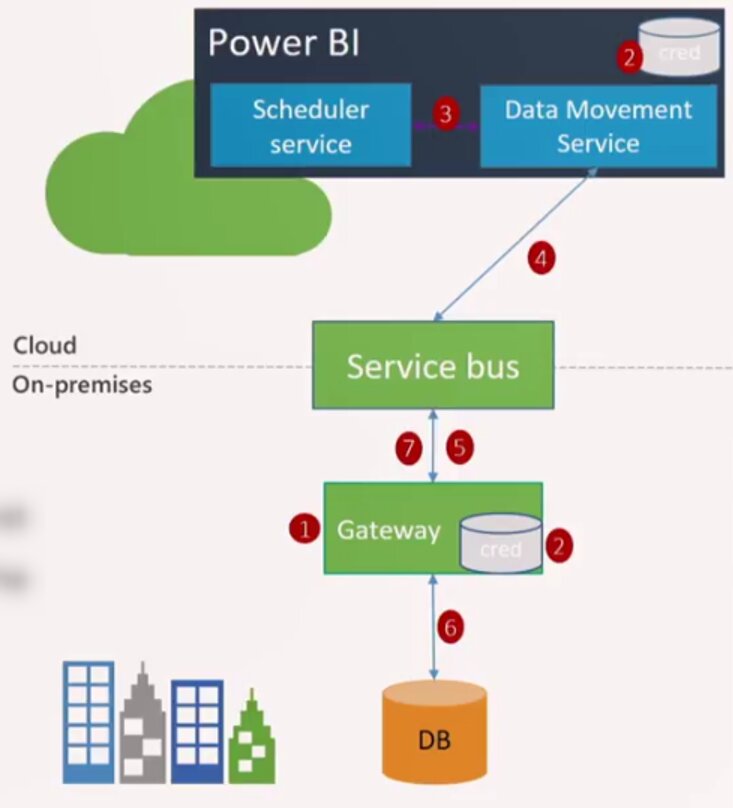
A gateway in Power BI acts as a secure bridge between on-premises data sources and the Power BI service in the cloud. It allows data from local servers to be accessed, refreshed, and used in Power BI reports and dashboards, ensuring seamless and secure data transfer.

When to use Power BI gateway?

Use a Power BI gateway when you need to connect and refresh data from on-premises sources, such as local databases or files, to your Power BI reports and dashboards in the cloud. It’s essential when your data isn’t stored in the cloud and you want to maintain secure, real-time, or scheduled access to it within Power BI.

Types of Power BI Gateway

In the context of Power BI, there are two main types of gateways: the On-Premises Data Gateway and the Power BI Gateway for Personal Use. Here’s a brief overview of each:

On-Premises Data Gateway in Power BI

  • Standard Mode: This mode allows Power BI to connect to on-premises data sources, such as databases, without exposing them directly to the internet. It supports scheduled data refreshes, live queries, and high availability.
  • Personal Mode: This mode is suitable for individual users or scenarios where there is no need for centralized administration. It allows a single user to connect Power BI to on-premises data sources from their machine.

Data Gateway in Power BI Gateway for Personal Use

This gateway is designed for individual users or small-scale scenarios where sharing and collaboration are not the primary focus. It enables a single user to refresh data from on-premises data sources for their use.

Requirements and Considerations

  1. System Requirements: Use Windows Server 2012 R2 or later, or Windows 10. Ensure the machine has adequate CPU, RAM, and storage.
  2. Network Configuration: Allow outbound connections to Power BI service URLs and ports (HTTP 80, HTTPS 443). Configure firewalls and proxies accordingly.
  3. Data Source Connectivity: Provide valid credentials and configure data sources correctly within the gateway.
  4. Performance and Security: Allocate sufficient resources and implement security practices, including regular updates and secure storage of recovery keys.
  5. High Availability: Set up gateway clusters for load balancing and redundancy.

How to Set Up On-Premises Data Gateway in Power BI?

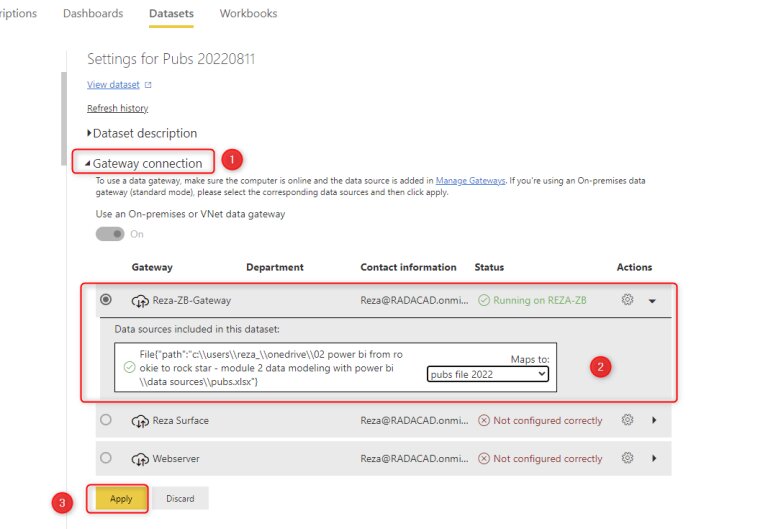
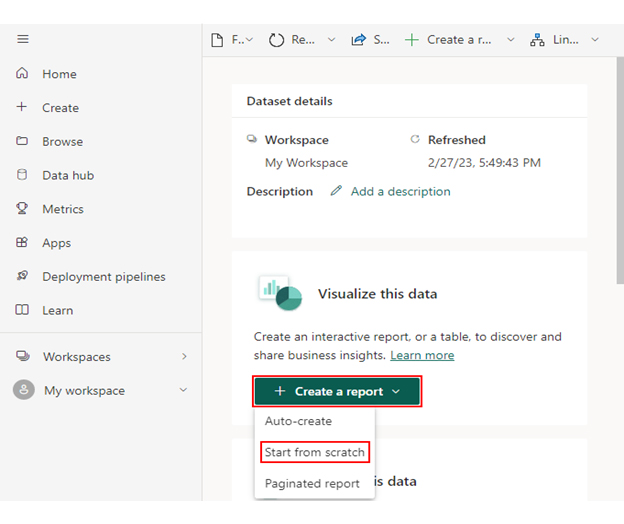
Follow these steps to set up a data gateway in Power BI:

Installing the Power BI Gateway

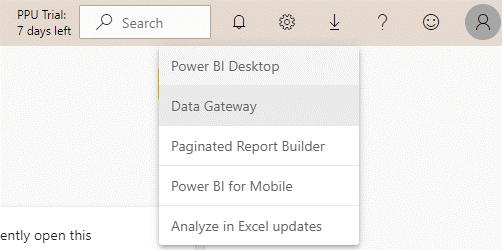
To install the Power BI Gateway, you can download it directly from the official website at this link or find the download option within the Power BI service under “Data Gateway.”

on premises data gateway 2

Run the Downloaded File and Install

Once you run the installation file, you’ll be prompted to choose the type of gateway you want to install.

on premises data gateway 3

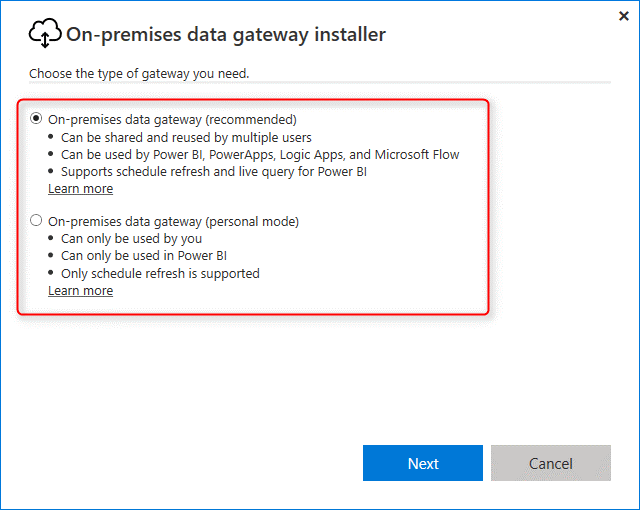
For this example, we’ll install the on-premises gateway because it supports Live and DirectQuery connections, which are crucial for real-time data access.

on premises data gateway 4

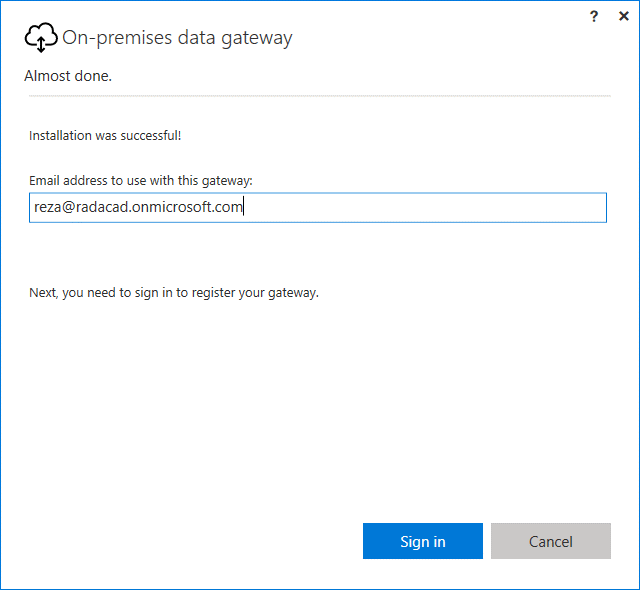
After selecting the gateway type, the installer will download the necessary files and proceed with the installation. You’ll be asked to choose a folder for the installation; for simplicity, we’ll use the default folder. The installation process is straightforward, and once completed, you’ll need to register the gateway.

Registering the Gateway

To register your gateway, log in with your Power BI account.

on premises data gateway 5

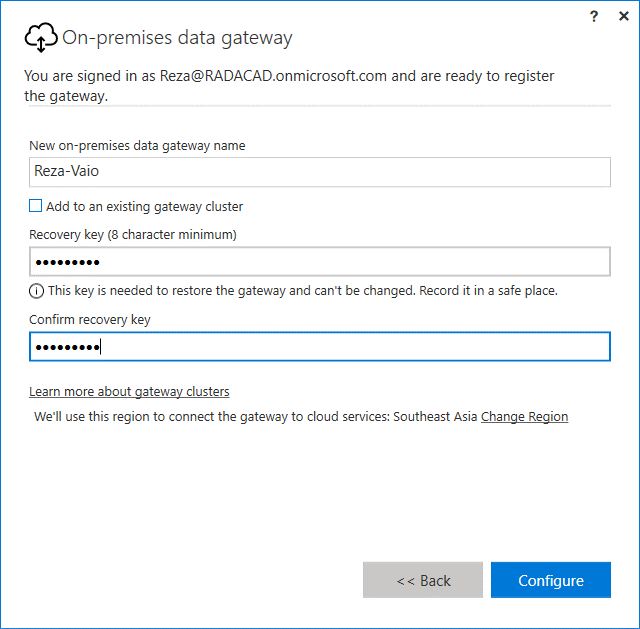
You’ll then have the option to either register a new gateway or migrate/restore an existing one. For this guide, select “Register a new gateway” and continue.

You’ll need to provide:

  • Gateway Name: Choose a name that easily identifies the gateway’s location, such as “Reza-Vaio-Gateway.”
  • Recovery Key: This key is crucial for recovering the gateway in the future. If you need to reinstall or move the gateway to another machine, keeping the recovery key secure is essential.

You also have the option to add the gateway to an existing cluster for high availability, but we’ll leave that unchecked for this example.

on premises data gateway 6

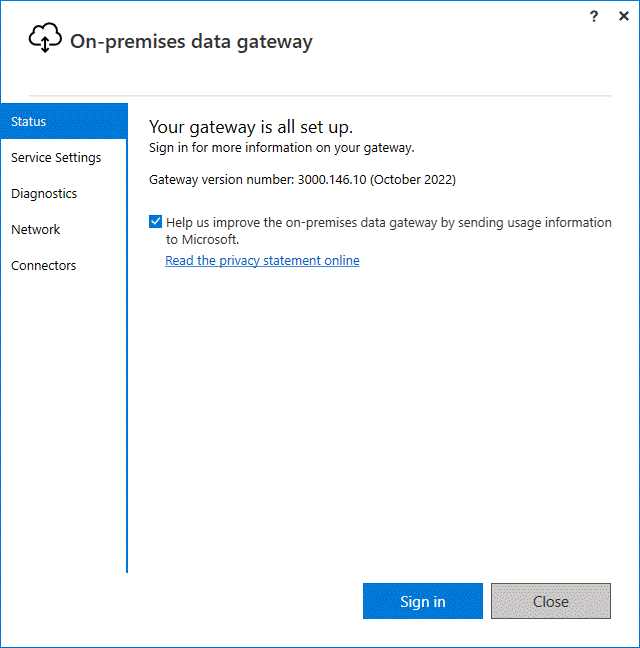
After successfully registering, you should see a confirmation that the gateway is online and ready for use.
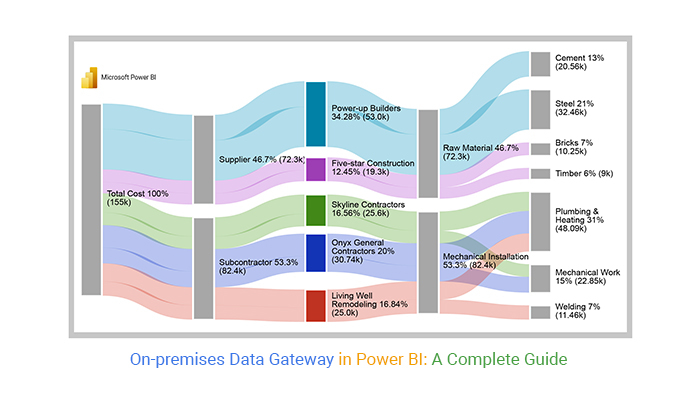
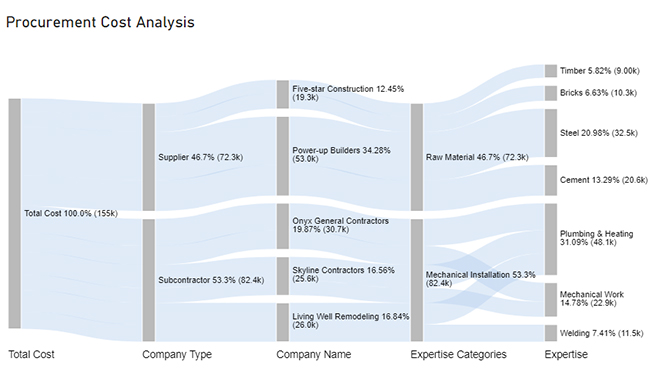
Gateway Connection to The Dataset

  • Gateway Installation: Begin by installing the Power BI Gateway on a server or machine that has access to your local data source.
  • Data Source Setup: In the Power BI service, navigate to the “Manage Gateways” section. Add your on-premises data source, input the required credentials, and configure connection settings.
  • Dataset Configuration: Open Power BI Desktop, set up your dataset to use the gateway connection, and then publish this dataset to the Power BI service.
on premises data gateway 7
  • Data Source Mapping: In the Power BI service, link the dataset to the data source you configured in the gateway. Ensure the correct data source is selected for your dataset.
  • Connection Validation: Test the setup by running a data refresh or querying the dataset to confirm that the gateway is correctly connecting to your on-premises data source.
on premises data gateway 8
Verify the dataset refresh in Power BI.

How to Use Power BI Gateway: Step-by-Step

We shall break down the process into five stages.

Stage 1: Logging in to Power BI

  • Log in to Power BI.
  • Enter your email. Click the “Submit” button.
Enter email to login to Power BI
  • You are redirected to your Microsoft account.
  • Enter your password and click “Sign in“.
Enter Password to login to Power BI
  • You can choose whether to stay signed in.
Click on stay signed in
    • Once done, the Power BI home screen will open.

Stage 2: Creating a Data Set and Selecting the Data Set to Use in Your Sankey Chart

  • Go to the left-side menu and click the “Create” button.
  • Select “Paste or manually enter data“.
select Paste or manually enter data in Power BI ce458
  • We’ll use the following cash flow data for this example.
Total Cost Company Type Company Name Expertise Categories Expertise Cost
Total Cost Subcontractor Skyline Contractors Mechanical Installation Plumbing & Heating 15456
Total Cost Subcontractor Skyline Contractors Mechanical Installation Mechanical Work 10159
Total Cost Subcontractor Onyx General Contractors Mechanical Installation Plumbing & Heating 18045
Total Cost Subcontractor Onyx General Contractors Mechanical Installation Mechanical Work 12695
Total Cost Subcontractor Living Well Remodeling Mechanical Installation Plumbing & Heating 14589
Total Cost Subcontractor Living Well Remodeling Mechanical Installation Welding 11456
Total Cost Supplier Power-up Builders Raw Material Cement 20561
Total Cost Supplier Power-up Builders Raw Material Steel 32456
Total Cost Supplier Five-star Construction Raw Material Bricks 10253
Total Cost Supplier Five-star Construction Raw Material Timber 9000
  • Paste the above data table in the Power Query Window.
  • Select the “Create a dataset only” option.
Create Dataset in Power BI ce465
  • On the left-side menu, click “Data Hub“.
  • Power BI populates the data set list. (If you have not created a data set, refer to the Error! Reference source not found section).
Click on Data Hub ce458
  • Choose a data set for the Sankey chart.
  • PBI populates the screen as shown below:
Workspace in Power BI ce465
  • Click on the “Create a report” dropdown.
  • Select “Start from scratch“.
Create Report and start from scratch ce458
  • A Report Canvas screen appears as below:
Report Canvas screen in Power BI ce465

Stage 3: Adding the Power BI Sankey Diagram Extension by ChartExpo

  • Creating the Sankey Diagram requires us to use an add-in or Power BI visual from AppSource.
  • Navigate to the right side of the Power BI dashboard.
  • Open the Power BI Visualizations panel.
  • Click the ellipsis symbol (…) as highlighted in the diagram below. This will import the Power BI Sankey Diagram extension by ChartExpo.
click on to get more visuals ce465
  • The following menu opens:
  • Select the “Get more visuals” option.
get more visuals in Power BI ce465
  • The following window opens.
  • Enter “Sankey Diagram for Power BI by ChartExpo” in the highlighted search box.
  • You should see the “Sankey Diagram for Power BI by ChartExpo”, as shown in the image below..
Sankey Diagram for Power BI by ChartExpo
  • Click the highlighted “Add” button.
Click the Add button
  • Power BI will add the “Sankey Diagram for Power BI by ChartExpo” in the visualization panel.
Click on Sankey Diagram Icon

Stage 4: Drawing a Sankey Diagram with ChartExpo’s Power BI extension

  • Select the “Sankey Diagram for Power BI by ChartExpo” icon in the visualization panel.
  • The following window opens in the report section of your dashboard:
Report Section in Dashboard ce465
  • You can resize the visual as needed.
  • Navigate to the right side of your Power BI dashboard.
  • You should see “Fields” next to “Visualizations“.
Fields next to visualizations ce465
  • You’ll select the fields to use in your Sankey chart here.
  • The ChartExpo visual needs to be selected, though. Select the field in the following sequence:
    • Total Cost
    • Company Type
    • Company Name
    • Expertise Categories
    • Expertise
    • Cost
Select fields for Sankey diagram ce465
  • You’ll be asked for a ChartExpo license key or email address.
enter email for ChartExpo license ce430

Stage 5: Activate your ChartExpo Trial or Apply a Subscription Key

  • Select the ChartExpo visual.
  • You should see three icons below “Build Visual” in the Visualizations panel.
Build visual panel in Power BI
  • Select the middle icon, “Format visual“.
  • The visual properties will be populated as shown below.
visual properties in Power BI
  • If you are a new user,
    • Type in your email under the section titled “Trial Mode”.
    • This should be the email address that you used to subscribe to the ChartExpo add-in. It is where your ChartExpo license key will be sent.
    • Ensure that your email address is valid.
    • Click “Enable Trial.” You’ll get a 7-day trial.
enter email id
  • You should receive a welcome email from ChartExpo.
  • If you do not find the email in your inbox, kindly check your spam folder.
  • The Sankey Diagram you create under the 7-day trial contains the ChartExpo watermark.
Data Gateway in Power BI 1
  • If you have obtained a license key:
    • Enter your license key in the “ChartExpo License Key” textbox in the “License Settings” section (see below).
    • Slide the toggle switch next to “Enable License” to “On“.
enter license key
  • To add colors, expand the “Level Colors” properties and select a color.
  • Do this to change the color of each node.
  • All changes are automatically saved.
Data Gateway in Power BI 2
  • Let’s add the Prefix (e.g., $ sign) to the chart’s numeric values.
  • Expand the “Stats” properties. Add the Prefix value (e.g., $ sign).
Add Prefix Value ce465
  • Let’s add colors to each node. Expand the “Level Colors” properties and select the colors.
Coloring Sankey Diagram ce465
  • Automatically, all changes will be saved.
Final-Data Gateway in Power BI

Insights

  • The procurement cost at Level 1 amounts to $155K.
  • At Level 2, of the total cost of $155K, $72.3K (46.7%) was allocated to the supplier, while $82.4K (53.3%) was spent on subcontractors.
  • Moving to Level 3, the $72.3K supplier cost was divided between two companies: Power-up Builder and Five-star Construction, charging $53.0K and $19.3K, respectively.
  • The subcontractor cost of $82.4K was distributed among three companies: Skyline Contractors, Onyx General Contractors, and Living Well Remodeling. They charged $25.6K, $30.7K, and $26.0K, respectively, for their services.
  • At Level 4, the supplier companies provided raw materials for procurement, totaling $72.3K. The companies specializing in Mechanical Installations accounted for approximately $82.4K.
  • Among the $72.3K raw material cost, cement, steel, bricks, and timber accounted for $20.6K, $32.5K, $10.3K, and $9K, respectively.
  • From the $82.4K mechanical installation cost, Plumbing Heating, Mechanical Work, and Welding accounted for $48.1K, $22.9K, and $11.5K, respectively.

Troubleshooting of Power BI Gateway

  • Check Gateway Status: Ensure the gateway is online. You can verify this in the Power BI service under “Manage Gateways.” If it’s offline, restart the gateway service on the host machine.
  • Network Connectivity: Confirm that the gateway can access both the on-premises data source and the Power BI cloud service. Check for firewall or proxy settings that might be blocking connections.
  • Update the Gateway: Make sure you’re using the latest version of the gateway. Outdated software can cause compatibility issues.
  • Review Logs: Logs can be accessed from the gateway installation directory and provide detailed information on what might be causing the problem.
  • Resource Utilization: Check the machine hosting the gateway for high CPU or memory usage, which could affect performance. Consider upgrading hardware or balancing the load by adding more gateways to a cluster.
  • Reconfiguration: If configuration settings have changed, you may need to reconfigure the gateway, including updating data source credentials or network settings.
  • Recovery Key Issues: If you encounter issues with the recovery key, ensure you have it stored securely. Without it, recovering or moving the gateway can be difficult.

Benefits of Using an On-Premises Data Gateway in Power BI

Using a data gateway in Power BI offers a plethora of benefits:

  • Data accessibility: With a data gateway for Power BI, you can summon data from anywhere. On-premises, cloud, you name it, and it’s at your fingertips.
  • Real-time data: No more waiting for yesterday’s news. The Power BI data gateway serves up real-time data faster than a barista whips up a latte.
  • Data security: Your data gets the royal treatment. It’s wrapped in layers of encryption and access control, ensuring it doesn’t fall into the wrong hands.
  • Data scalability: Think of the data gateway as the elastic waistband, accommodating your expanding data empire. As your data grows, it grows with it.
  • Reduced latency: Forget the buffering wheel of frustration. The Power BI gateway slashes waiting times, so your reports load faster than a hot knife through butter.
  • Scheduled data refresh: Automation is the name of the game. Set schedules and your data gets a spa day, refreshing itself without bothering you.
  • Hybrid cloud solutions: The data gateway bridges the gap between on-premises and cloud data, supporting a seamless integration of hybrid solutions.
  • Ease of use: It’s not just for the IT wizards. Anyone can wield the power of the data gateway with its user-friendly setup and management.
  • Cost-efficiency: Centralized data management means fewer data duplicates and less resource wastage.
  • Enhanced collaboration: It’s the ultimate team player, allowing multiple folks to work on the same data. As a result, it promotes collaboration and smarter decision-making.

Power BI Data Gateway Best Practices

  1. Deployment: Install the gateway on a dedicated, high-performance machine close to your data sources. Avoid using a personal computer or a virtual machine with limited resources.
  2. Redundancy: Set up multiple gateways in a cluster for load balancing and failover. This ensures continuous availability even if one gateway fails.
  3. Security: Use strong passwords and encrypt credentials within the gateway. Limit access to the gateway configuration to authorized personnel only.
  4. Updates: Regularly update the gateway software to the latest version. This ensures compatibility with Power BI updates and includes performance improvements and security patches.
  5. Monitoring: Keep an eye on gateway performance using the monitoring tools in Power BI. This helps identify and resolve issues like high CPU usage or slow query performance.

FAQs

What is a data gateway in Power BI?

A data gateway in Power BI is a bridge connecting Power BI to on-premises or cloud-based data sources. It facilitates secure data retrieval, refresh, and sharing, ensuring up-to-date and accessible reports and dashboards.

What are the types of gateways in Power BI?

Power BI offers two types of gateways:

  1. On-Premises Data Gateway: Connects to on-premises data sources securely, enabling data access and refresh from within your organization’s network.
  2. Power BI Gateway (Personal Mode): Designed for individual use, it allows limited data access and refresh within your personal space.

How do I create a gateway in Power BI?

To create a gateway in Power BI:

  1. Download the Power BI Gateway installer.
  2. Run the installer.
  3. Configure the gateway using Power BI credentials.
  4. Add data sources and configure settings.
  5. Define data source permissions for users.
  6. Your gateway is ready for use.

Wrap Up

Using a data gateway in Power BI is not a mere technicality; it’s a strategic imperative. It’s the bridge that connects your data dots, making the entire data landscape accessible and actionable.

The data gateway in Power BI is the ticket to a seamless data-driven journey. It grants you access to data spread across domains, on-premises, or in the cloud. Real-time data becomes more than a dream. It turns into a reality, empowering you with insights that can change the game.

Security, the crown jewel of data, remains intact with the data gateway. The gateway encrypts and guards the data channels. Furthermore, scalability ensures that, as your data universe expands, the gateway grows with it, no sweat.

Reduced latency ensures your data responses are as swift as thought, while scheduled refreshes bring automation into play. Hybrid cloud solutions unite the best of both worlds – a modern-day diplomatic marvel.

What’s even more beautiful? It’s easy to use, making data accessible to the non-tech-savvy. And lastly, enhanced collaboration fosters teamwork and informed decision-making.

Do not hesitate.

Embrace the Power BI gateway and ChartExpo today to unlock the full potential of your data.

How much did you enjoy this article?

PBIAd1
Start Free Trial!
130806

Related articles

next previous
Power BI12 min read

How to Create Sankey Diagram in Microsoft Power BI?

Learn How to Create Sankey Diagram in Microsoft Power BI using Desktop & Web Service. What they are and how to use them effectively.

Power BI8 min read

Power BI Artificial Intelligence: Insights Using Visuals

Discover all there is to know about the Power BI artificial intelligence. You'll also discover how AI is used in Power BI, and how to use it for analysis and more.

Power BI9 min read

Budgeting in Healthcare: Use Visuals to Spot Budget Gaps

This guide helps you discover what budgeting in healthcare is. You'll also discover the factors that affect hospital budgets and types of budgeting in healthcare.

Power BI9 min read

Predictive Analytics in Power BI for Making Insightful Visuals

This guide shows you everything you need to know about Predictive Analytics in Power BI. It also shows you how it works, and how to interpret the results.

Power BI8 min read

Quarterly Business Review Template for Optimum Reports

Discover what the quarterly business review template is. This guide also shows you the best practices to consider when using the QBR template.

ChartExpo logo

Turn Data into Visual
Stories

CHARTEXPO

  • Home
  • Gallery
  • Videos
  • Services
  • Pricing
  • Contact us
  • FAQs
  • Privacy policy
  • Terms of Service
  • Sitemap

TOOLS

  • ChartExpo for Google Sheets
  • ChartExpo for Microsoft Excel
  • Power BI Custom Visuals by ChartExpo
  • Word Cloud

CATEGORIES

  • Bar Charts
  • Circle Graphs
  • Column Charts
  • Combo Charts
  • Comparison Charts
  • Line Graphs
  • PPC Charts
  • Sentiment Analysis Charts
  • Survey Charts

TOP CHARTS

  • Sankey Diagram
  • Likert Scale Chart
  • Comparison Bar Chart
  • Pareto Chart
  • Funnel Chart
  • Gauge Chart
  • Radar Chart
  • Radial Bar Chart
  • Sunburst Chart
  • see more
  • Scatter Plot Chart
  • CSAT Survey Bar Chart
  • CSAT Survey Chart
  • Dot Plot Chart
  • Double Bar Graph
  • Matrix Chart
  • Multi Axis Line Chart
  • Overlapping Bar Chart
  • Control Chart
  • Slope Chart
  • Clustered Bar Chart
  • Clustered Column Chart
  • Box and Whisker Plot
  • Tornado Chart
  • Waterfall Chart
  • Word Cloud
  • see less

RESOURCES

  • Blog
  • Resources
  • YouTube
SIGN UP FOR UPDATES

We wouldn't dream of spamming you or selling your info.

© 2025 ChartExpo, all rights reserved.