• Home
  • Tools dropdown img
    • Spreadsheet Charts

      • ChartExpo for Google Sheets
      • ChartExpo for Microsoft Excel
    • Power BI Charts

      • Power BI Custom Visuals by ChartExpo
    • Word Cloud

  • Charts dropdown img
    • Chart Category

      • Bar Charts
      • Circle Graphs
      • Column Charts
      • Combo Charts
      • Comparison Charts
      • Line Graphs
      • PPC Charts
      • Sentiment Analysis Charts
      • Survey Charts
    • Chart Type

      • Box and Whisker Plot
      • Clustered Bar Chart
      • Clustered Column Chart
      • Comparison Bar Chart
      • Control Chart
      • CSAT Score Bar Chart
      • CSAT Score Survey Chart
      • Dot Plot Chart
      • Double Bar Graph
      • Funnel Chart
      • Gauge Chart
      • Likert Scale Chart
      • Matrix Chart
      • Multi Axis Line Chart
      • Overlapping Bar Chart
      • Pareto Chart
      • Radar Chart
      • Radial Bar Chart
      • Sankey Diagram
      • Scatter Plot Chart
      • Slope Chart
      • Sunburst Chart
      • Tornado Chart
      • Waterfall Chart
      • Word Cloud
    • Google Sheets
      Microsoft Excel
  • Services
  • Pricing
  • Blog
  • Support dropdown img
      • Gallery
      • Videos
      • Contact Us
      • FAQs
      • Resources
    • Accessible Support

      for Your Journey

Categories
All Data Visualizations Data Analytics Data Stories
Add-ons
  • Google Sheets
  • Microsoft Excel
  • Power BI
All Data Visualizations Data Analytics
Data Stories
  • Healthcare
Add-ons
  • Google Sheets
  • Microsoft Excel
  • Power BI

We use cookies

This website uses cookies to provide better user experience and user's session management.
By continuing visiting this website you consent the use of these cookies.

Ok

ChartExpo Survey


Home > Blog > Data Visualization > Add-ons > Power BI >

Power BI Dashboard vs. Report – What’s the Difference?

Whether to work with a (Power BI) PBI report or dashboard can be a dilemma. You do not want to get your audience absolutely overwhelmed with details and bored. On the other hand, you do not want to gloss over important details.

Power BI dashboard vs report

Both PBI reports and dashboards have similar features and also serve the same purpose. The two are used for data visualization and analysis. Moreover, you can use the same visualizations on the pair.

PBI reports are usually used to present detailed analyses. They showcase in-depth insights for your audience.

PBI dashboards, on the other hand, come in handy when monitoring and tracking key metrics. They exhibit a high-level overview for your audience.

So, which one should you choose? Your audience, main objective, and type of data should be your main guides.

In this article, we look at the Power BI dashboard vs. the report. We also define each of them. Eventually, we’ll learn how to create a report and dashboard in PBI. We conclude by answering some FAQs. Let’s dive right in.

Table of Content:

  1. What is a Dashboard in Power BI?
  2. What is a Report in Power BI?
  3. Power BI Dashboard vs. Report: Key Differences
  4. How to Create a Report in Power BI?
  5. How to Create a Dashboard in Power BI?
  6. Wrap Up

What is a Dashboard in Power BI?

A Power BI dashboard is a visual presentation of key performance indicators (KPIs). It provides a high-level overview of the data at a glance.

Dashboards are useful when you want to monitor and track key metrics. They are used to present data to executives and other decision-makers. They are summaries of important information.

With PBI dashboards, you can consolidate data from various sources. You can also monitor your KPIs in real-time. This helps you quickly identify areas that need attention or improvement.

What is the Purpose of Using Power BI Dashboards?

The purpose of using PBI dashboards is to provide a high-level overview of KPIs and data insights.

You can also use PBI dashboards to show real-time insights into business operations, performance, and trends.

What are the Key Features of a Power BI Dashboard?

The key features of a Power BI dashboard include:

  • Tiles

Tiles are the building blocks of a dashboard. They display data visualizations, such as charts, tables, and maps.

  • Real-time data

Dashboards display data in real-time. This allows users to monitor performance and KPIs as they change.

  • Customizable layouts

You can customize the layout, theme, and style of the dashboard to match your branding.

What is a Report in Power BI?

Compared to a PBI dashboard, a PBI report is more detailed. It provides a more granular view of data. Your audience can focus on specific details and explore the data in greater depth.

Reports help present detailed information and analysis to your audience. They are dynamic and are updated based on underlying data changes.

What is the Purpose of Using Power BI Reports?

Power BI reports are mainly used to garner insights.

Let’s look at an example. A team can use a PBI report to garner insights from disparate data sets.

To do this, they will need to use Power BI to:

  • Transform, clean, and connect disparate data sets,
  • Create a data model.
  • Create data visualizations for the data like charts and graphs.
  • Create a PBI report, and add the data visualizations.

What are the Key Features of a Power BI Report?

In this section, we look at the PBI report’s key features.

  • Templates

Power BI report templates are pre-designed, customizable layouts. You can use them for your Power BI report design.

You can create your own custom template from scratch if you already have Power BI report ideas.

Templates include:

    • pre-configured visuals.
    • page layouts.
    • themes.

You can also add other elements during report template creation. For example, query definitions, data model definitions, visuals, pages, and other visual components.

  • Data Filtering

PBI reports also support data filtering. This enables you to only show what’s important.

  • Publishing to the Web

You can directly publish reports on the web. PBI also lets you edit, refresh, and update published visuals on the web.

Power BI Dashboard vs. Report: Key Differences

In this section, we further explore the Power BI dashboard vs. report and the key differences.

  • The Number of Pages

In Power BI, a dashboard typically consists of a single page. This helps display the most important and relevant information to your audience.

Too many pages or too much information can overwhelm your viewers and make it harder to focus on the key insights you want to communicate.

A report, contrastingly, can have multiple pages or tabs. The number of pages depends on the complexity and depth of the data being analyzed.

The level of detail required by the users also contributes to report length.

The pages are organized logically and intuitively.

  • Information Detail

PBI reports generally provide more detailed information than PBI dashboards. Dashboards showcase a high-level view of data. Reports provide more in-depth analysis of specific data sets.

  • Data modeling

Both PBI dashboards and reports allow for data modeling. There are, however, differences in the interactivity and complexity of the visualizations.

Data modeling involves creating relationships between data tables, defining calculations, creating hierarchies, and grouping data for analysis.

In a PBI dashboard, the data model is typically simpler, with fewer tables and relationships.

The data model in a PBI report is more complex, with more tables and relationships.

Reports also offer greater flexibility in terms of data modeling and calculations. Users can create complex calculations and measures using Power BI’s DAX language. This option is not available on PBI dashboards.

  • User interactivity

PBI dashboards usually have more user interactivity than reports. They often include interactive elements such as slicers and filters.

In contrast, reports are more static. They present a summary of data in a tabular or graphical format.

Reports may include some level of interactivity, such as filtering or sorting options. They are, however, not as interactive as dashboards.

How to Create a Report in Power BI?

The Power BI dashboard vs. report differences will get even clearer with Power BI report examples.

In this section, we use an add-in or Power BI visual from AppSource to create our report. This add-in is the Sankey Diagram by ChartExpo.

We’ll divide the steps into several stages.

Stage 1: Logging in to Power BI

  • Login to Power BI Web Service.
  • Enter your email address and click the “Submit” button.
submit button
  • You will be redirected to your Microsoft account.
  • Enter your password and click “Sign in”.
enter password to Power BI
  • You can choose to stay signed in or not.
Login to Power BI
  • You’ll then be redirected to the Power BI home screen.

Stage 2: Adding a data set for your report

  • Click on the “Create” button.
  • Click on “these options”.
Create a dataset only
  • Click on “Excel”.
  • Add an Excel file.
enter data
  • We’ll use the following two data sets to create our report.

First data set

Earnings Source Revenue Expenses Departments Categories Amount
Providing services Revenue Expenses Managerial Training Sessions 10000
Providing services Revenue Expenses Managerial Office rental 16000
Providing services Revenue Expenses Managerial Wages 9400
Providing services Revenue Expenses Commercial Wages 11300
Sales of products Revenue Expenses Commercial Travel allowance 10000
Sales of products Revenue Expenses Commercial Advertising 12000
Sales of products Revenue Expenses Production Material Payment 25000
Sales of products Revenue Expenses Production Loan Payment 8500
Sales of products Revenue Expenses Production Wages 19500
Loans Revenue Gross Profit Taxes 11000
Loans Revenue Gross Profit Net Profit 13000

Second data set

Starting Point Platforms View product & details Add to Cart Cart Status Ending Point Traffic
External Ad Mobile App View product & details Add to Cart Clear Cart Exit 20177
External Ad Mobile App View product & details Add to Cart Checkout Purchase 26674
External Ad Mobile App View product & details Add to Cart Click on another product Purchase 11616
External Ad Mobile App View product & details Exit 21965
External Link Mobile App View product & details Add to Cart Clear Cart Exit 24979
External Link Mobile App View product & details Add to Cart Checkout Purchase 6684
External Link Mobile App View product & details Add to Cart Click on another product Purchase 12829
External Link Mobile App View product & details Exit 27434
Direct Search Mobile App View product & details Add to Cart Clear Cart Exit 11281
Direct Search Mobile App View product & details Add to Cart Checkout Purchase 8102
Direct Search Mobile App View product & details Add to Cart Click on another product Purchase 22124
Direct Search Mobile App View product & details Exit 6305
Organic Search Mobile App View product & details Add to Cart Clear Cart Exit 11376
Organic Search Mobile App View product & details Add to Cart Checkout Purchase 12751
Organic Search Mobile App View product & details Add to Cart Click on another product Purchase 25429
Organic Search Mobile App View product & details Exit 7034
External Ad Official Website View product & details Add to Cart Clear Cart Exit 13854
External Ad Official Website View product & details Add to Cart Checkout Purchase 6357
External Ad Official Website View product & details Add to Cart Click on another product Purchase 20156
External Ad Official Website View product & details Exit 25474
External Link Official Website View product & details Add to Cart Clear Cart Exit 17788
External Link Official Website View product & details Add to Cart Checkout Purchase 9670
External Link Official Website View product & details Add to Cart Click on another product Purchase 13131
External Link Official Website View product & details Exit 11169
Direct Search Official Website View product & details Add to Cart Clear Cart Exit 5747
Direct Search Official Website View product & details Add to Cart Checkout Purchase 11817
Direct Search Official Website View product & details Add to Cart Click on another product Purchase 26562
Direct Search Official Website View product & details Exit 8389
Organic Search Official Website View product & details Add to Cart Clear Cart Exit 28670
Organic Search Official Website View product & details Add to Cart Checkout Purchase 11015
Organic Search Official Website View product & details Add to Cart Click on another product Purchase 18522
Organic Search Official Website View product & details Exit 8023
  • Click on the “Data Hub” option on the left-side menu.
  • Power BI populates the data sets list. (If you have not created a data set refer to the Error! Reference source not found section).
Data Hub
  • Once you choose the data set you want to use to create your Sankey Diagram, Power BI populates the screen as shown below.
  • The data set and its fields are shown on the right side. The middle area shows report and data set options.
  • Click on the “Create a report” dropdown.
  • Select “Start from scratch”.
create report in power bi
  • You should see the Report Canvas screen as shown below:
Report Canvas

Stage 3: Adding the Power BI Sankey Diagram Extension by ChartExpo

  • To finish creating our Sankey Diagram, we’ll use an add-in or Power BI visual from AppSource.
  • Navigate to the Power BI Visualizations panel. It’s on the right side of your Power BI dashboard.
  • Click the ellipsis (…) highlighted above to import the Power BI Sankey Diagram extension by ChartExpo.
Power BI visual from
  • The following menu opens:
  • Select the “Get more visuals” option.
Get more visuals
  • The following window opens.
  • Enter “Sankey Diagram for Power BI by ChartExpo” in the highlighted search box.
  • You should see the “Sankey Diagram for Power BI by ChartExpo” as shown in the image below.
Sankey Diagram for Power BI by ChartExpo
  • Click the highlighted “Add” button.
create Sankey Diagram for Power BI by ChartExpo
  • Power BI will add the “Sankey Diagram for Power BI by ChartExpo” in the visualization panel as shown below.
icon in the visualization panel

Stage 4: Drawing a Sankey Diagram with ChartExpo’s Power BI extension

    • Select the “Sankey Diagram for Power BI by ChartExpo” icon in the visualization panel. The following window opens on the report section of your dashboard:
select fields
  • You can resize the visual as needed.
  • Navigate to the right side of your Power BI dashboard. You should see the “Fields” next to “Visualizations”.
  • You’ll select the fields to use in your Sankey Chart here. The ChartExpo visual needs to be selected though.
select fields
  • You’ll be asked for a ChartExpo license key or email address.
ChartExpo license key

Stage 5: Activating your ChartExpo Trial or Applying a Subscription Key

  • While the ChartExpo visual is selected, you should see 3 icons below “Build visual” in the Visualizations panel.
Build visual
  • Select the middle icon, “Format visual”. The visual properties will be populated as shown below.
format visual
  • If you are a new user:
    • Enter your email address in the “Email” textbox in the “Trial Mode” section. When you subscribe to the ChartExpo add-in, this is the email address where your ChartExpo License key will be sent.
    • Ensure that your email address is valid.
    • Click “Enable Trial” to activate your 7-day trial.
Enable Trial
  • You should receive a welcome email from ChartExpo.
  • The Sankey Diagram you create under the 7-day trial contains the ChartExpo watermark (see below).
ChartExpo watermark
  • If you have obtained a license key:
    • Enter your license key in the “ChartExpo License Key” textbox in the “License Settings” section (see below).
    • Slide the toggle switch next to “Enable License” to “On”.
License Settings
  • Your Sankey Diagram should now be ready (see below). Note that it does not have a watermark.
sankey chart in power bi
  • For giving colors, expand the “Level Colors” properties and select a color. Do this to change the color of each node.
  • Automatically all changes will be saved.
expand stats
  • Your final chart will look like below.
sankey visual in power bi
  • Click on “+” to add another page in the Power BI report.
sankey graph in power bi
  • Your final report will look as below.
sankey in power bi

How to Create a Dashboard in Power BI?

We now learn how to create a dashboard in PBI. We’ll use the PBI report we generated to create our Power BI dashboard design.

  • Click on the “Pin” icon at the top of the Sankey chart.
Level Colors
  • Select the dashboard in which to pin the Sankey chart.
  • Click on the “Pin” button.
pin icon
  • Your final dashboard will look like the one below.
sankey chart in powe -bi

You can add more charts to this dashboard according to your needs.

Insights

  • Most of your traffic at the starting point came from external ads (146.27k).
  • The mobile app (256.76k) generated more traffic when compared to the website app (236.34k).
  • All the traffic landed on the product page. 377.31k users added to the cart. 115.79k users simply exited after viewing the product.
  • From 377.31k, 133.87k users cleared their carts and exited.
  • 93.07k checked out, & 150.37k clicked on another product.

FAQs

How Do I Convert a Report to a Power BI Dashboard?

Here are the steps that you need to take to convert a report to a PBI dashboard:

  1. Open a report and select “More options” or the ellipsis (…)
  2. This opens it in the editing view.
  3. Hover over a visualization to reveal the available options.
  4. Click on the pin icon. This allows you to add a visualization.
  5. Choose whether to add the visualization to a new or existing dashboard.

Why Are Dashboards Better Than Reports?

Dashboards provide a quick overview of your KPIs and business performance. You can easily consume information at a glance. They are also more interactive when compared to reports. Lastly, you can view real-time data with PBI dashboards.

Wrap Up

We have explored the Power BI dashboard vs. report in detail. While dashboards and reports are used for data and data visualization, they are not exactly the same.

We have come across major differences. For example, dashboards are single-page views of main KPIs. Reports, on the other hand, are more detailed and have more pages.

You can also view real-time data with dashboards.

We also looked at how to create a PBI report with ChartExpo’s Sankey diagram add-in. We then used this report to generate Power BI dashboard ideas.

Ultimately, we answered a few FAQs.

We hope that you’ll explore the Sankey diagram add-in for your dashboards and reports.

How much did you enjoy this article?
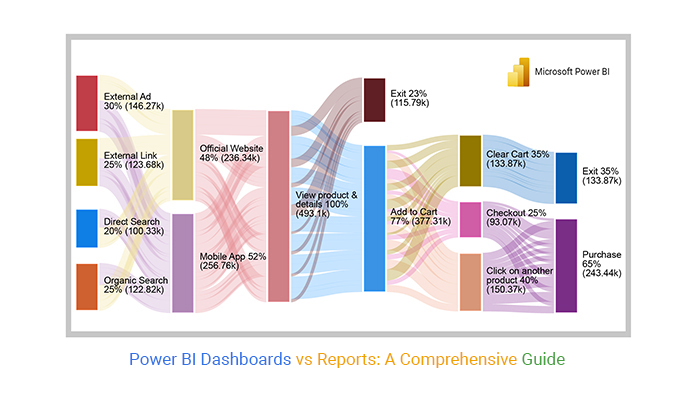
chartexpo ad
chartexpo ad
chartexpo ad
chartexpo ad
125738

Related articles

next previous
Power BI10 min read

How to Leverage Power BI Data Model for Analytics?

Learn how to optimize your Power BI data model for maximum performance and use data sets to create impactful charts in Power BI.

Power BI9 min read

Mastering Data Visualization: A Guide to Power BI in Office 365

Unlock Data Insights with Power BI in Office 365. Harness the combined potential of Power BI and the collaborative prowess of Office 365.

Power BI9 min read

Power BI Data Connectors: Your Gateway to Data Insights

Explore a wide range of Power BI connectors. Seamlessly integrate and visualize data. Enhance your analytics experience.

Power BI11 min read

What are the Main Features of Power BI Pro?

Supercharge your data analytics and visualization capabilities with Power BI Pro. Collaborate, share, and derive actionable insights from your data like never before.

Power BI10 min read

The Art of Storytelling with Power BI Dashboards Design

Discover the importance of beautiful Power BI dashboard design and learn best practices to create appealing and impactful dashboards using Power BI.

ChartExpo logo

Turn Data into Visual
Stories

CHARTEXPO

  • Home
  • Gallery
  • Videos
  • Services
  • Pricing
  • Contact us
  • FAQs
  • Privacy policy
  • Terms of Service
  • Sitemap

TOOLS

  • ChartExpo for Google Sheets
  • ChartExpo for Microsoft Excel
  • Power BI Custom Visuals by ChartExpo
  • Word Cloud

CATEGORIES

  • Bar Charts
  • Circle Graphs
  • Column Charts
  • Combo Charts
  • Comparison Charts
  • Line Graphs
  • PPC Charts
  • Sentiment Analysis Charts
  • Survey Charts

TOP CHARTS

  • Sankey Diagram
  • Likert Scale Chart
  • Comparison Bar Chart
  • Pareto Chart
  • Funnel Chart
  • Gauge Chart
  • Radar Chart
  • Radial Bar Chart
  • Sunburst Chart
  • see more
  • Scatter Plot Chart
  • CSAT Score Bar Chart
  • CSAT Score Survey Chart
  • Dot Plot Chart
  • Double Bar Graph
  • Matrix Chart
  • Multi Axis Line Chart
  • Overlapping Bar Chart
  • Control Chart
  • Slope Chart
  • Clustered Bar Chart
  • Clustered Column Chart
  • Box and Whisker Plot
  • Tornado Chart
  • Waterfall Chart
  • Word Cloud
  • see less

RESOURCES

  • Blog
  • Resources
  • YouTube
SIGN UP FOR UPDATES

We wouldn't dream of spamming you or selling your info.

© 2023 ChartExpo, all rights reserved.