Categories
You’re an Apple aficionado and have sworn by your Mac for everything from editing photos to streaming movies. But now, you are in a data-driven world where spreadsheets and charts rule the day.
You need a tool to make sense of it all. You come across Microsoft Power BI. This business intelligence platform is like a superhero for data, helping you analyze and visualize it with ease.
But wait, there’s a catch. You’re using a Mac device, and there’s no native version of Power BI for Mac.


What do you do?
Do you give up and switch to a PC? No way! You’re a Mac user, and don’t give up that easily.
You need a solution.
This blog post will take you on a ride into the world of Power BI for Mac. You’ll learn how to use it on your device and make the most of its powerful features.
Get ready to become the MacGyver of business intelligence.
Power BI is a robust and flexible business intelligence platform supporting effortless data analysis, visualization, and sharing. It integrates seamlessly with various Microsoft tools and supports a wide range of data sources. This makes it ideal for both self-service analytics and enterprise-level BI needs.
Power BI allows you to turn vast data into actionable insights. It offers powerful data modeling capabilities, dynamic visualizations, and advanced analytics features for informed decision-making. Moreover, Power BI presents effortless collaboration and sharing capabilities. This enables teams to collaborate on reports and dashboards and share them with stakeholders in real time.
Power BI for Mac holds significant importance due to its ability to cater to a diverse user base, including those who prefer macOS environments.
By offering a native application for Mac users, Power BI extends its reach and accessibility, ensuring that individuals across different platforms can leverage its powerful analytics capabilities.
This inclusivity not only enhances user experience but also promotes collaboration and data-driven decision-making across diverse teams and organizations.
Additionally, Power BI for Mac addresses the growing demand for cross-platform compatibility, allowing Mac users to seamlessly integrate Power BI into their workflows without the need for virtualization or third-party solutions.
When evaluating business intelligence tools, it’s also useful to consider comparisons like Looker vs Power BI to determine which platform best meets your needs.
Ultimately, the availability of Power BI for Mac underscores Microsoft’s commitment to meeting the evolving needs of its users and fostering a more inclusive analytics ecosystem.
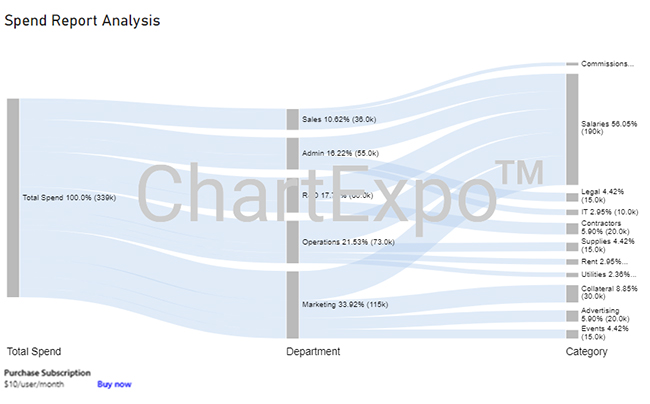
See how the Sankey Diagram for Power BI app works — demo here:
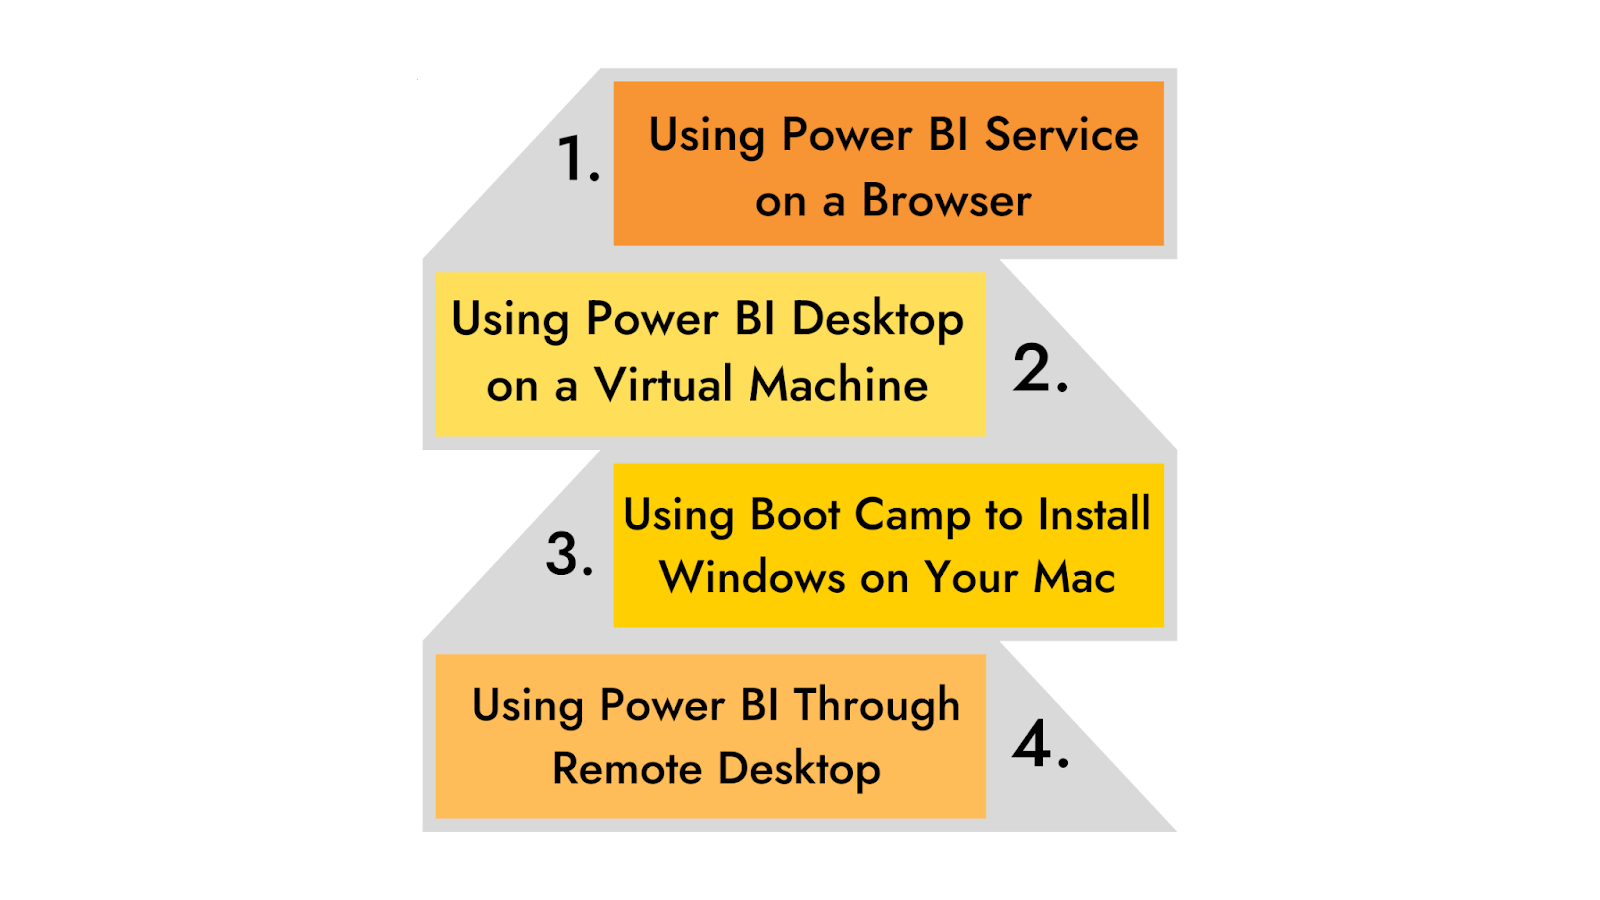
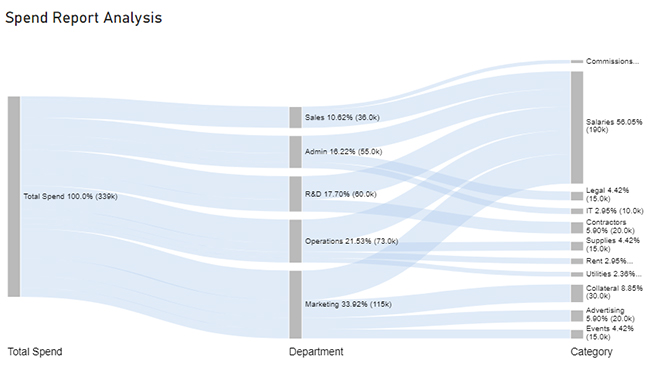
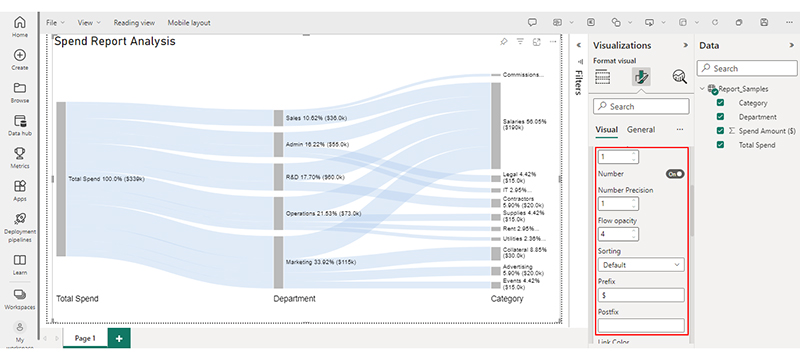
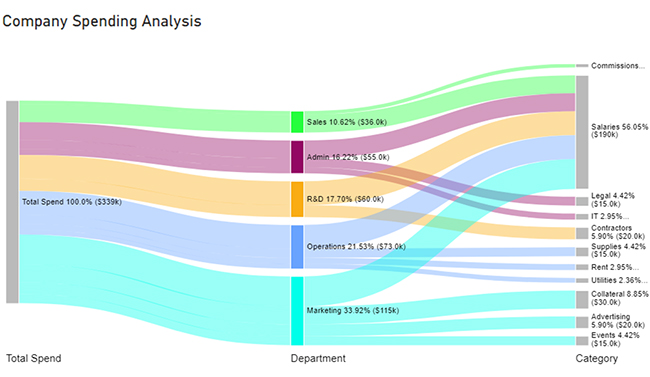
Let’s break down the process into five simple stages of using Power BI for Mac, including how tools like a Sankey chart in Power BI can help you visualize data more effectively.


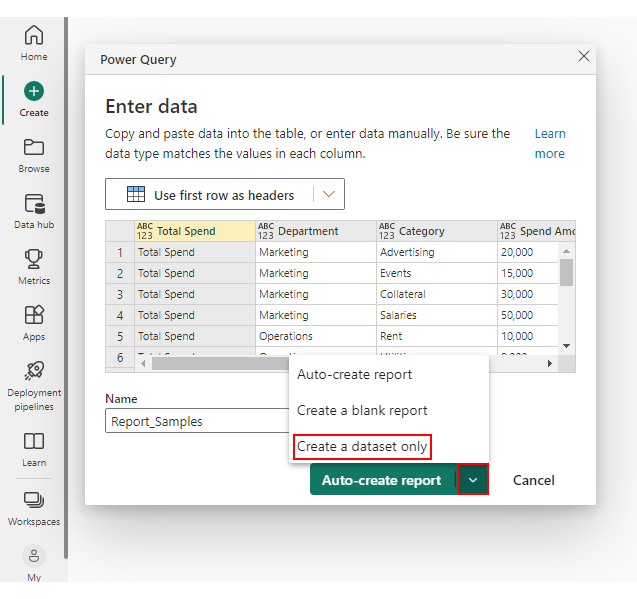
| Total Spend | Department | Category | Spend Amount ($) |
| Total Spend | Marketing | Advertising | 20,000 |
| Total Spend | Marketing | Events | 15,000 |
| Total Spend | Marketing | Collateral | 30,000 |
| Total Spend | Marketing | Salaries | 50,000 |
| Total Spend | Operations | Rent | 10,000 |
| Total Spend | Operations | Utilities | 8,000 |
| Total Spend | Operations | Supplies | 15,000 |
| Total Spend | Operations | Salaries | 40,000 |
| Total Spend | Sales | Salaries | 30,000 |
| Total Spend | Sales | Commissions | 6,000 |
| Total Spend | R&D | Salaries | 40,000 |
| Total Spend | R&D | Contractors | 20,000 |
| Total Spend | Admin | Salaries | 30,000 |
| Total Spend | Admin | Legal | 15,000 |
| Total Spend | Admin | IT | 10,000 |


Power BI does not have a native version specifically designed for macOS. However, you can still access the Power BI service through web browsers. Also, you can utilize the Power BI mobile app for iOS devices.
When using Power BI on a Mac, there are a few limitations and compatibility considerations. Some features or visualizations may have limited functionality on non-Windows platforms. Additionally, certain data connectors or integrations may have limited compatibility.
Power BI does not offer a dedicated desktop application for Mac devices. However, Mac users can still leverage the power of Power BI through the web-based version and mobile app. This allows you to create, view, and publish reports and dashboards and collaborate with colleagues.
The Power BI mobile app for iOS devices further enhances the accessibility of Power BI for Mac. It allows you to stay connected and access your reports on the go.
There may be limitations and compatibility issues when using Power BI on a Mac device. However, Power BI for Mac still provides a robust data analysis, reporting, and visualization solution.
It doesn’t matter whether you’re using Safari, Chrome, or any other Mac-compatible browser. You can tap into the power of Power BI and harness its potential to drive success.
Do not hesitate.
Unleash your analytical prowess with Power BI and ChartExpo, and unlock the full potential of data-driven decision-making.
How much did you enjoy this article?


Discover diverse and high-quality Power BI report examples for inspiration and insights. Elevate your reporting with strategic visualization techniques.

A Customer Relationship Management Dashboard centralizes data, tracks key metrics, and drives smarter business decisions. Discover now!

Explore Healthcare Dashboard Examples and learn how to turn complex healthcare data into clear, actionable insights for better decision-making.


