• Home
  • Tools dropdown img
    • Spreadsheet Charts

      • ChartExpo for Google Sheets
      • ChartExpo for Microsoft Excel
    • Power BI Charts

      • Power BI Custom Visuals by ChartExpo
    • Word Cloud

  • Charts dropdown img
    • Chart Category

      • Bar Charts
      • Circle Graphs
      • Column Charts
      • Combo Charts
      • Comparison Charts
      • Line Graphs
      • PPC Charts
      • Sentiment Analysis Charts
      • Survey Charts
    • Chart Type

      • Box and Whisker Plot
      • Clustered Bar Chart
      • Clustered Column Chart
      • Comparison Bar Chart
      • Control Chart
      • CSAT Survey Bar Chart
      • CSAT Survey Chart
      • Dot Plot Chart
      • Double Bar Graph
      • Funnel Chart
      • Gauge Chart
      • Likert Scale Chart
      • Matrix Chart
      • Multi Axis Line Chart
      • Overlapping Bar Chart
      • Pareto Chart
      • Radar Chart
      • Radial Bar Chart
      • Sankey Diagram
      • Scatter Plot Chart
      • Slope Chart
      • Sunburst Chart
      • Tornado Chart
      • Waterfall Chart
      • Word Cloud
    • Google Sheets
      Microsoft Excel
  • Services
  • Pricing
  • Contact us
  • Blog
  • Support dropdown img
      • Gallery
      • Videos
      • Contact us
      • FAQs
      • Resources
    • Please feel free to contact us

      atsupport@chartexpo.com

Categories
All Data Visualizations Data Analytics Surveys
Add-ons/
  • Google Sheets
  • Microsoft Excel
  • Power BI
All Data Visualizations Data Analytics Surveys
Add-ons
  • Google Sheets
  • Microsoft Excel
  • Power BI

We use cookies

This website uses cookies to provide better user experience and user's session management.
By continuing visiting this website you consent the use of these cookies.

Ok

ChartExpo Survey


Home > Blog > Data Analytics

Cost of Living Comparison by City: Calculator and Insights

Accepting a new job offer or searching for a new one can be a tedious process. One of the ways to navigate through it is by taking a close look at the Cost of Living Comparison by City. You have to take a living expense calculator to figure out the cost of living in your preferred cities. This strategy will help you know if the new wage will provide a comfortable lifestyle in the new city.

Cost of Living Comparison by City

In this guide, you will discover what the Cost of Living Comparison by City is, how to calculate the cost of living between cities, and also know the importance of making such comparisons.

Table of Content:

  1. What is the Cost of Living City Comparison?
  2. Why is the Cost of Living Comparison Between Cities Important?
  3. When to Compare City to City Cost of Living?
  4. Cost of Living Calculator: Top 6 Advanced Techniques
  5. Cost of Living Comparison Calculator
  6. Elements of Cost of Living Comparison From City to City
  7. How to Compare Living Expenses Between Cities: Step-By-Step
    • Step 1: Identify Cost Disparities
    • Step 2: Consider Relative Weights
    • Step 3: Evaluate the Impact on Lifestyle
    • Step 4: Factor in Income Levels
    • Step 5: Explore Non-Monetary Factors
    • Step 6: Account for Personal Circumstances
    • Step 7: Project Future Trends
  8. Top 5 City-by-City Cost of Living Comparison Examples
  9. How Do We Collect Data for Cost of Living Comparison?
  10. Best Tool for City Living Expense Comparison
  11. How to Analyze Cost of Living Comparison by City in Power BI?
  12. How Does Inflation Affect the Cost of Living?
  13. Best Practices for Comparing Expenses Between Cities
  14. Advantages of Comparing the Cost of Living by City
  15. Disadvantages of Cost of Living Comparison by City
  16. Cost of Living Comparison by City – FAQs
  17. Wrap Up

First…

What is the Cost of Living City Comparison?

Definition: The cost of living city comparison is the money needed to cater for basic living expenses like food, housing, healthcare, and taxes in your desired location and in a given timeframe. The cost of living is usually used to compare how living expenses in a certain city differ from those of other cities.

If living expenses in a city are high, then the wages in the city are most likely high. This way, people living in the city will be able to afford their basic needs. To effectively manage these expenses, individuals can use a monthly budget to track and plan their finances.

Why is the Cost of Living Comparison Between Cities Important?

Here are reasons why you should cost of living cities comparison.

  • Salary Negotiations

The cost of living in a city is put into consideration when it comes to negotiating salaries between employers and employees. Salary comparison by city plays a crucial role in this process. Jobs in high-cost cities come with higher salaries than similar jobs in low-cost cities. That’s because the cost of living in high-cost cities is higher than that of low-cost cities.

  • Education Choices

Families with students use to cost of living comparison by city to identify the affordability of colleges (or universities) in different cities. This includes daily living expenses, housing, and tuition.

  • Relocation Decisions

Several reasons influence your decision to move to a new city. These could be personal reasons, living conditions, or job opportunities. Employing data-driven decision-making, such as analyzing living expenses, will help you determine if your income can sustain you in the new city.

  • Financial Planning

A good understanding of the cost of living comparison by city will help you to plan your finances. Having this knowledge, including insights from healthcare analytics, helps when it comes to budgeting for healthcare, transportation, housing, and other living expenses. Reviewing the monthly budget can further guide you in creating a comprehensive financial plan.

  • Quality of Life

The Cost of living comparison internationally affects the overall living standard. High living cost affects the availability of quality healthcare, affordable housing, and the overall well-being of the people living in the city.

When to Compare City to City Cost of Living?

Comparing the cost of living between cities is useful when considering relocation, evaluating job offers, or planning a budget for travel or investment. It helps individuals understand how far their income will go in different locations, affecting decisions related to housing, transportation, and everyday expenses.

Compare city to city cost of living is also valuable for economic research, allowing analysts to assess regional disparities in quality of life and financial viability.

Cost of Living Calculator: Top 6 Advanced Techniques

  1. Adjust for Personal Lifestyle: Incorporate specific lifestyle choices, such as dining habits, entertainment preferences, or housing type (apartment vs. house). This provides a more personalized estimate.
  2. Consider Taxes: Factor in state, local, and federal taxes, which can vary significantly between cities. A ‘cost of living calculator by zip code’ may allow you to input your tax bracket for more accurate comparisons, ensuring a more precise understanding of the cost differences.
  3. Analyze Local Salaries: Advanced calculators often include salary data for various job titles in different cities. This helps assess whether salaries align with the local cost of living.
  4. Account for Inflation: Some calculators adjust cost comparisons based on projected inflation rates, helping users predict future living expenses.
  5. Track Long-Term Trends: Some calculators, such as a cost of living calculator by zip code, include historical data, showing how the cost of living has changed over time, allowing for a deeper understanding of a city’s economic trajectory.
  6. Incorporate Housing Markets: Advanced tools may integrate real-time data on housing markets, showing rental and purchase prices by neighborhood.

Cost of Living Comparison Calculator

Here’s a step-by-step process to help you calculate the cost of living between cities.

  1. Identify Key Expense Categories: These could include categories like:
    • Food
    • Housing
    • Education
    • Transportation
    • Healthcare
    • Clothing
    • Childcare
    • Leisure and Entertainment
    • Taxes
  1. Collect Data: Collect data on the cost of the categories identified in the first step. Reliable data sources are:
    • Real estate listings
    • City websites and local government
    • Supermarket websites
    • Transportation authorities
    • Healthcare providers
    • Tax agencies
  1. Calculate Weighted Averages: Weights should be assigned to each expense category, and that should be dependent on their perceived importance. For instance:
    • Housing: 35-45%
    • Food: 15-20%
    • Transportation: 10-15%
    • Healthcare: 5-10%
    • Others: assigned based on how important they are

Calculation of the weighted average cost will help you with cost-of-living comparison by city.

Elements of Cost of Living Comparison From City to City

The Cost of Living Index measurement that compares the relative cost of living between different locations, factoring in expenses such as housing, food, transportation, utilities, healthcare, and education. It is commonly used to assess how much more or less expensive one city or country is compared to another.

Key aspects of the Cost of Living Index include:

1. Housing Costs

  • Housing is typically the largest component, encompassing rent, mortgages, property taxes, and utilities.

2. Groceries and Food

  • This factor includes everyday food items, groceries, and dining-out expenses.

3. Transportation

  • Includes the cost of gas, public transportation, car ownership, and maintenance.

4. Healthcare

  • This factor covers medical insurance, doctor visits, prescriptions, and other health-related services.

5. Education

  • The cost of education, such as tuition, school supplies, and extracurricular activities, is often considered in cost comparison between cities.

How to Compare Living Expenses Between Cities: Step-By-Step

Here’s how to compare living expenses between cities.

  • Step 1: Identify Cost Disparities

Look for disparities in the cost of living comparison by city. Focus on the expense categories that contribute most to the disparity. For example, if housing costs are significantly higher in one city, it could be the largest contributor to the cost difference.

  • Step 2: Consider Relative Weights

Examine the relative weight assigned to each expense category. Categories with more importance will likely have a higher weight, which can affect the overall cost comparison between cities.

  • Step 3: Evaluate the Impact on Lifestyle

Consider how the cost comparison between cities affects the lifestyle of those moving into the city. Does a lower Cost of living comparison internationally translate to a higher standard of living? Answering this will help you determine whether moving is the right decision.

  • Step 4: Factor in Income Levels

Compare the income levels in each city. Higher-income cities typically have higher living costs, while lower-income cities often have lower living costs.

  • Step 5: Explore Non-Monetary Factors

Compare living expenses between cities, take into account non-monetary factors that could impact quality of life, such as job opportunities, crime rates, and climate conditions.

  • Step 6: Account for Personal Circumstances

Personal circumstances play a major role in cost of living comparison by city. For instance, young professionals may prioritize entertainment and job prospects, while families may focus on healthcare and education quality. Using healthcare data visualization can help families evaluate available healthcare services across locations.

  • Step 7: Project Future Trends

Anticipate future trends, such as housing market changes, policy shifts, and economic growth, which can influence the Cost of living comparison internationally in the future. Make adjustments to your plans based on these projections.

Top 5 City-by-City Cost of Living Comparison Examples

1. New York City vs. Houston

  • Housing: New York City’s average rent for a one-bedroom apartment in the city center is around $3,500/month, whereas in Houston, it is approximately $1,500/month.
  • Groceries: Grocery prices in NYC tend to be 20-30% higher than in Houston. For instance, a gallon of milk costs $4.50 in NYC versus $3.50 in Houston.
  • Transportation: New York City’s public transportation system costs $2.75 per ride, but owning a car can be expensive. In Houston, car ownership is more common, and gasoline is cheaper, making transportation more affordable.

2. San Francisco vs. Denver

  • Housing: In San Francisco, the cost of renting a one-bedroom apartment in the city center is around $3,500/month, while in Denver, it’s about $2,200/month.
  • Dining: A meal at an inexpensive restaurant in San Francisco costs around $20, compared to $15 in Denver.
  • Utilities: Utility costs (electricity, heating, cooling, water, garbage) for a standard 85m² apartment in San Francisco are roughly $150/month, compared to $120/month in Denver.

3. Los Angeles vs. Phoenix

  • Housing: A one-bedroom apartment in Los Angeles can cost around $2,500/month in the city center, while Phoenix offers a more affordable rate at about $1,400/month.
  • Groceries: Food prices are relatively similar, but Los Angeles tends to have a slightly higher cost for items like fresh produce and seafood.
  • Healthcare: Medical care in Los Angeles is generally more expensive than in Phoenix, especially for specialists and outpatient services.

4. Chicago vs. Atlanta

  • Housing: Chicago’s average rent for a one-bedroom apartment in the city center is approximately $2,100/month, while in Atlanta, it’s about $1,600/month.
  • Transportation: Public transportation in Chicago (CTA) costs $2.50 per ride, while in Atlanta (MARTA), it’s $2.50 as well, but many residents rely more on cars in Atlanta, which adds to car-related expenses.
  • Entertainment: Entertainment costs, like movie tickets, are usually cheaper in Atlanta, with a ticket averaging $12 compared to $15 in Chicago.

5. Miami vs. Dallas

  • Housing: A one-bedroom apartment in Miami’s city center can cost around $2,100/month, while in Dallas, it’s about $1,700/month.
  • Food: The cost of groceries in Miami is generally 10-15% higher than in Dallas, with basic food items costing more in Miami.
  • Healthcare: Health insurance premiums and medical services are typically more expensive in Miami than in Dallas.

How Do We Collect Data for Cost of Living Comparison?

The data for cost of living comparisons typically comes from government agencies, research organizations, and private companies that track the prices of goods and services over time. Key sources include:

  1. Government Agencies: In the U.S., for example, the Bureau of Labor Statistics (BLS) tracks inflation and price changes through the Consumer Price Index (CPI), which measures the average change in prices paid by consumers for a basket of goods and services.
  2. National and Regional Surveys: These surveys gather information on housing costs, transportation, utilities, and other daily expenses in different areas.
  3. Private Research Firms: Companies like Numbeo, Expatistan, and others aggregate cost-of-living differences between cities data from various regions around the world, using crowd-sourced input and government statistics.
  4. Local Data: City and regional reports often provide more specific details about local living costs, factoring in things like local rents, healthcare, and transportation.

Best Tool for City Living Expense Comparison

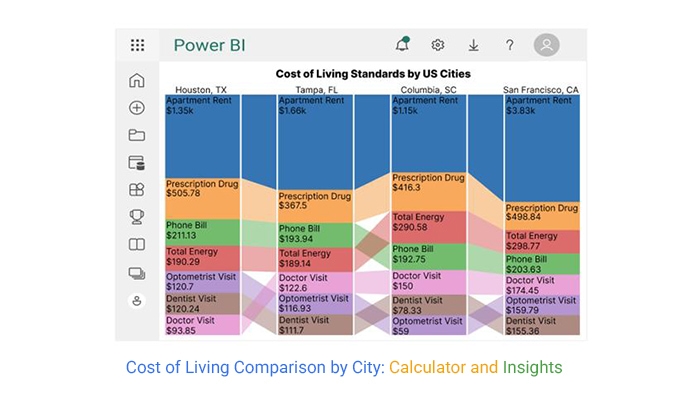
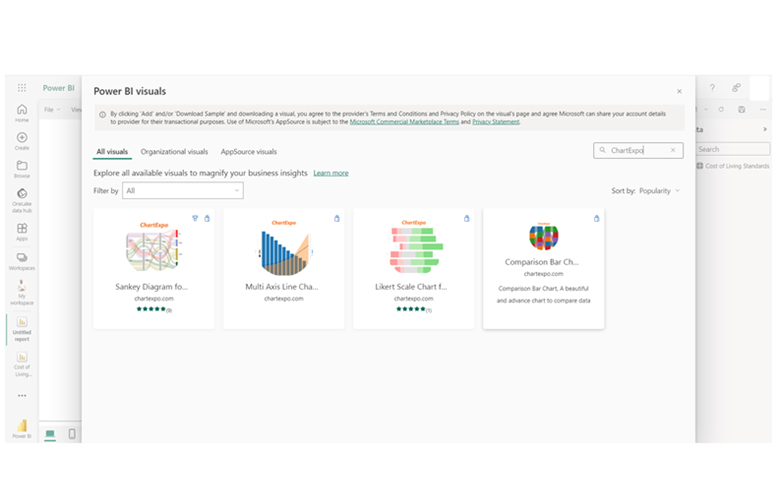
ChartExpo is an ideal tool for cost of living comparison by city, offering dynamic data visualizations like comparison bar chart and pie charts to easily compare factors such as housing, transportation, and healthcare across cities.

With customizable dashboards, real-time data integration, and advanced analytics, it helps users make informed decisions by presenting complex city living expense comparison data in a clear, interactive format. Its user-friendly interface makes it accessible to both beginners and experienced data analysts.

How to Analyze Cost of Living Comparison by City in Power BI?

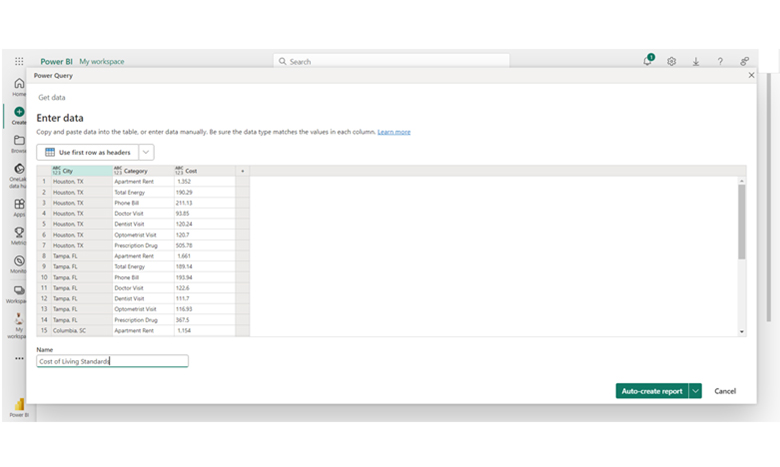
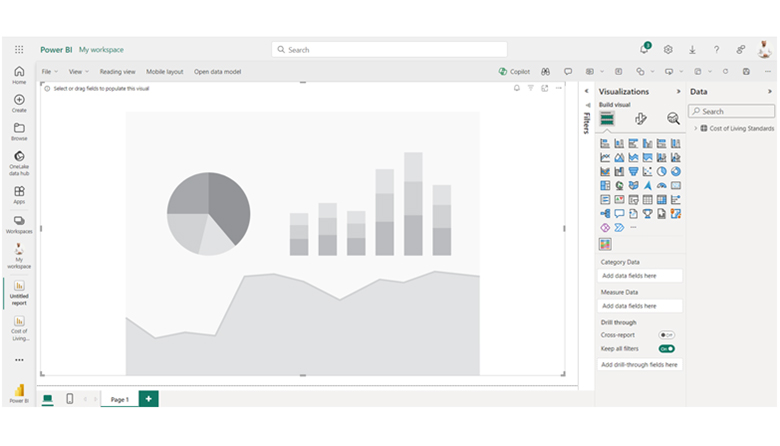
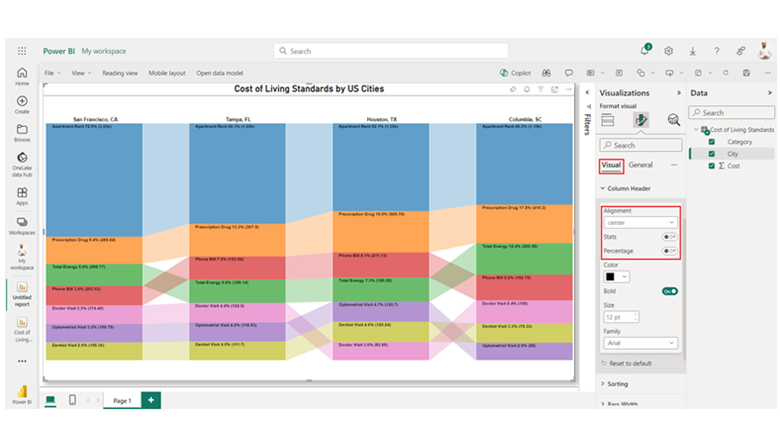
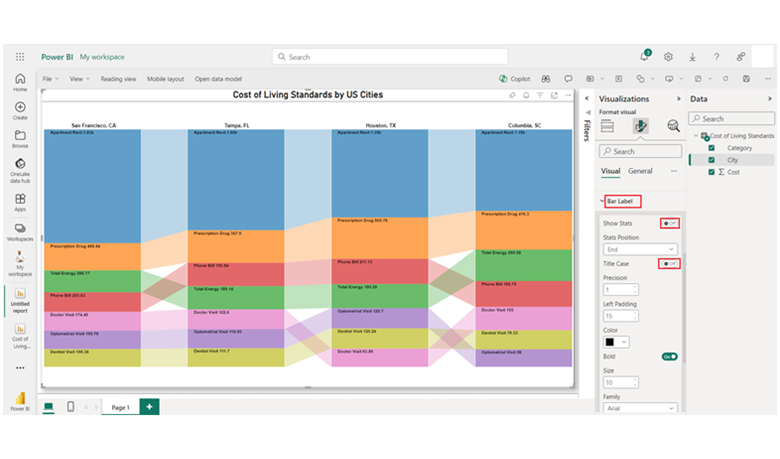
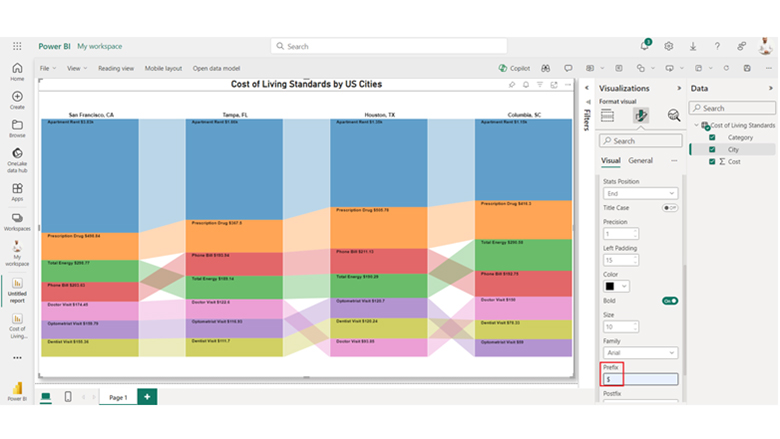
Stage 1: Logging in to Power BI

  • Log in to Power BI.
  • Enter your email address and click the “Submit” button.
Enter email to login to Power BI
  • You are redirected to your Microsoft account.
  • Enter your password and click “Sign in“.
Enter Password to login to Power BI
  • You can choose whether to stay signed in.
Click on stay signed in
  • Once done, the Power BI home screen will open.

Stage 2: Creating a Data Set and Selecting the Data Set to Use in Your Chart

  • Go to the left-side menu and click the “Create” button.
  • Select “Paste or manually enter data“.
select Paste or manually enter data in Power BI ce487
  • We’ll use the sample data below for this example.
City Category Cost
Houston, TX Apartment Rent 1352
Houston, TX Total Energy 190.29
Houston, TX Phone Bill 211.13
Houston, TX Doctor Visit 93.85
Houston, TX Dentist Visit 120.24
Houston, TX Optometrist Visit 120.7
Houston, TX Prescription Drug 505.78
Tampa, FL Apartment Rent 1661
Tampa, FL Total Energy 189.14
Tampa, FL Phone Bill 193.94
Tampa, FL Doctor Visit 122.6
Tampa, FL Dentist Visit 111.7
Tampa, FL Optometrist Visit 116.93
Tampa, FL Prescription Drug 367.5
Columbia, SC Apartment Rent 1154
Columbia, SC Total Energy 290.58
Columbia, SC Phone Bill 192.75
Columbia, SC Doctor Visit 150
Columbia, SC Dentist Visit 78.33
Columbia, SC Optometrist Visit 56.9
Columbia, SC Prescription Drug 416.3
San Francisco, CA Apartment Rent 3830
San Francisco, CA Total Energy 298.77
San Francisco, CA Phone Bill 203.68
San Francisco, CA Doctor Visit 174.63
San Francisco, CA Dentist Visit 155.36
San Francisco, CA Optometrist Visit 159.79
San Francisco, CA Prescription Drug 498.84
  • Paste the data table above into a “Power Query” and name it “Cost of Living Standard Analysis.” After that, choose the “Create a dataset only” option.
Click Create A Dataset Only for Cost of Living Comparison by City
  • Navigate to the left-side menu, and click the “Data Hub” option. The data set list will be populated by Power BI. If no data set has been created, you’ll get an error message. After that, click the “Create Report” option.
Click Create Report for Cost of Living Comparison by City
  • Next, click “Get more visuals.”
Click Get More Visuals for Cost of Living Comparison by City
  • Search for ChartExpo, and choose the Comparison Bar Chart.
Search Comparison Bar Chart for Cost of Living Comparison by City
  • Click on a comparison bar chart, and also on the “Add” option.
Click Add Option for Cost of Living Comparison by City
  • You’ll see the Comparison Bar Chart displayed on the visuals list.
See Comparison Bar Chart Icon for Cost of Living Comparison by City
  • Click on the Cost of Living Standards option.
Select Fields for Cost of Living Comparison by City
  • At this point, you’ll have to choose the metrics of the data. After that, add the key by clicking on the License Settings. The comparison bar chart will be displayed on your screen. To add header text, click on the General tab. You should add the header text in the Title.
Go to General Tab for Cost of Living Comparison by City
  • There’s the option of disabling the value in each top bar and aligning the text into the center.
Align Top Bar for Cost of Living Comparison by City
  • You can disable the percentage value and title case under the bar label.
Diable Percentage in Title Case for Cost of Living Comparison by City
  • You can also add the dollar sign with values.
Add Prefix with Value for Cost of Living Comparison by City
  • The Comparison Bar Chart’s final look will be similar to the image below.
Final Cost of Living Comparison by City

Insights

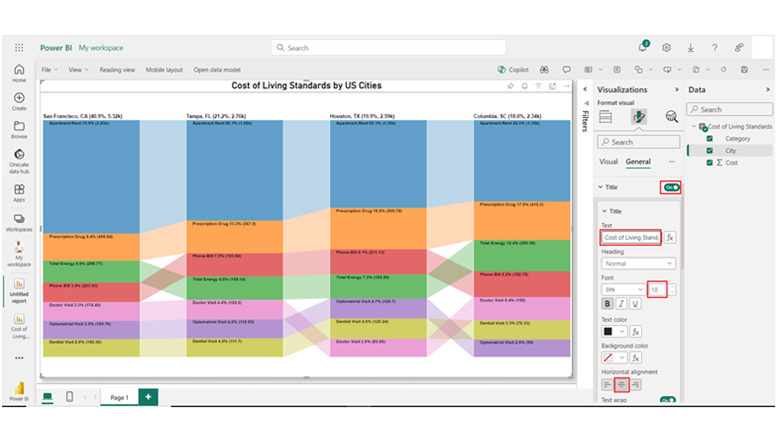
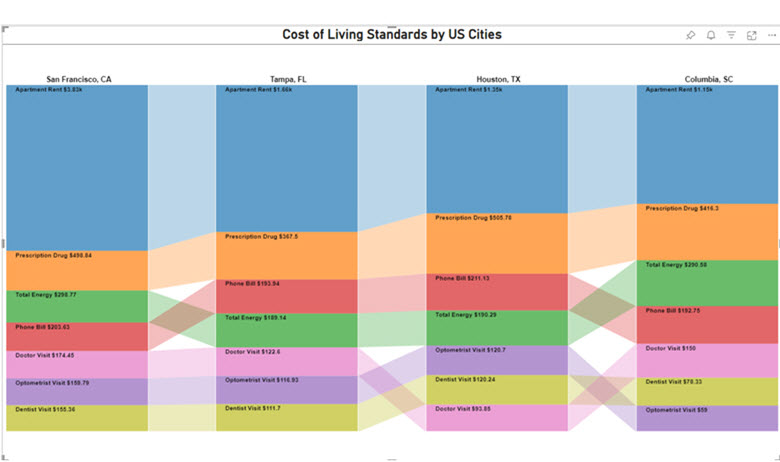
Here are three insights you can gain from the Comparison Bar Chart.

  • San Francisco is the city with the highest average rent, followed by other cities like Tampa, Houston, and Columbia.
  • Columbia has the highest average total energy cost, followed by cities like San Francisco, Tampa, and Houston.
  • The city with the highest average cost for dentist, doctor, and optometrist visits is San Francisco, while Columbia has the lowest.

How Does Inflation Affect the Cost of Living?

Inflation makes everything more expensive. When prices go up, you need more money to buy the same things, like food, gas, or clothes. This increase in prices is what we call the “cost of living.” So, if inflation rises, it means people have to spend more on the basics.

For those on a fixed income, like retirees, it can be harder because their income stays the same, but the prices keep climbing. To keep up, people might have to make changes in how they spend their money.

Best Practices for Comparing Expenses Between Cities

When comparing the cost of living difference between cities, it’s important to use a methodical approach to ensure accuracy and relevance. Here are some best practices to consider:

  1. Define Comparison Parameters: Outline the regions (or cities) you want to compare. Also, consider the timeframe.
  2. Use Reliable Data Sources: Your data should be collected from reputable sources like economic research organizations or government agencies.
  3. Standardized Currency: All expenses should be converted to a common currency.
  4. Consider Local Factors: Factors like housing market dynamics, consumer preferences, and taxes should be taken into consideration. Conducting consumer research can provide valuable insights into how these factors affect the overall comparison of city living costs and help in making more informed decisions.
  5. Anticipate Future Trends: The economy and government policies are always changing. Comparing the city living costs always impacts the trend.

Advantages of Comparing the Cost of Living by City

  1. Helps in Financial Planning: Knowing the cost differences allows individuals and businesses to budget properly before relocating.
  2. Better Salary Negotiation: Employees can use the cost of living by city to justify higher salaries when moving to a more expensive city.
  3. Informed Relocation Decisions: People can choose cities that offer the best balance between income and expenses.
  4. Business Expansion Insights: Companies can assess costs related to rent, labor, and utilities before setting up in a new city.
  5. Retirement and Lifestyle Choices: Helps retirees and remote workers find affordable places that match their needs.

Disadvantages of Cost of Living Comparison by City

  1. Does Not Reflect Personal Lifestyles: Two people in the same city can have very different living costs based on spending habits.
  2. Fluctuating Costs: Prices for housing, food, and transportation can change quickly, making comparisons outdated.
  3. Doesn’t Account for Quality of Life: A cheaper city might lack amenities, safety, or job opportunities.
  4. Hidden Expenses: Taxes, insurance, and healthcare costs may not be fully reflected in cost-of-living calculations.
  5. Limited Data Accuracy: Some sources rely on user-submitted data, which may not always be reliable or consistent.

Cost of Living Comparison by City – FAQs

How to compare the cost of living in two cities?

The first step is to gather data on living expenses like groceries, transportation, and housing. Next, make adjustments for income and currency differences.

What state has the cheapest overall cost of living?

In the United States, Mississippi is ranked one of the lowest in cost of living. This is due to its low healthcare costs, affordable housing, and lower-than-average product prices.

What is the most accurate cost of living index?

The most accurate cost of living index is dependent on your preferences and needs. Common indexes are Numbeo, Cost-of-Living Index (COLI), and Consumer Price Index (CPI).

Wrap Up

Compare cost of living by city is the total income needed to cater to the living expenses in a specific region. Comparing living expenses between multiple cities will help you in making good budgeting and relocation decisions. It also helps you understand how strong your purchasing power is.

Expert advice is also a vital piece that comes into play when considering relocation. You need to opt for professional advice and if possible, seek personalized guidance.

One way of making this comparison is by creating compelling visuals in Power BI. By following the simple steps outlined in this guide, you’ll become proficient in using Power BI. This will, in turn, help you create interactive and engaging visualizations over time.

Now you know how to perform a cost of living comparison by city, which cities will you be comparing their cost of living?

How much did you enjoy this article?

ExcelAd1
Start Free Trial!
136848

Related articles

next previous
Data Analytics10 min read

Google Workspace Features for Everyday Productivity

Google Workspace features boost communication, collaboration, and security. Learn about the top features, and discover tips to improve data visualization.

Data Analytics26 min read

Making AI for Data Analytics Less Fragile

AI for data analytics looks great until it fails—learn why pilots stall, stacks slow down, and insights mislead. Get real value from your data. Read on!

Data Analytics27 min read

Visual Analytics: Designing For Action, Not Admiration

Visual analytics reveals why dashboards fail, when trust breaks, and how teams act faster with fewer meetings. Want better results from data? Get started!

Data Analytics31 min read

Business Analytics: How to Get Heard, Trusted, & Funded

Business analytics can defend decisions or spark chaos. Learn how to align insights, eliminate noise, and get results. Read on!

Data Analytics29 min read

Data Analytics: Metrics, Mayhem, and Misunderstandings

Data analytics helps teams align strategy, spot failures, and act fast, but only if insights drive action. Ready to make it count? Get started now!

ChartExpo logo

Turn Data into Visual
Stories

CHARTEXPO

  • Home
  • Gallery
  • Videos
  • Services
  • Pricing
  • Contact us
  • FAQs
  • Privacy policy
  • Terms of Service
  • Sitemap

TOOLS

  • ChartExpo for Google Sheets
  • ChartExpo for Microsoft Excel
  • Power BI Custom Visuals by ChartExpo
  • Word Cloud

CATEGORIES

  • Bar Charts
  • Circle Graphs
  • Column Charts
  • Combo Charts
  • Comparison Charts
  • Line Graphs
  • PPC Charts
  • Sentiment Analysis Charts
  • Survey Charts

TOP CHARTS

  • Sankey Diagram
  • Likert Scale Chart
  • Comparison Bar Chart
  • Pareto Chart
  • Funnel Chart
  • Gauge Chart
  • Radar Chart
  • Radial Bar Chart
  • Sunburst Chart
  • see more
  • Scatter Plot Chart
  • CSAT Survey Bar Chart
  • CSAT Survey Chart
  • Dot Plot Chart
  • Double Bar Graph
  • Matrix Chart
  • Multi Axis Line Chart
  • Overlapping Bar Chart
  • Control Chart
  • Slope Chart
  • Clustered Bar Chart
  • Clustered Column Chart
  • Box and Whisker Plot
  • Tornado Chart
  • Waterfall Chart
  • Word Cloud
  • see less

RESOURCES

  • Blog
  • Resources
  • YouTube
SIGN UP FOR UPDATES

We wouldn't dream of spamming you or selling your info.

© 2025 ChartExpo, all rights reserved.