Categories
Consumer research methods are a goldmine of valuable information that can inform your marketing decisions. Consequently, helps you stay ahead of the competition and gain a strong market standing.


However, analyzing and interpreting survey data can be as challenging as solving a cryptic crossword puzzle. But don’t worry – all you need is the right approach and a bit of wit. Then you can turn those cryptic clues into a treasure trove of insights.
How?
In this guide, I’ll show you how to navigate the twists and turns of consumer research. Ultimately, extract the nuggets of wisdom hidden within.
Sit back, relax, and get ready to learn how to make sense of those cryptic survey questions.
Let’s get started.
Definition: Consumer research is like a deep dive into what people like, why they buy things, and how they feel about stuff they use or want. It’s a smart way for businesses to figure out what makes customers tick.
By collecting and analyzing consumer research data, businesses make sure they’re offering the right stuff to the right people.
Consumer research isn’t just a way to know your consumer’s mindset; it is the backbone of smart business decisions. It’s a process that helps businesses make data-driven decisions. By analyzing consumer behavior and creating a consumer journey map, businesses can shape their products and services to fit consumer needs, ensuring customer satisfaction and an increase in revenue.
Understanding the Consumer Mindset
By diving deep into the reasons behind why folks buy what they do, companies can craft products and services that folks want.
Consider a new restaurant planning its menu. Conducting consumer research helps them understand what their target market desires in their dining experiences such as ambiance, dietary preferences, or service style.
Consumer research will help them to ensure the menu caters to various tastes, dietary needs, and even cultural preferences within the community.
There is a reason why successful business owners do consumer research before making any business decision. Some key objectives of doing consumer research are:
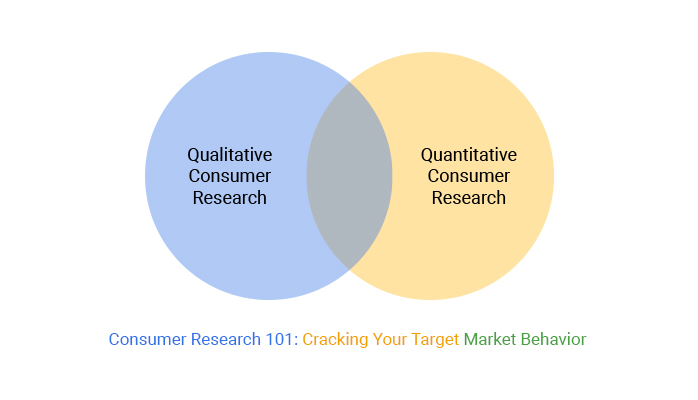
Consumer research is classified into two main types: qualitative consumer research and quantitative consumer research. These approaches differ in their methods, data collection techniques, and data analysis procedures.
Qualitative research is all about delving deep into the minds and experiences of consumers. The purpose is to understand their attitudes, motivations, and behaviors thoroughly. This approach seeks to gather rich and meaningful insights into consumers’ perceptions and experiences using non-numerical data.
Focus groups involve a small group of individuals who engage in a guided discussion led by a moderator. The moderator facilitates the conversation and encourages participants to express their opinions, experiences, and perceptions. They also probe further to gain deeper insights.
A researcher interviews participants one-on-one to delve deep into their thoughts, emotions, experiences, and viewpoints. These interviews facilitate a thorough investigation of the participant’s perspectives, leading to a holistic comprehension of their stance.
Content or text analysis involves the systematic examination and interpretation of textual data. For example, written documents, online reviews, social media posts, or other forms of consumer-generated content. Analyzing this content helps to identify themes, patterns, and insights related to consumer behavior, attitudes, and opinions.
Quantitative research employs numerical data to quantify and measure consumer behaviors, preferences, and attitudes. It involves collecting substantial sample data to ensure statistically meaningful outcomes. Surveys, experiments, statistical analysis, and data modeling are some methods utilized in quantitative research. They facilitate data analysis and draw conclusive insights about consumer behavior.
Researchers use closed-ended questions or rating scales to gather standardized responses, which can be easily analyzed and compared. The numerical data allows for identifying patterns, trends, and relationships and drawing generalizable conclusions.
Consumer research methods help businesses understand customer needs, behaviors, and preferences. Here are the main methods:
Consumer research tools help businesses collect and analyze data to understand customer behavior. Here are some top tools:
The consumer research process involves the following steps to ensure accurate and valuable data collection:
Apple conducts user feedback surveys and focus groups to understand what features customers want. This research helped introduce Face ID, improved cameras, and longer battery life in newer iPhone models.
Coca-Cola launched New Coke in 1985 after taste test research showed a preference for a sweeter formula. However, consumer backlash revealed that emotional attachment to the original flavor was overlooked. This led to the return of the Coca-Cola Classic.
Amazon uses A/B testing and purchases behavior analysis to adjust product prices in real time. This ensures competitive pricing and maximizes sales.
Nike conducted consumer sentiment analysis before launching the “Just Do It” campaign. Research showed that people wanted motivation and empowerment, leading to one of the most iconic marketing slogans.
McDonald’s used observational research and customer feedback to improve drive-thru wait times. Insights led to digital ordering screens and AI-powered voice recognition for faster service.
Here’s a comparison table of Primary vs. Secondary Consumer Research:
| Feature | Primary Research | Secondary Research |
| Definition | Data is collected firsthand for a specific purpose. | Uses existing data from other sources. |
| Data Collection Methods | Surveys, interviews, focus groups, experiments, observations. | Reports, market studies, academic papers, and government data. |
| Cost | Higher cost due to data collection efforts. | Lower cost since data is already available. |
| Time Required | Time-consuming as data is collected from scratch. | Faster as data is readily accessible. |
| Data Specificity | Highly specific to the research objective. | May not fully align with specific needs. |
| Reliability | More reliable since it’s collected firsthand. | May be outdated or biased depending on the source. |
| Examples | A company surveys customers about a new product. | A business uses government reports on consumer spending trends. |
They say opinions are like smartphones – everyone has one. But how do you make sense of all those opinions to make informed business decisions? That’s where consumer research analysis comes to the rescue.
How do you analyze the survey results of consumer research?
Use ChartExpo for Excel. With its simple user interface and customizable visualizations, ChartExpo makes turning survey results into actionable insights a breeze.
Benefits of Using ChartExpo
How to Install ChartExpo in Excel?
ChartExpo charts are available both in Google Sheets and Microsoft Excel. Please use the following CTA’s to install the tool of your choice and create beautiful visualizations in a few clicks in your favorite tool.
Let’s say you own a restaurant and want to gauge customer satisfaction. This necessitates you to conduct consumer market research. You create a consumer survey with the following questions.
You embed the response scale below to allow your customers to provide an answer to each question.
Assume that your survey yields the data table below.
| Are you satisfied with the quality of the food? | Are you satisfied with the staff’s behavior? | Are you satisfied with the overall quality of the service? |
| Very satisfied | Somewhat satisfied | Somewhat dissatisfied |
| Neither dissatisfied nor satisfied | Very dissatisfied | Very satisfied |
| Somewhat satisfied | Somewhat dissatisfied | Neither dissatisfied nor satisfied |
| Very dissatisfied | Neither dissatisfied nor satisfied | Very dissatisfied |
| Neither dissatisfied nor satisfied | Very dissatisfied | Somewhat satisfied |
| Very satisfied | Very satisfied | Somewhat satisfied |
| Very dissatisfied | Somewhat satisfied | Very satisfied |
| Somewhat satisfied | Somewhat satisfied | Somewhat dissatisfied |
| Very dissatisfied | Somewhat dissatisfied | Very satisfied |
| Very satisfied | Somewhat satisfied | Very dissatisfied |
| Neither dissatisfied nor satisfied | Neither dissatisfied nor satisfied | Very satisfied |
| Somewhat dissatisfied | Very satisfied | Neither dissatisfied nor satisfied |
| Somewhat dissatisfied | Somewhat satisfied | Somewhat dissatisfied |
| Neither dissatisfied nor satisfied | Very dissatisfied | Somewhat satisfied |
| Somewhat dissatisfied | Somewhat satisfied | Very dissatisfied |
| Very satisfied | Very dissatisfied | Neither dissatisfied nor satisfied |
| Somewhat dissatisfied | Somewhat dissatisfied | Very satisfied |
| Very satisfied | Somewhat satisfied | Somewhat satisfied |
| Very satisfied | Neither dissatisfied nor satisfied | Very satisfied |
| Somewhat satisfied | Very satisfied | Very dissatisfied |
This table contains example data. Expect many responses and questions in real life.


Surveys allow businesses to gather firsthand information about customer preferences, needs, and pain points. This helps in refining products, services, and marketing strategies based on real consumer opinions rather than assumptions.
Compared to other research techniques like focus groups or in-depth interviews, surveys are an affordable way to collect data. Online surveys, in particular, reduce the need for physical materials and interviewer costs, making them a budget-friendly option for businesses of all sizes.
Surveys can be distributed to a large audience quickly via email, social media, websites, or mobile apps. This ensures businesses can collect responses from diverse consumer groups across different locations and demographics.
Surveys provide structured, measurable responses that can be analyzed using statistical methods. This allows companies to identify patterns, track key performance indicators (KPIs), and make data-driven decisions.
When customers can respond anonymously, they are more likely to share honest opinions. This leads to more accurate insights, helping businesses improve customer satisfaction and brand reputation.
✅ Customization & Flexibility – Surveys can be tailored to specific research goals, whether it’s measuring customer satisfaction, brand perception, or product feedback.
✅ Quick Data Collection – Online surveys provide instant responses, enabling businesses to act on insights without long delays.
✅ Benchmarking & Trend Analysis – Companies can conduct recurring surveys to track customer sentiment over time and compare results with industry benchmarks.
Consumer research is the systematic study and analysis of consumer behaviors, attitudes, preferences, and decision-making processes. It aims to understand and predict consumer needs and desires. As a result, it enables businesses to make informed decisions and develop effective marketing strategies.
Two commonly used methods for consumer research are quantitative research and qualitative research. Quantitative research involves collecting and analyzing numerical data to measure and quantify consumer behavior. Qualitative research gathers in-depth insights and understands consumer perceptions and motivations through open-ended questions and observations.
To run consumer research, define your research objectives, and select appropriate research methods. Then design surveys or conduct interviews, collect and analyze data, and draw meaningful insights. The process involves careful planning, execution, and interpretation to gain valuable consumer insights for business decision-making.
Exploring the minds of consumers is a crucial step in understanding their decision-making process. Consumer research offer valuable insights into consumers’ desires, needs, and progress on their buying journey.
It’s crucial to bear in mind that survey data only offer an approximation of consumer behavior. Therefore, it’s essential to approach the results cautiously and carefully interpret them to avoid drawing inaccurate conclusions.
First, organize and clean the data by removing incomplete or irrelevant responses. Next, apply appropriate statistical analysis techniques to identify patterns, correlations, and trends within the data. This quantitative analysis can provide valuable insights into consumer preferences, behaviors, and market trends.
Additionally, qualitative analysis is essential for understanding the context behind the data. Thoroughly review open-ended responses, interview transcripts, and observational notes. Identify recurring themes, sentiments, and unique perspectives to better understand consumer motivations, opinions, and experiences.
Consider the research objectives and overarching business goals. Look for actionable insights and recommendations that can drive decision-making. Present the results using visualizations, charts, and concise summaries to communicate the key findings to stakeholders effectively.
Luckily, we have ChartExpo for Excel to make this analysis a breeze. With ChartExpo, you can create insightful, appealing charts without requiring any coding knowledge.
How much did you enjoy this article?


Google Forms to Google Sheets keeps your data organized and current with every submission. Learn the steps, methods, and tips now!

Product survey questions reveal what customers truly think. Learn how to ask the right ones and act on the survey results. Read on!

Learn how the 5-Point Performance Rating Scale improves employee evaluations with clear, consistent, and fair performance reviews across teams.


