• Home
  • Tools dropdown img
    • Spreadsheet Charts

      • ChartExpo for Google Sheets
      • ChartExpo for Microsoft Excel
    • Power BI Charts

      • Power BI Custom Visuals by ChartExpo
    • Word Cloud

  • Charts dropdown img
    • Chart Category

      • Bar Charts
      • Circle Graphs
      • Column Charts
      • Combo Charts
      • Comparison Charts
      • Line Graphs
      • PPC Charts
      • Sentiment Analysis Charts
      • Survey Charts
    • Chart Type

      • Box and Whisker Plot
      • Clustered Bar Chart
      • Clustered Column Chart
      • Comparison Bar Chart
      • Control Chart
      • CSAT Survey Bar Chart
      • CSAT Survey Chart
      • Dot Plot Chart
      • Double Bar Graph
      • Funnel Chart
      • Gauge Chart
      • Likert Scale Chart
      • Matrix Chart
      • Multi Axis Line Chart
      • Overlapping Bar Chart
      • Pareto Chart
      • Radar Chart
      • Radial Bar Chart
      • Sankey Diagram
      • Scatter Plot Chart
      • Slope Chart
      • Sunburst Chart
      • Tornado Chart
      • Waterfall Chart
      • Word Cloud
    • Google Sheets
      Microsoft Excel
  • Services
  • Pricing
  • Contact us
  • Blog
  • Support dropdown img
      • Gallery
      • Videos
      • Contact us
      • FAQs
      • Resources
    • Please feel free to contact us

      atsupport@chartexpo.com

Categories
All Data Visualizations Data Analytics Surveys
Add-ons/
  • Google Sheets
  • Microsoft Excel
  • Power BI
All Data Visualizations Data Analytics Surveys
Add-ons
  • Google Sheets
  • Microsoft Excel
  • Power BI

We use cookies

This website uses cookies to provide better user experience and user's session management.
By continuing visiting this website you consent the use of these cookies.

Ok

ChartExpo Survey


Home > Blog > Surveys

A Comprehensive Look at Types of Qualitative Research Design

Qualitative research – where ‘why’ is more important than ‘what.’ You might be thinking, “Qualitative research? Isn’t that just a fancy term for asking people a bunch of questions?”

types of qualitative research design

Ah, my dear friend, you are in for a delightful surprise.

Sure, qualitative research involves gathering data through interviews, observations, and discussions. However, it is so much more than a mere interrogation.

In this comprehensive exploration, we dive deep into the shimmering pool of qualitative research design. Peeling back its layers like an onion (minus the tears). We’ll navigate through the types of qualitative research design, shedding light on their distinct characteristics.

Don’t worry if you’re not a researcher or a scholar. You don’t need a Ph.D. to understand the nuances of qualitative research. We will break it down into meaningful inferences that are easily readable and understood by all.

From phenomenology to ethnography, grounded theory to case studies, we’ll leave no stone unturned.

Ready? Let’s dive in.

Table of Content:

  1. What is Qualitative Research?
  2. When to Use Qualitative Research?
  3. Types of Qualitative Research Methods?
  4. What are the Characteristics of Qualitative Research Methods?
  5. How to Analyze Qualitative Research Design Survey?
  6. Wrap Up

What is Qualitative Research?

Qualitative research seeks to understand people’s experiences and perceptions through non-numerical data. Rather than focusing on numbers, this approach delves into the complexities of human behavior. Techniques like interviews, observations, and focus groups are used to obtain valuable data and deeply understand phenomena.

When to Use Qualitative Research?

Qualitative research is useful where understanding the nuances and complexities of human experiences and behaviors is essential. Here are a few instances when qualitative research is commonly employed:

  • Developing a new product: Qualitative research, combined with effective information design, can help gather insights from potential customers and understand their needs, preferences, and pain points. This well-structured information can guide product development and innovation, ensuring the final product meets or exceeds customer expectations.
  • Understanding your strengths and weaknesses: Qualitative research methods can offer valuable feedback from customers about what they perceive as your strengths and weaknesses. This information can guide strategic decision-making and help you improve areas that need attention.
  • Understanding purchase behavior: Qualitative research can provide insights into the factors influencing customer purchasing decisions. Understanding consumer behavior analytics allows for tailored marketing efforts that align with their preferences, improving brand recognition.
  • Studying reactions to marketing campaigns and communications: Qualitative research helps assess audience reactions to marketing campaigns, ads, or communications. This feedback can help refine messaging, optimize content, and improve the overall effectiveness of your marketing initiatives.
  • Exploring market demographics, segments, and customer care groups: Qualitative research enables you to deeply understand different market segments, demographics, and customer care groups. Capturing their perspectives, behaviors, and needs allows you to tailor your products and services to their preferences.

Types of Qualitative Research Methods?

Here are the various types of qualitative research methods, each with a unique approach and focus.

  • Interviews

Interviews involve direct conversations between the researcher and participants about their experiences, opinions, and perspectives. They can be structured, semi-structured, or unstructured, depending on the level of guidance the researcher provides.

  • Focus Groups

Focus groups bring together a small group of participants to discuss a specific topic or research question. Dynamic group interactions allow for exploring different viewpoints, collective insights, and the emergence of shared meanings.

  • Observations

Observations involve systematic and purposeful observation of individuals or groups within their natural settings. You observe and document behaviors, interactions, and contextual factors to gain insights into social dynamics and cultural practices.

  • Case Studies

Case studies involve an in-depth exploration of a particular individual, group, organization, or event. You gather rich qualitative data through interviews, observations, and document analysis. Moreover, case studies provide detailed and context-specific insights into complex phenomena.

  • Ethnography

Ethnography involves immersive and long-term engagement with a specific social group or culture. You participate in participants’ daily lives as you observe their behaviors and practices. At the same time, conduct interviews to gain an in-depth understanding of their beliefs, values, and social structures.

  • Phenomenology

Phenomenology aims to explore the essence and meaning of lived experiences. It helps to understand how individuals interpret and make sense of experiences, focusing on subjective perceptions and consciousness. In-depth interviews and reflective analysis are often employed in phenomenological research.

  • Grounded theory

Grounded theory seeks to develop theories or explanations grounded in data. You start with open-ended interviews or observations and collect and analyze data iteratively. Then, gradually develop concepts and theories that emerge from the data.

  • Content analysis

Content analysis involves systematic analysis of textual, visual, or audiovisual data. It helps you identify themes, patterns, and meanings within the data. It often includes using coding frameworks or qualitative software to categorize and analyze the content.

  • Narrative analysis

Narrative analysis is centered on the examination and interpretation of stories, accounts, or narratives that individuals share. It involves a deep exploration of the structure, content, and underlying themes within these narratives. The goal is to gain insight into how individuals construct and convey meaning through storytelling.

  • Action Research

Action research combines research and action to address practical problems or challenges in real-world settings. Researchers collaborate with stakeholders to identify issues, gather data, and implement interventions. Then reflect on the outcomes to inform continuous improvement.

What are the Characteristics of Qualitative Research Methods?

The qualitative research approach has the following key characteristics that distinguish it from the quantitative approach.

  • Subjectivity: Qualitative research acknowledges that the researcher’s perspective can influence the research process and outcomes. Therefore, the researcher’s interpretations and insights are considered valuable and integral to the research.
  • Contextual and holistic: Qualitative research emphasizes understanding phenomena within their natural contexts. It seeks to explore the complex interplay between individuals, their environment, and social factors. Moreover, it recognizes that meanings and behaviors are shaped by the broader context in which they occur.
  • Rich and detailed data: Qualitative research gathers rich, detailed, and nuanced data. The methods used gather data that captures the depth and complexity of human experiences, thoughts, and emotions.
  • Interpretative analysis: Researchers analyze, interpret, and synthesize the data. Consequently, uncover themes, patterns, and meanings from the participants’ perspectives and experiences.

How to Analyze Qualitative Research Design Survey?

Excel is a powerful tool for data organization and analysis. However, like a penguin attempting flight, it struggles to soar in data visualization.

But fear not, my fellow data explorers, for we have a secret weapon up our sleeves ChartExpo. It’s the magical potion that transforms dull Excel spreadsheets into stunning visual masterpieces. Consequently, breathes life into qualitative research findings.

Benefits of Using ChartExpo

  • ChartExpo offers many visualization options, allowing you to cherry-pick the perfect one for your data. This makes data analysis and presentation a breeze, reducing the need for headache pills.
  • No coding skills? No problem. With ChartExpo’s intuitive interface, anyone can effortlessly create insightful, appealing data visualizations.
  • Cookie-cutter visuals are a thing of the past. ChartExpo, allows you to give your data some personality by customizing your visuals to suit your taste.
  • With ChartExpo, you don’t have to break the bank to get value for your money. The free 7-day trial gives you a taste of what ChartExpo can do. The monthly plan costs less than your daily cup of joe. It’s a no-brainer.

How to Install ChartExpo in Excel?

  1. Open your Excel application.
  2. Open the worksheet and click the “Insert” menu.
  3. You’ll see the “My Apps” option.
  4. In the office Add-ins window, click “Store” and search for ChartExpo on my Apps Store.
  5. Click the “Add” button to install ChartExpo in your Excel.

ChartExpo charts are available both in Google Sheets and Microsoft Excel. Please use the following CTA’s to install the tool of your choice and create beautiful visualizations in a few clicks in your favorite tool.

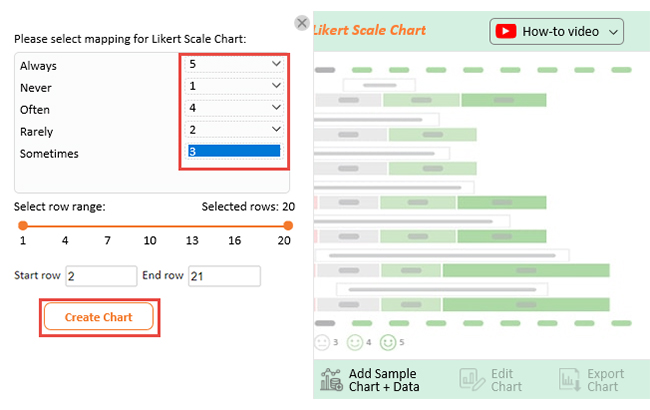
Let’s say you recently launched a product. You survey with the following questions to gather customer feedback for improvement.

  • How often do you use our product?
  • How would you rate the quality of our product?
  • What is the likelihood that you would recommend our product to others?

Your customers answer each question using the response scale below:

  1. Never
  2. Rarely
  3. Sometimes
  4. Often
  5. Always

Assume your survey yields the data table below.

How often do you use our product? How would you rate the quality of our product? What is the likelihood that you would recommend our product to others?
Never Rarely Never
Rarely Often Often
Sometimes Never Rarely
Often Sometimes Sometimes
Sometimes Often Often
Never Often Never
Often Never Sometimes
Often Often Often
Sometimes Rarely Often
Rarely Sometimes Rarely
Never Always Often
Often Always Sometimes
Often Never Often
Always Sometimes Always
Sometimes Always Always
Always Always Always
Always Never Sometimes
Sometimes Always Always
Rarely Sometimes Rarely
Always Rarely Always

This table contains example data. Expect many responses and questions in real life.

  • To get started with ChartExpo, install ChartExpo in Excel.
  • Now Click on My Apps from the INSERT menu.
insert chartexpo in excel
  • Choose ChartExpo from My Apps, then click Insert.
open chartexpo in excel
  • Once it loads, choose the “Likert Scale Chart” from the charts list.
list of charts in excel
  • Click the “Create Chart From Selection” button after selecting the data from the sheet, as shown.
Create Chart From Selection ce350
  • When you click the “Create Chart From Selection” button, you have to map responses with numbers manually. The Likert scale has this arrangement:
    • Never=1
    • Rarely=2
    • Sometimes=3
    • Often=4
    • Always=5
  • Once all is set, click the “Create Chart” button.
Map Likert Responses to Numbers ce350
  • ChartExpo will generate the visualization below for you.
types of qualitative research design template
  • If you want to have the chart’s title, click Edit Chart, as shown in the above image.
  • Click the pencil icon next to the Chart Header to change the title.
  • It will open the properties dialog. Under the Text section, you can add a heading in Line 1 and enable Show.
  • Give the appropriate title of your chart and click the Apply button.
apply title on chart ce350
  • Your final chart will appear below.
final types of qualitative research design

Insights

  • 25% of customers always recommend the product, while 30% often do. On the other hand, 10% never recommend it, and 15% rarely do.
  • 25% are always satisfied with the product’s quality, 20% often are, and 20% never. Additionally, 15% rarely are satisfied, while 20% sometimes are.
  • 20% always use the product, 25% often do, and 15% never do. Furthermore, 15% rarely use it, while 25% sometimes do.
  • The overall response to the survey questions;
    • Often – 25%
    • Always – 23%
    • Sometimes- 22%
    • Never – 15%
    • Rarely – 15%

FAQs

What is qualitative research?

Qualitative research is a method of inquiry that seeks to understand human experiences, behaviors, and social phenomena. It goes beyond numbers, exploring the subjective meanings individuals assign to their experiences and gathering non-numerical data.

What are the 6 types of qualitative research designs?

The six types of qualitative research designs include phenomenology, grounded theory, ethnography, case study, narrative, and action research. Each design offers unique approaches and methods for studying and understanding the human experience and social phenomena.

What are the 5 main qualitative design components?

The five main components of qualitative research design include the following;

  • Research questions.
  • Data collection methods.
  • Data analysis techniques.
  • Research validity and reliability considerations.

Wrap Up

Qualitative research design encompasses a deep appreciation for context, subjectivity, and the exploration of meaning. It goes beyond mere numbers and statistical analysis, embracing the complexities and nuances of the human world.

Our comprehensive exploration of qualitative research design has uncovered the richness and diversity of approaches involved. It has reminded us that beneath the numbers and statistics lies a world of subjective experiences.

From phenomenology to grounded theory, ethnography to case studies, and narrative research to action research. Each design offers unique perspectives and methods for understanding the intricacies of human experiences, behaviors, and social phenomena.

We have also discovered the power of ChartExpo as a transformative tool for data visualization in qualitative research. Excel may fall short in this realm, but with ChartExpo, you can breathe life into your qualitative data.

How?

ChartExpo turns your raw data into appealing, insightful visualizations that engage and inspire.

And the best part?

ChartExpo is easy to use. No coding is required.

How much did you enjoy this article?

GSAd1
Start Free Trial!
127483

Related articles

next previous
Surveys11 min read

How to Interpret 4-Point Likert Scale Results?

Click to learn How to Create, Gather and Analyze Data Using the 4-Point Likert Scale? A complete guide with definition, examples, uses, and applications.

Surveys32 min read

Net Promoter Survey: Lies, Legends, and Lazy Thinking

Net Promoter Survey risks hiding customer truths behind one-size-fits-all scores. Want feedback that drives decisions? Get started with smarter questions.

Surveys11 min read

How to Make a Questionnaire? Examples & Templates

What is a questionnaire in survey? Learn how to make a questionnaire for a survey using Google Forms and analyze the questionnaire data in Excel.

Surveys18 min read

50 Impactful Business Survey Questions for Targeted Insights

What is a business survey? How to use the right business survey questions to help get your customers' and prospects' insights and behaviors in Excel?

Surveys12 min read

Top Post-Event Survey Questions to Measure Event Success

Click to learn how to craft post-event survey questions. It will help you understand the attendees' perspectives to improve your future events and processes.

ChartExpo logo

Turn Data into Visual
Stories

CHARTEXPO

  • Home
  • Gallery
  • Videos
  • Services
  • Pricing
  • Contact us
  • FAQs
  • Privacy policy
  • Terms of Service
  • Sitemap

TOOLS

  • ChartExpo for Google Sheets
  • ChartExpo for Microsoft Excel
  • Power BI Custom Visuals by ChartExpo
  • Word Cloud

CATEGORIES

  • Bar Charts
  • Circle Graphs
  • Column Charts
  • Combo Charts
  • Comparison Charts
  • Line Graphs
  • PPC Charts
  • Sentiment Analysis Charts
  • Survey Charts

TOP CHARTS

  • Sankey Diagram
  • Likert Scale Chart
  • Comparison Bar Chart
  • Pareto Chart
  • Funnel Chart
  • Gauge Chart
  • Radar Chart
  • Radial Bar Chart
  • Sunburst Chart
  • see more
  • Scatter Plot Chart
  • CSAT Survey Bar Chart
  • CSAT Survey Chart
  • Dot Plot Chart
  • Double Bar Graph
  • Matrix Chart
  • Multi Axis Line Chart
  • Overlapping Bar Chart
  • Control Chart
  • Slope Chart
  • Clustered Bar Chart
  • Clustered Column Chart
  • Box and Whisker Plot
  • Tornado Chart
  • Waterfall Chart
  • Word Cloud
  • see less

RESOURCES

  • Blog
  • Resources
  • YouTube
SIGN UP FOR UPDATES

We wouldn't dream of spamming you or selling your info.

© 2025 ChartExpo, all rights reserved.