• Home
  • Tools dropdown img
    • Spreadsheet Charts

      • ChartExpo for Google Sheets
      • ChartExpo for Microsoft Excel
    • Power BI Charts

      • Power BI Custom Visuals by ChartExpo
    • Word Cloud

  • Charts dropdown img
    • Chart Category

      • Bar Charts
      • Circle Graphs
      • Column Charts
      • Combo Charts
      • Comparison Charts
      • Line Graphs
      • PPC Charts
      • Sentiment Analysis Charts
      • Survey Charts
    • Chart Type

      • Box and Whisker Plot
      • Clustered Bar Chart
      • Clustered Column Chart
      • Comparison Bar Chart
      • Control Chart
      • CSAT Survey Bar Chart
      • CSAT Survey Chart
      • Dot Plot Chart
      • Double Bar Graph
      • Funnel Chart
      • Gauge Chart
      • Likert Scale Chart
      • Matrix Chart
      • Multi Axis Line Chart
      • Overlapping Bar Chart
      • Pareto Chart
      • Radar Chart
      • Radial Bar Chart
      • Sankey Diagram
      • Scatter Plot Chart
      • Slope Chart
      • Sunburst Chart
      • Tornado Chart
      • Waterfall Chart
      • Word Cloud
    • Google Sheets
      Microsoft Excel
  • Services
  • Pricing
  • Contact us
  • Blog
  • Support dropdown img
      • Gallery
      • Videos
      • Contact us
      • FAQs
      • Resources
    • Please feel free to contact us

      atsupport@chartexpo.com

Categories
All Data Visualizations Data Analytics Surveys
Add-ons/
  • Google Sheets
  • Microsoft Excel
  • Power BI
All Data Visualizations Data Analytics Surveys
Add-ons
  • Google Sheets
  • Microsoft Excel
  • Power BI

We use cookies

This website uses cookies to provide better user experience and user's session management.
By continuing visiting this website you consent the use of these cookies.

Ok

ChartExpo Survey


Home > Blog > Microsoft Excel

Closed-Ended Questions: Definition, Types & Examples

Embark on a journey of structured inquiry with the illuminating guide to “Closed-Ended Questions Examples”.

What Are Closed Ended Questions

In the landscape of survey creation and data collection, closed-ended questionnaires serve as confident architects, providing a clear and efficient path to gathering specific responses.

Think of closed-ended questions as the sprinters of the survey world quick, snappy, and laser-focused. Like a well-orchestrated symphony, they cut through the noise, sparing respondents the agony of lengthy musings.

You’ve come to the right place if you’re tired of long-winded responses and yearn for efficiency.

Here, we’ll explore various closed-ended question examples suitable for your surveys. These examples encompass a variety of domains, including customer satisfaction, market research, employee feedback, and more.

Ultimately, you will create well-structured and efficient surveys that yield valuable insights.

This article is your gateway to understanding the power of closed-ended questions through diverse examples, where each query is designed with purpose and precision.

Table of Contents:

  1. What are Closed-Ended Questions?
  2. When to Use Closed-Ended Questions?
  3. Types of Closed-Ended Questions with Examples
  4. Purpose of Using Closed-Ended Survey Questions
  5. 16 Best Closed-Ended Questions Examples
  6. How to Craft a Closed-Ended Questionnaire?
  7. How to Examine Closed-Ended Questions?
  8. Tips for Using Closed-Ended Questions
  9. Advantages of Closed-Ended Questions
  10. Disadvantages of Closed-Ended Questions
  11. Wrap Up

First…

What are Closed-Ended Questions?

Definition: Closed-ended questions are a type of survey question or interview questions that offer predefined answer options. They limit respondents to choose from specific responses, such as “yes” or “no,” multiple-choice options, or rating scales. These questions are designed to elicit quick and concise answers, making data analysis more straightforward and efficient.

When to Use Closed-Ended Questions?

Closed-ended questions are well-suited for various situations and research scenarios due to their structured and objective nature. Here are some of the scenarios on when to use closed-ended questions:

  1. Surveys with large sample sizes: Closed-ended questions are ideal for surveys involving many respondents. They simplify survey data collection and analysis processes, making managing and interpreting responses from a large population easier.
  2. Quantitative research: If your study aims to gather numerical data and statistical insights, closed-ended questions are the way to go. The predefined response options allow for easy quantification and analysis of the data. Consequently, it enables you to identify trends and patterns efficiently.
  3. Objective data collection: Closed-ended questions are advantageous when seeking factual and objective information. Providing set response choices minimizes the risk of subjective interpretations, ensuring consistency in data collection.
  4. Comparison and ranking: Closed-ended questions are valuable for comparative analyses. They facilitate straightforward data organization and comparison. For instance, when asking participants to rank their preferences or compare various options.
  5. Limited response options: When you limit respondents’ answers to specific choices, closed-ended questions are the obvious choice. They ensure respondents choose from the available options, avoiding ambiguous or open-ended responses.

Types of Closed-Ended Questions with Examples

In survey research, closed-ended questionnaires, presenting predefined response choices, are commonly utilized. They are structured and efficient for gathering specific information. Below are different classifications of closed-ended questionnaire types:

  • Multiple Choice Questions (MCQs)

Survey takers opt from a prearranged list of choices.
Example: “Which of the following social media platforms do you use?

    • Facebook
    • Instagram
    • Twitter
    • LinkedIn”
  • Likert Scale Questions

Rate your level of alignment or dissent with the presented statement.
Example: Kindly indicate your degree of agreement or disagreement regarding the quality of service received.

    • Strongly Agree
    • Agree
    • Neutral
    • Disagree
    • Strongly Disagree”
  • Semantic Differential Scale Questions

Respondents rate something on a scale between two polar adjectives.
Example: “Please rate the quality of the product:
Excellent, Poor”

  • Dichotomous Questions

Queries typically offer binary choices, often between ‘affirmative’ and ‘negative’.
Example: “Have you purchased our product in the last six months?

    • Yes
    • No”
  • Ranking Questions

Respondents rank options in order of preference.
Example: “Please rank the following factors in order of importance when choosing a smartphone:

    • Battery Life
    • Camera Quality
    • Price
    • Brand Reputation”
  • Checklist Questions

Respondents select multiple options from a list.
Example: “Please select all the items you purchased in the last month:

    • Milk
    • Eggs
    • Bread
    • Cheese”
  • Numeric Response Questions

Respondents provide a numerical response.
Example: “Please indicate your daily social media usage by selecting the appropriate time frame:”

Purpose of Using Closed-Ended Survey Questions

Why closed-ended questions?

  1. Standardization: Closed-ended questions provide a structured format with predetermined answer options. This uniformity ensures that all respondents are presented with the same choices. As a result, it eliminates ambiguity and potential bias in the data collection process. Consequently, it makes it easier to compare and interpret responses.
  2. Quantitative data: Closed-ended questions typically involve numerical scales or multiple-choice options. Thus, the data collected is quantitative. As a result, the responses can be easily quantified, measured, and analyzed statistically.
  3. Ease of response: Respondents find closed-ended questions easy to answer as they don’t require lengthy explanations or open-ended responses. This simplicity encourages higher response rates and reduces the risk of participants skipping questions.
  4. Comparability: Closed-ended questions enable straightforward comparisons between different respondents or groups. With standardized response options, you can directly compare how different population segments feel or think. As a result, this comparability aids in drawing meaningful conclusions and identifying significant differences.
  5. Efficient analysis: The structured nature of closed-ended questions streamlines the data analysis process, including self-service analytics. You can quickly categorize and quantify the responses, making spotting patterns and drawing conclusions easier. Moreover, this efficiency saves time and resources for researchers.

16 Best Closed-Ended Questions Examples

Unlock the power of precision as you capture laser-focused responses with these closed-ended question examples.

  • How satisfied are you with our product/service?
    • Very satisfied
    • Satisfied
    • Neutral
    • Dissatisfied
    • Very dissatisfied
  • Have you ever purchased from our online store?
    • Yes
    • No
  • On a scale of 1 to 5, how likely are you to recommend our company to others?
    • Not likely at all
    • Unlikely
    • Neutral
    • Likely
    • Very likely
  • How satisfied are you with the company’s training and development programs?
    • Very satisfied
    • Satisfied
    • Neutral
    • Dissatisfied
    • Very dissatisfied
  • Which social media platform do you use most frequently?
    • Facebook
    • Instagram
    • Twitter
    • LinkedIn
    • Other
  • How often do you exercise per week?
    • 0 times
    • 1-2 times
    • 3-4 times
    • 5 or more times
  • Are you a vegetarian?
    • Yes
    • No
  • Which age group do you belong to?
    • Under 18
    • 18-30
    • 31-45
    • 46-60
    • 61+
  • Are you satisfied with the customer service you received?
    • Yes, very satisfied
    • Yes, somewhat satisfied
    • No, somewhat dissatisfied
    • No, very dissatisfied
  • How long have you been using our products?
    • Less than 6 months
    • 6 months-12 months
    • More than 1 year
    • More than 2 years
  • Which social media platform do you use the most?
    • Facebook
    • Instagram
    • Twitter
    • LinkedIn
    • TikTok
  • Have you purchased from our online store before?
    • Yes
    • No
  • How satisfied are you with our customer service?
    • Very satisfied
    • Satisfied
    • Neutral
    • Dissatisfied
    • Very dissatisfied
  • How did you hear about our product/service?
    • TV advertisement
    • Social media
    • Word of mouth
    • Online search
    • Print media
  • How often do you use our services?
    • Daily
    • Weekly
    • Monthly
    • Occasionally
    • Never used
  • Which channel do you prefer for customer support?
    • Phone
    • Email
    • Live chat
    • In-person visit
    • Self-help documentation

How to Craft a Closed-Ended Questionnaire?

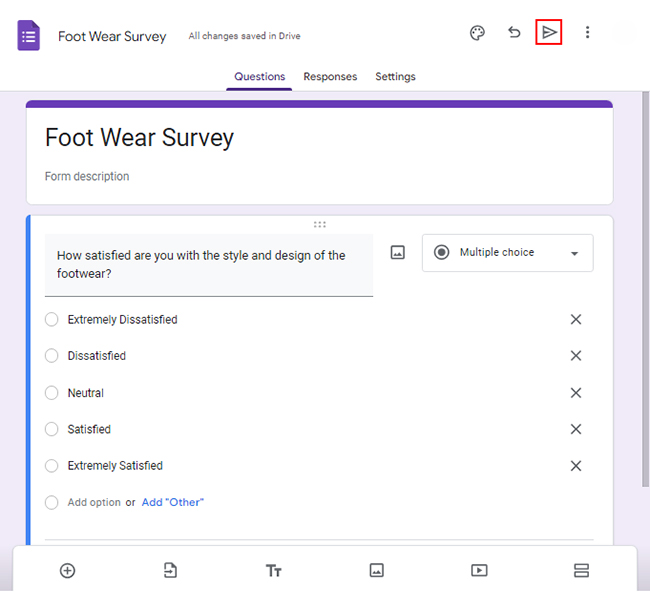
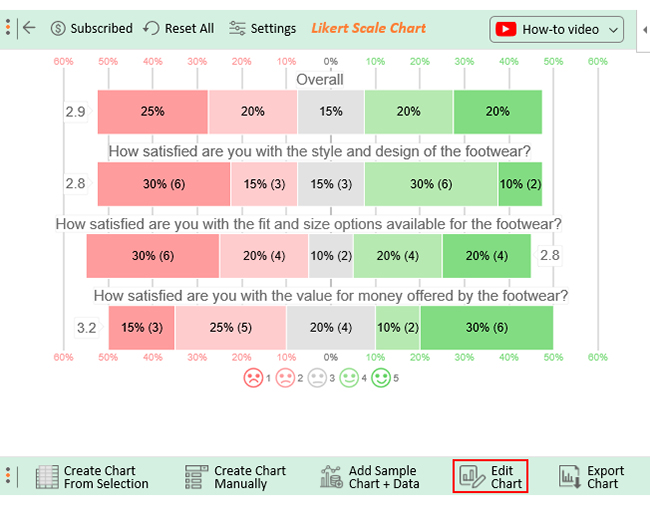
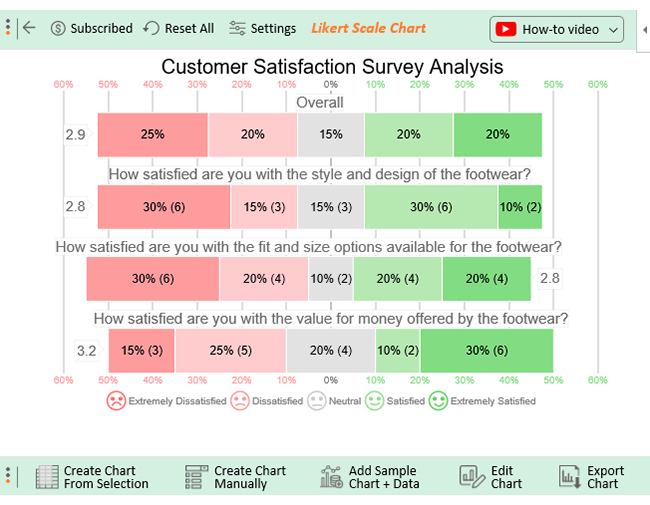
Let’s say you want to conduct a customer satisfaction survey for a footwear brand. You want your survey to include the closed-ended survey questions below.

  • How satisfied are you with the style and design of the footwear?
  • How satisfied are you with the fit and size options available for the footwear?
  • How satisfied are you with the value for money offered by the footwear?

Below are the response options associated with each question:

  1. Extremely Dissatisfied
  2. Dissatisfied
  3. Neutral
  4. Satisfied
  5. Extremely Satisfied

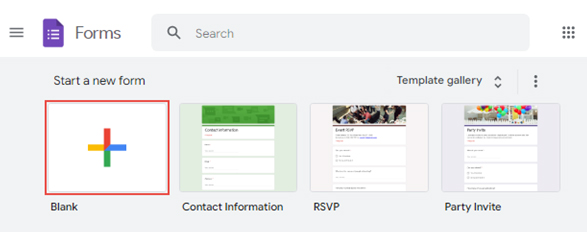
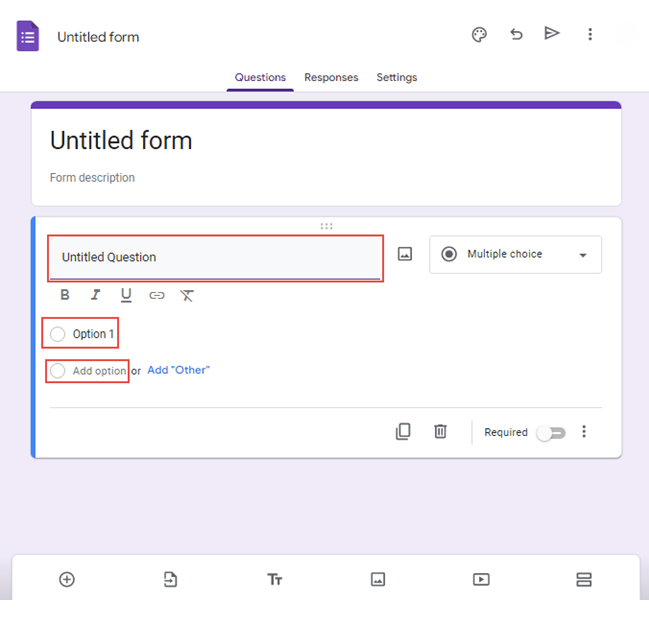
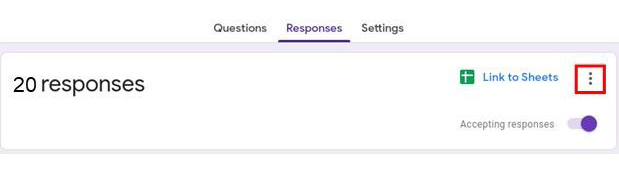
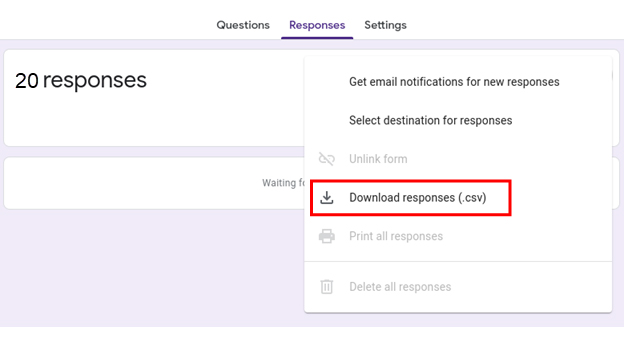
Follow the steps below to create a survey using Google Forms.

  • Open Google Forms and sign in with your Google account.
  • Click the “Blank” button to create a new form.
closed-ended question examples in google forms
  • Give your form a title and description that reflects your brand or purpose.
  • Choose the type of question you want to use, such as multiple-choice, checkbox, or short answer.
  • Type your question in the “Untitled Question” section for multiple-choice questions. Then write “Option 1” and choose “Add option” for more options.
closed-ended question examples in google forms 2
  • You can customize the look and feel of your survey to match your brand or theme.
  • Preview the form before sharing it with your target audience.
  • Click the share button to distribute it to your target audience.
closed-ended question examples in google forms 3
  • Once you collect enough responses, click the “Link to Sheets” button.
closed-ended question examples in google forms 4
  • Download the responses as a .csv file from the drop-down menu.
closed-ended question examples in google forms 5

How to Examine Closed-Ended Questions?

Excel is undoubtedly a popular choice for data analysis, offering many features and functionalities. However, when it comes to visualizing large datasets, Excel has its limitations.

With overwhelming data, creating data visualizations conveying the key insights becomes increasingly challenging.

That’s where ChartExpo comes in.

ChartExpo seamlessly integrates with Excel, providing a user-friendly interface and a wide array of visualization options. With ChartExpo, you can transform raw data into stunning visual representations, making data presentation and analysis easier.

Let’s learn how to Install ChartExpo in Excel.

  1. Open your Excel application.
  2. Open the worksheet and click the “Insert” menu.
  3. You’ll see the “My Apps” option.
  4. In the office Add-ins window, click “Store” and search for ChartExpo on my Apps Store.
  5. Click the “Add” button to install ChartExpo in your Excel.

ChartExpo charts are available both in Google Sheets and Microsoft Excel. Please use the following CTA’s to install the tool of your choice and create beautiful visualizations in a few clicks in your favorite tool.

Example #1

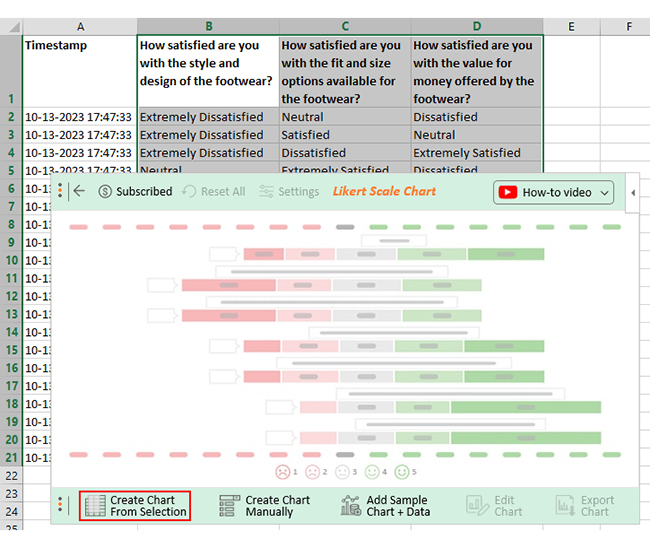
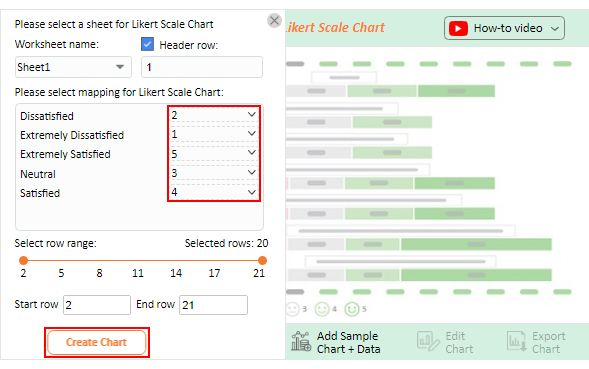
Assume your closed-ended survey yields the data table below.

Timestamp How satisfied are you with the style and design of the footwear? How satisfied are you with the fit and size options available for the footwear? How satisfied are you with the value for money offered by the footwear?
10-13-2023 17:47:33 Extremely Dissatisfied Neutral Dissatisfied
10-13-2023 17:47:33 Extremely Dissatisfied Satisfied Neutral
10-13-2023 17:47:33 Extremely Dissatisfied Dissatisfied Extremely Satisfied
10-13-2023 17:47:33 Neutral Extremely Satisfied Dissatisfied
10-13-2023 17:47:33 Satisfied Extremely Dissatisfied Dissatisfied
10-13-2023 17:47:33 Dissatisfied Dissatisfied Extremely Satisfied
10-13-2023 17:47:33 Extremely Satisfied Extremely Dissatisfied Neutral
10-13-2023 17:47:33 Dissatisfied Satisfied Extremely Dissatisfied
10-13-2023 17:47:33 Satisfied Dissatisfied Satisfied
10-13-2023 17:47:33 Dissatisfied Neutral Extremely Satisfied
10-13-2023 17:47:33 Extremely Dissatisfied Dissatisfied Extremely Dissatisfied
10-13-2023 17:47:34 Extremely Dissatisfied Extremely Dissatisfied Satisfied
10-13-2023 17:47:35 Extremely Satisfied Extremely Satisfied Extremely Satisfied
10-13-2023 17:47:36 Satisfied Extremely Satisfied Extremely Satisfied
10-13-2023 17:47:37 Neutral Extremely Dissatisfied Extremely Dissatisfied
10-13-2023 17:47:38 Neutral Extremely Dissatisfied Extremely Satisfied
10-13-2023 17:47:39 Satisfied Satisfied Dissatisfied
10-13-2023 17:47:40 Satisfied Satisfied Neutral
10-13-2023 17:47:41 Extremely Dissatisfied Extremely Satisfied Dissatisfied
10-13-2023 17:47:42 Satisfied Extremely Dissatisfied Neutral

This table contains example data. Expect many responses and questions in real life.

  • To get started with ChartExpo, install ChartExpo in Excel.
  • Now Click on My Apps from the INSERT menu.
insert chartexpo in excel
  • Choose ChartExpo from My Apps, then click Insert.
open chartexpo in excel
  • Once it loads, choose the “Likert Scale Chart” from the charts list.
search likert scale chart for creating closed-ended question examples
  • Click the “Create Chart From Selection” button after selecting the data from the sheet, as shown.
Create Chart From Selection for creating closed-ended question examples
  • When you click the “Create Chart From Selection” button, you have to map responses with numbers manually. The Likert scale has this arrangement:
    • Extremely Dissatisfied = 1
    • Dissatisfied = 2
    • Neutral = 3
    • Satisfied = 4
    • Extremely Satisfied = 5
  • Once all is set, click the “Create Chart” button.
Map Likert Responses to Numbers for creating closed-ended question examples
  • ChartExpo will generate the visualization below for you.
edit for for creating closed-ended question examples
  • If you want to have the chart’s title, click Edit Chart, as shown in the above image.
  • Click the pencil icon next to the Chart Header to change the title.
  • It will open the properties dialog. Under the Text section, you can add a heading in Line 1 and enable Show.
  • Give the appropriate title of your chart and click the Apply button.
Apply Title on Chart for creating closed-ended question examples
  • Let’s say you want to add text responses instead of numbers against every emoji.
  • Click the pencil icon next to the respective emoji. Expand the “Label” properties and write the required text. Then click the “Apply All” button.
  • Click the “Save Changes” button to persist the changes.
Apply Label on Chart for creating closed-ended question examples
  • Your final chart will appear below.
Final closed-ended question examples

Insights

  • 40% of customers express satisfaction with the style and design of the footwear. 45% express dissatisfaction and 15% remain neutral.
  • 40% are satisfied with the fit and size options available for the footwear, while 50% are dissatisfied.
  • 40% are satisfied with the value for money the footwear offers, with 40% expressing dissatisfaction.
  • Overall;
    • 40% of customers report being satisfied with the footwear, with 20% extremely satisfied.
    • 45% of customers report dissatisfaction, with 25% extremely dissatisfied
    • 15% remain neutral.

Example #2

Let’s say you manage a school. You want to gather feedback from students on various issues like the quality of teaching. You have created a survey with the closed-ended questionnaire below;

  • How satisfied are you with the quality of teaching?
  • How satisfied are you with the academic resources?
  • How satisfied are you with the administrative services?
  • How satisfied are you with the availability of extracurricular activities?

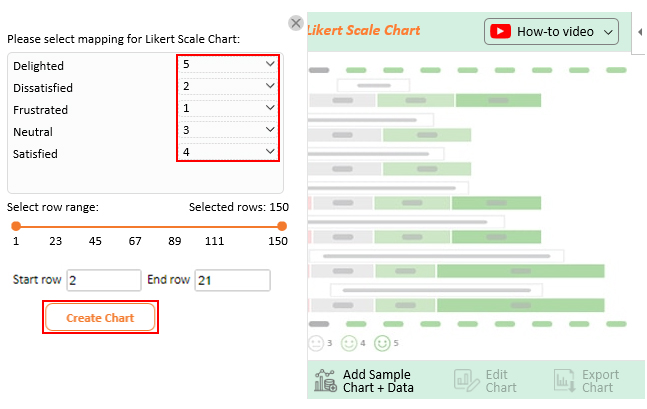
Students respond to each question using the response scale below.

  1. Frustrated
  2. Dissatisfied
  3. Neutral
  4. Satisfied
  5. Delighted

Assume your survey yields the data table below.

Timestamp How satisfied are you with the quality of teaching? How satisfied are you with the academic resources? How satisfied are you with the administrative services? How satisfied are you with the availability of extracurricular activities?
10-13-2023 17:47:33 Neutral Dissatisfied Dissatisfied Delighted
10-13-2023 17:47:33 Delighted Delighted Frustrated Neutral
10-13-2023 17:47:33 Satisfied Dissatisfied Delighted Dissatisfied
10-13-2023 17:47:33 Delighted Delighted Delighted Satisfied
10-13-2023 17:47:33 Neutral Satisfied Neutral Satisfied
10-13-2023 17:47:33 Satisfied Neutral Delighted Delighted
10-13-2023 17:47:33 Delighted Frustrated Delighted Frustrated
10-13-2023 17:47:33 Dissatisfied Delighted Delighted Satisfied
10-13-2023 17:47:33 Frustrated Neutral Satisfied Delighted
10-13-2023 17:47:33 Satisfied Satisfied Satisfied Delighted
10-13-2023 17:47:33 Delighted Satisfied Frustrated Satisfied
10-13-2023 17:47:34 Satisfied Frustrated Dissatisfied Frustrated
10-13-2023 17:47:35 Satisfied Satisfied Neutral Delighted
10-13-2023 17:47:36 Delighted Dissatisfied Dissatisfied Delighted
10-13-2023 17:47:37 Dissatisfied Frustrated Delighted Delighted
10-13-2023 17:47:38 Delighted Dissatisfied Satisfied Frustrated
10-13-2023 17:47:39 Delighted Neutral Frustrated Satisfied
10-13-2023 17:47:40 Neutral Dissatisfied Frustrated Delighted
10-13-2023 17:47:41 Dissatisfied Delighted Dissatisfied Satisfied
10-13-2023 17:47:42 Satisfied Neutral Dissatisfied Dissatisfied

This table contains example data. Expect many responses and questions in real life.

  • To get started with ChartExpo, install ChartExpo in Excel.
  • Now Click on My Apps from the INSERT menu.
insert chartexpo in excel
  • Choose ChartExpo from My Apps, then click Insert.
open chartexpo in excel
  • Once it loads, choose the “Likert Scale Chart” from the charts list.
search likert scale chart in excel for creating closed-ended question examples
  • Click the “Create Chart From Selection” button after selecting the data from the sheet, as shown.
Create Chart From Selection for creating closed-ended question examples
  • When you click the “Create Chart From Selection” button, you have to map responses with numbers manually. The Likert scale has this arrangement:
    • Frustrated = 1
    • Dissatisfied = 2
    • Neutral = 3
    • Satisfied = 4
    • Delighted = 5
  • Once all is set, click the “Create Chart” button.
Map Likert Responses to Numbers for creating closed-ended question examples
  • ChartExpo will generate the visualization below for you.
Closed-Ended Questions Examples Design Template
  • If you want to have the chart’s title, click Edit Chart, as shown in the above image.
  • Click the pencil icon next to the Chart Header to change the title.
  • It will open the properties dialog. Under the Text section, you can add a heading in Line 1 and enable Show.
  • Give the appropriate title of your chart and click the Apply button.
Apply Title on Chart for creating closed-ended question examples
  • Let’s say you want to add text responses instead of numbers against every emoji.
  • Click the pencil icon next to the respective emoji. Expand the “Label” properties and write the required text. Then click the “Apply All” button.
  • Click the “Save Changes” button to persist the changes.
Apply Label on Chart for creating closed-ended question examples
  • Your final chart will appear below.
final-Closed-Ended Questions Examples

Insights

  • 35% of students expressed their delight with the quality of teaching, while 30% indicated satisfaction. On the other hand, 15% were dissatisfied, 5% frustrated, and 15% neutral.
  • Regarding academic resources, 40% were content, while 25% expressed dissatisfaction and 15% were frustrated.
  • Regarding administrative services, 30% were delighted, while 20% were frustrated.
  • Regarding extracurricular activities, 70% expressed gratification, while 25% felt unhappy.
  • Overall;
    • 31% of students reported being delighted with school.
    • 24% expressed satisfaction.
    • 14% felt frustrated.
    • 19% were dissatisfied.
    • 13% remained neutral.

Tips for Using Closed-Ended Questions

Here are some tips for effectively using closed-ended questions:

  • Be Clear and Concise

Ensure that your closed-ended questions are straightforward to understand, avoiding ambiguity or confusion.

  • Use Simple Language

Keep the language of your questions simple and accessible to all respondents, regardless of their background or education level.

  • Limit the Number of Options

Provide a reasonable number of response options to prevent overwhelming responses and encourage accurate responses.

  • Offer Balanced Response Options

Ensure that the response options provided cover the full range of possible answers without bias or leading the respondent to a specific answer.

  • Randomize Response Order

If relevant, consider shuffling the order of response options to mitigate the possibility of response bias influenced by the presentation order.

  • Avoid Double-Barreled Questions

Each question should address only one specific aspect to avoid confusion and ensure clarity in responses.

  • Pilot Test Questions

Before administering your survey, pilot test your closed-ended questions with a small sample group to identify any potential issues or areas for improvement.

  • Consider Using Likert Scales

Move beyond simply agreeing/disagreeing. Likert scales empower respondents. They can choose from a range of options, reflecting their exact level of agreement or disagreement with a statement.

  • Keep Response Formats Consistent

Ensure uniformity in the response format, whether it be checkboxes or radio buttons, to enhance respondent navigation ease.

  • Mix Closed-Ended with Open-Ended Questions

Craft your survey with a mix of question formats! Include closed-ended options for selection and open-ended prompts for elaboration. This approach facilitates a comprehensive analysis by gathering both statistical data and in-depth insights. This approach gathers both numerical data and in-depth responses, providing a clearer picture.

Advantages of Closed-Ended Questions

Here are some advantages of using closed-ended questions:

  • Efficiency

Closed-ended questions facilitate swift responses, rendering them effective tools for collecting data from a broad spectrum of respondents.

  • Standardization

Closed-ended questions generate responses that maintain organization and consistency, thereby facilitating analysis and comparison.

  • Ease of Analysis

Closed-ended responses can be easily quantified and analyzed using statistical methods, allowing for straightforward interpretation.

  • Reduced Bias

Closed-ended questions reduce the likelihood of interviewer bias or influence since respondents choose from pre-established options.

  • Increased Respondent Comfort

Respondents may feel more comfortable answering closed-ended questions since they are not required to generate their responses.

  • Suitable for Sensitive Topics

Closed-ended questions prove advantageous in collecting data on sensitive subjects, offering respondents the choice to offer discreet responses.

  • Facilitation of Survey Design

By structuring surveys and questionnaires, closed-ended questions ensure that the data collection process remains clear and coherent.

  • Enhanced Data Accuracy

The provision of specific response options in closed-ended questions helps enhance data accuracy by minimizing the possibility of ambiguous or misunderstood responses.

  • Minimized Missing Data

Closed-ended questions generally necessitate respondents to choose a response, which decreases occurrences of missing data in contrast to open-ended queries.

  • Increased Response Rate

The straightforwardness and conciseness of closed-ended questions can boost response rates as they impose lesser cognitive load on participants.

Disadvantages of Closed-Ended Questions

Here are some disadvantages of using closed-ended questions:

  • Limited response options

The finite options presented in closed-ended questions can limit respondents’ ability to convey nuanced or complex perspectives.

  • Lack of depth

Closed-ended questions may yield responses that lack the depth and detail required, thus restricting the richness of the collected data.

  • Potential for bias

The predefined response options in closed-ended questions may reflect the biases or assumptions of the questionnaire designer, leading to biased results.

  • Difficulty in capturing unexpected responses

Closed-ended questions may not capture unexpected or unanticipated responses, potentially overlooking valuable insights.

FAQs

What are closed-ended questions?

Closed-ended questions are a type of survey or interview questions that offer predefined answer options. Respondents choose from specific responses, such as “yes” or “no,” multiple-choice options, or rating scales.

What are closed-ended questionnaires?

Closed-ended questionnaires are surveys or data collection instruments primarily composed of closed-ended questions. These questionnaires use specific answer choices, restricting respondents to select from the provided options. As a result, this allows for straightforward data analysis and quantification.

What are 2 examples of closed-ended questions?

  • Which color do you prefer?
    • Red
    • Blue
  • How likely are you to recommend our product to others?
    • Very Likely
    • Somewhat Likely
    • Not Sure
    • Somewhat Unlikely
    • Very Unlikely

What is a good example of a closed-ended question?

“How likely are you to recommend our product on a scale of 1 to 10?” This closed-ended question quantitatively measures customer satisfaction and the likelihood of a recommendation.

Why use closed-ended questions?

Closed-ended questions offer standardized data collection, quick analysis, and ease of response. They provide specific answer options, facilitating quantitative data gathering. As a result, they make comparisons between respondents or groups more straightforward.

Wrap Up

Closed-ended questions serve as powerful allies in the realm of efficient surveys. They streamline data collection by offering predetermined response options, ensuring standardized and concise answers.

The closed-ended questionnaire examples above showcase their versatility across various domains. From measuring customer satisfaction and conducting market research to gathering valuable employee feedback. Moreover, the structured nature of closed-ended questions allows for easy categorization and quantification of responses. This makes it easier to analyze the data and draw meaningful conclusions.

With a closed-ended questionnaire, you can obtain quantifiable data that simplifies analysis and enables easy comparison between different groups. This approach boosts response rates due to simplicity and expedites the overall research process.

When complemented with ChartExpo, the power of closed-ended questionnaires reaches new heights. ChartExpo’s user-friendly interface empowers you to transform survey data into visually stunning and insightful charts effortlessly. This breathes life into closed-ended survey responses, making data interpretation a breeze.

Go forth, armed with these examples and ChartExpo, and unlock your surveys’ full potential of closed-ended questions.

Happy surveying.

How much did you enjoy this article?

ExcelAd2
Start Free Trial!
128627

Related articles

next previous
Microsoft Excel8 min read

Excel Task Tracker Template for Smarter Task Insights

Task tracker template in Excel organizes tasks, tracks deadlines, and boosts efficiency. Learn its benefits, and explore expert tips to simplify task management.

Microsoft Excel10 min read

Invoice Tracker Template in Excel for Better Insights

An invoice tracker Excel template helps track invoices, due dates, and payments. Learn how to use this template for better financial management.

Microsoft Excel12 min read

Key Performance Indicators in Healthcare for Better Insights

Key Performance Indicators in healthcare track patient care and efficiency. Learn about these KPIs, top examples, and how to use them to improve outcomes.

Microsoft Excel10 min read

BMI Calculation Formula in Excel for Better Fitness Insights

The BMI calculation formula in Excel helps track and analyze body mass index. Explore step-by-step instructions and tips to simplify BMI tracking in Excel.

Microsoft Excel29 min read

How to Create a Tornado Chart in Excel? A Complete Guide

Click to learn how to plot a Tornado Chart in Excel using easy-to-follow steps. Also, we’ll address the following question: what is a Tornado Diagram?

ChartExpo logo

Turn Data into Visual
Stories

CHARTEXPO

  • Home
  • Gallery
  • Videos
  • Services
  • Pricing
  • Contact us
  • FAQs
  • Privacy policy
  • Terms of Service
  • Sitemap

TOOLS

  • ChartExpo for Google Sheets
  • ChartExpo for Microsoft Excel
  • Power BI Custom Visuals by ChartExpo
  • Word Cloud

CATEGORIES

  • Bar Charts
  • Circle Graphs
  • Column Charts
  • Combo Charts
  • Comparison Charts
  • Line Graphs
  • PPC Charts
  • Sentiment Analysis Charts
  • Survey Charts

TOP CHARTS

  • Sankey Diagram
  • Likert Scale Chart
  • Comparison Bar Chart
  • Pareto Chart
  • Funnel Chart
  • Gauge Chart
  • Radar Chart
  • Radial Bar Chart
  • Sunburst Chart
  • see more
  • Scatter Plot Chart
  • CSAT Survey Bar Chart
  • CSAT Survey Chart
  • Dot Plot Chart
  • Double Bar Graph
  • Matrix Chart
  • Multi Axis Line Chart
  • Overlapping Bar Chart
  • Control Chart
  • Slope Chart
  • Clustered Bar Chart
  • Clustered Column Chart
  • Box and Whisker Plot
  • Tornado Chart
  • Waterfall Chart
  • Word Cloud
  • see less

RESOURCES

  • Blog
  • Resources
  • YouTube
SIGN UP FOR UPDATES

We wouldn't dream of spamming you or selling your info.

© 2025 ChartExpo, all rights reserved.