• Home
  • Tools dropdown img
    • Spreadsheet Charts

      • ChartExpo for Google Sheets
      • ChartExpo for Microsoft Excel
    • Power BI Charts

      • Power BI Custom Visuals by ChartExpo
    • Word Cloud

  • Charts dropdown img
    • Chart Category

      • Bar Charts
      • Circle Graphs
      • Column Charts
      • Combo Charts
      • Comparison Charts
      • Line Graphs
      • PPC Charts
      • Sentiment Analysis Charts
      • Survey Charts
    • Chart Type

      • Box and Whisker Plot
      • Clustered Bar Chart
      • Clustered Column Chart
      • Comparison Bar Chart
      • Control Chart
      • CSAT Survey Bar Chart
      • CSAT Survey Chart
      • Dot Plot Chart
      • Double Bar Graph
      • Funnel Chart
      • Gauge Chart
      • Likert Scale Chart
      • Matrix Chart
      • Multi Axis Line Chart
      • Overlapping Bar Chart
      • Pareto Chart
      • Radar Chart
      • Radial Bar Chart
      • Sankey Diagram
      • Scatter Plot Chart
      • Slope Chart
      • Sunburst Chart
      • Tornado Chart
      • Waterfall Chart
      • Word Cloud
    • Google Sheets
      Microsoft Excel
  • Services
  • Pricing
  • Contact us
  • Blog
  • Support dropdown img
      • Gallery
      • Videos
      • Contact us
      • FAQs
      • Resources
    • Please feel free to contact us

      atsupport@chartexpo.com

Categories
All Data Visualizations Data Analytics Surveys
Add-ons/
  • Google Sheets
  • Microsoft Excel
  • Power BI
All Data Visualizations Data Analytics Surveys
Add-ons
  • Google Sheets
  • Microsoft Excel
  • Power BI

We use cookies

This website uses cookies to provide better user experience and user's session management.
By continuing visiting this website you consent the use of these cookies.

Ok

ChartExpo Survey


Home > Blog > Microsoft Excel

How to Create a Monthly Budget in Excel?

We know you are feeling the weight of financial stress heavy on your shoulders. But don’t worry; you’re not alone  78% of individuals living paycheck to paycheck can relate. The solution lies in learning how to create a monthly budget in Excel.

How to Create a Monthly Budget in Excel

With over 750 million users, Excel has cemented its status as the premier budgeting and financial planning tool.

Excel isn’t just a spreadsheet tool it’s a financial superhero.

In this blog post, we’ll walk through the step-by-step process of how to create a monthly budget in Excel. We’ll provide you with the tools and knowledge to manage your money effectively. From setting up a budget template to categorizing your expenses, we’ve got you covered.

Moreover, we’ll delve into tips and tricks to make your budget visually appealing and easy to understand. By the end, you’ll have the confidence to create a monthly budget in Excel that suits your lifestyle. One that helps you work towards financial stability.

So, grab your Excel spreadsheet. Let’s learn how to create a monthly budget in Excel.

Table of Content:

  1. Video Tutorial: How to Make a Monthly Budget in Excel?
  2. What is a Monthly Budget?
  3. Why Do We Use Excel for a Monthly Budget?
  4. How to Create a Monthly Budget in Excel Manually?
  5. How to Create a Monthly Budget in Excel: Step-by-Step
    1. Step # 1: Open your workbook
    2. Step #2: Select Add-in and click Insert.
    3. Step #3: Choose “Sankey Chart” from the list.
    4. Step #4: Create Chart From Selection
    5. Step #5: ChartExpo will Generate the Visuals
    6. Step #6: Click Edit and Apply a Title on the Chart
    7. Step #7: Click the pencil icon to add a Prefix.
    8. Step #8: Select And Apply color on the Chart
    9. Step #9: Your final Chart will appear
  6. Advantages of Creating a Monthly Budget in Excel
  7. Tips For Creating a Monthly Budget in Excel
  8. FAQs About Preparing a Monthly Budget
  9. Wrap Up

First…

Video Tutorial: How to Make a Monthly Budget in Excel?

What is a Monthly Budget?

Definition: A monthly budget is like a money plan for the month. Think of it as a guide for your cash, ensuring each dollar has a job. It’s not just watching where your money goes it’s telling it where to go.

Creating a spending plan helps you gain a proactive stance in managing your money. It puts you in the driver’s seat, allowing you to control your spending. This helps avoid the stress of wondering where your money went, giving you a sense of financial empowerment.

One of the unsung benefits of a monthly budget is its role as a financial safety net. Life is full of surprises, and unexpected expenses can wrench your plans. By using tools like price comparison in Excel, you can proactively create an emergency fund with monthly budget examples, providing a cushion against unforeseen circumstances.

In essence, a well-crafted monthly budget transforms the abstract concept of financial management into a tangible, achievable reality.

Why Do We Use Excel for a Monthly Budget?

Let’s find out.

  • Customization: Excel is your digital budgeting playground, empowering you to craft a plan that perfectly reflects your financial situation. Unlike a pre-made suit, you can customize everything income sources, spending habits, and most importantly, your long-term financial goals. This flexibility allows you to tailor a financial strategy that fits you like a glove, ensuring you stay on track toward achieving your financial dreams.
  • Flexibility: Life is dynamic, and so are your finances. Excel’s flexibility adapts to changes seamlessly. Whether it’s a sudden expense or a boost in income, Excel accommodates adjustments on the fly. Its dynamic nature ensures your budget stays relevant.
  • Automated calculations: Say farewell to manual number crunching; Excel automates the math. From summing up expenses to calculating savings percentages, Excel’s formulas do the heavy lifting. This automation saves time and eliminates errors, turning your budget into a precise financial orchestra.
  • Visualization: Numbers come alive with Excel’s data visualization tools. They transform data into colorful charts and graphs, offering a visual feast of your financial landscape. This turns your budget from a static list into an engaging and insightful visual story.
  • Accessibility: Excel doesn’t confine your budget to a single device. With cloud storage and mobile apps, your budget travels with you. Accessing and updating it is as easy as a few clicks, whether at home, work or on the go. This ensures your financial command center is at your fingertips whenever and wherever you need it.

How to Create a Monthly Budget in Excel Manually?

Creating a monthly budget in Excel is a straightforward process. Here’s a step-by-step guide to help you set up your budget:

  1. Open a new Excel spreadsheet.
  2. Label columns for income sources and expense categories.
  3. Input income and estimated expenses for each category.
  4. Use Excel formulas like SUM to calculate totals.
  5. Determine budget surplus or deficit by calculating the difference.
  6. Enhance clarity with bold fonts, borders, and colors.
  7. Save and regularly update the budget with actual expenses.
  8. Compare actual spending to the budget, making adjustments.
  9. Review your budget for financial progress and improvements at the end of the month.
  10. Adjust the next month’s budget for ongoing stability.

How to Create a Monthly Budget in Excel: Step-by-Step

Data analysis – a dance with complexity, a tango with confusion, and a waltz with frustration. When analyzing a monthly budget in Excel, the real magic lies in data visualization. However, Excel, while powerful, often falls short in this department. It leaves us squinting at rows and columns like perplexed detectives at a crime scene.

This is where ChartExpo swoops in like a caped hero, offering a solution to Excel’s visualization limitations. With its intuitive and dynamic visualizations, ChartExpo transforms mundane data into captivating stories. This makes the task of analyzing a monthly budget manageable but enjoyable.

So, bid farewell to Excel’s visualization woes. Embrace the enchanting world of ChartExpo for a budget analysis experience like never before.

Let’s learn how to install ChartExpo in Excel.

  1. Open your Excel application.
  2. Open the worksheet and click the “Insert” menu.
  3. You’ll see the “My Apps” option.
  4. In the Office Add-ins window, click “Store” and search for ChartExpo on my Apps Store.
  5. Click the “Add” button to install ChartExpo in your Excel.

Sample Data

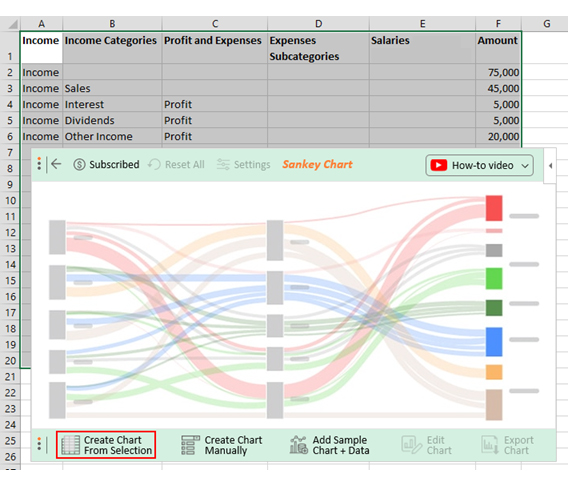
Let’s say you have the budget data on income and expenses below.

Income Income Categories Profit and Expenses Expenses Subcategories Salaries Amount
Income       75,000
Income Sales       45,000
Income Interest Profit          5,000
Income Dividends Profit          5,000
Income Other Income Profit       20,000
Sales Profit          5,000
Sales Operating Expenses       40,000
Operating Expenses Salaries and Wages       20,000
Salaries and Wages Management       10,000
Salaries and Wages Sales Team          5,000
Salaries and Wages Support Team          3,000
Salaries and Wages Administrative          2,000
Operating Expenses Rent       10,000
Operating Expenses Utilities          2,000
Operating Expenses Marketing          5,000
Marketing Online Ads          3,000
Marketing Print Ads          1,500
Marketing Social Media             500
Operating Expenses Supplies          3,000

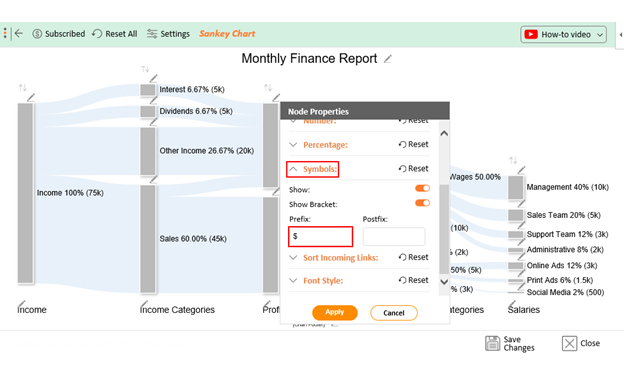
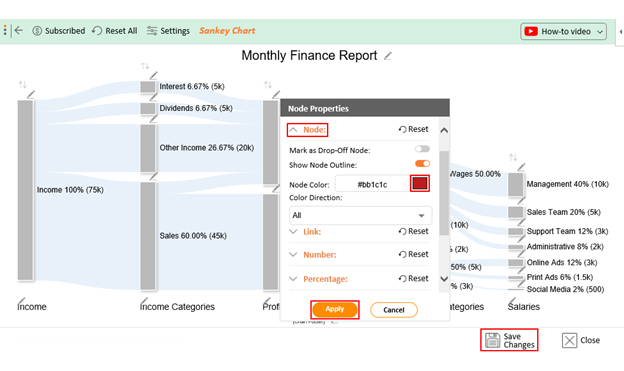
Follow these steps to create a visualization of this example of a monthly budget spreadsheet in Excel with ChartExpo.

Step # 1: Open your workbook and select My Apps.

insert chartexpo in excel

Step #2: Select Add-in and click Insert.

open chartexpo in excel

Step #3: Choose “Sankey Chart” from the list.

search sankey chart in excel

Step #4: Create Chart From Selection

Create Chart From Selection for Learning How to Create a Monthly Budget in Excel

Step #5: ChartExpo will generate the visualization.

Edit Chart After Learning How to Create a Monthly Budget in Excel

Step #6: Click Edit and Apply a Title on the Chart

Add Title After Learning How to Create a Monthly Budget in Excel

Step #7: Click the pencil icon to add a Prefix.

Add Prefix After Learning How to Create a Monthly Budget in Excel

Step #8: Select And Apply color on the Chart

Add Node Color After Learning How to Create a Monthly Budget in Excel

Step #9: Your final Chart will appear

Final How to Create a Monthly Budget in Excel

Insights

  • Income Breakdown

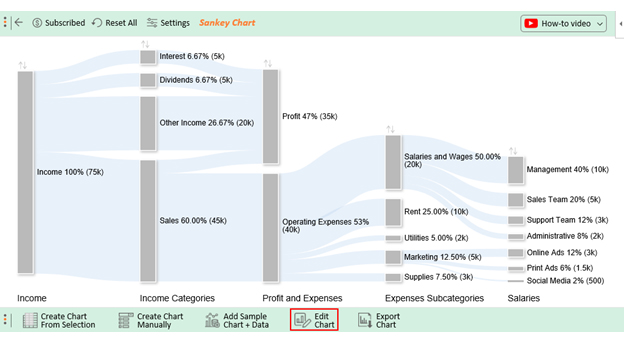
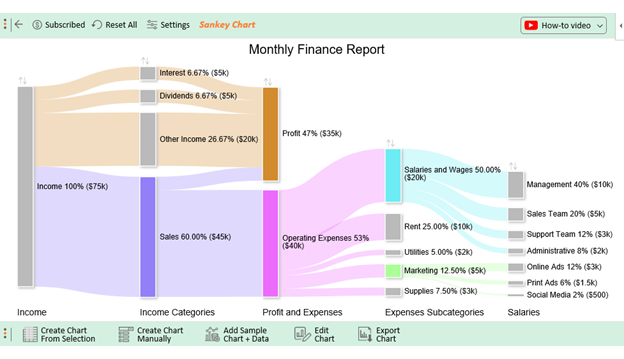
The total monthly income is $75,000, with sales leading at $45,000. Interest and dividends contribute $5,000, while other sources make up $20,000. This provides a clear picture of the main income contributors.

  • Expense Overview

Total expenses sum up to $40,000, predominantly in operating expenses. Salaries and wages within operating expenses account for the largest portion, totaling $20,000, covering rent, utilities, marketing, and supplies.

  • Salary Details

A detailed salary breakdown reveals that the “Management” category has the highest expense at $10,000. “Sales Team” follows at $5,000, “Support Team” at $3,000, and “Administrative” at $2,000. This breakdown sheds light on the distribution of labor costs among various roles.

  • Marketing Expense Categories

Marketing expenses amount to $5,000, distributed across online ads ($3,000), print ads ($1,500), and social media ($500).

  • Profit Visualization

The Sankey Diagram visually illustrates a profit of $35,000 ($75,000 income minus $40,000 expenses). Sales contribute the most to this profit, totaling $5,000.

Advantages of Creating a Monthly Budget in Excel

Creating a monthly budget in Excel isn’t just about numbers; it’s about empowerment, customization, and efficiency. Let’s explore the advantages that make Excel the superhero of budgeting.

  • Customization: With Excel, you can design a budget that mirrors your unique needs and goals. From income sources to spending categories, it lets you mold the budgeting process to match your life. This ensures every dollar has a purpose tailored just for you.
  • Flexibility: Life is dynamic, and so should your budget. Excel provides the flexibility to adapt as your financial landscape changes. Unexpected expense? Income boost? No problem. You can tweak and refine your budget on the fly, ensuring it stays relevant and effective.
  • Automated calculations: Say goodbye to manual number crunching. Excel’s formula wizardry automates calculations, turning complex financial math into a seamless dance. It’s like having a financial assistant tirelessly working behind the scenes, ensuring accuracy and saving precious time.
  • Visualization: Numbers become a story with Excel’s visualization prowess. Financial graphs, charts, and colorful tables turn your budget from a mundane spreadsheet into a visual masterpiece. You can easily spot trends, track progress, and identify areas for improvement.
  • Accessibility: Budgeting on the go? Excel’s got your back. With cloud storage and mobile apps, your budget travels with you. Accessing and updating your budget is a breeze whether at home, work, or sipping coffee at a cafe. Excel ensures your financial command center is at your fingertips whenever and wherever you need it.

Tips For Creating a Monthly Budget in Excel

Creating a monthly budget isn’t a one-size-fits-all task; it’s a personalized, dynamic strategy. These best practices form the pillars of effective budgeting, transforming your financial life from chaos to control.

  1. Track your income: This involves understanding how to calculate gross monthly income, whether you receive a regular salary or have multiple income sources. This will empower you to set up a successful budget.
  2. List your expenses: This is like the backbone of your financial plan, ensuring everything runs smoothly. Start by understanding the difference between fixed vs. variable costs. Fixed costs are expenses that stay the same each month, like rent or a phone bill. Variable costs, on the other hand, fluctuate based on your spending, like groceries or entertainment.
  3. Differentiate needs vs. wants: Draw a line in the sand to distinguish between needs and wants. Essentials like housing and groceries deserve priority. Wants, while tempting, should fit into the budget after securing the necessities. This clarity ensures a balanced and realistic approach to spending.
  4. Set realistic goals: Dream big, plan smart, and set realistic financial goals. Whether saving for a vacation or paying off debts, establish clear and achievable objectives. Realistic goals provide motivation and direction, transforming your budget into a roadmap toward your financial aspirations.
  5. Allocate funds wisely: Play your cards right and allocate funds strategically. Prioritize essential categories, ensuring they receive their share before indulging in discretionary spending. This methodical allocation keeps your budget balanced and aligns with your financial priorities.
  6. Monitor and adjust regularly: Life evolves, and so should your financial plan. Regular check-ins allow you to identify and address any deviations promptly.
  7. Build in savings: Allocate a portion of your income to savings from the get-go. Treat it as a non-negotiable expense, ensuring a financial safety net for emergencies and future goals.
  8. Plan for irregular expenses: Expect the unexpected plan for irregular expenses. Whether it’s annual subscriptions or occasional repairs, anticipate these costs and allocate funds accordingly. This foresight prevents financial surprises from derailing your budget.
  9. Use tools and technology: Embrace efficiency and leverage tools and technology. Budgeting apps and software streamline the process, automating calculations and providing real-time insights. Technology turns your budget from a static list into a dynamic, interactive financial ally.
  10. Review and reflect: Look back to move forward regularly and review your budget. Reflect on your spending habits, celebrate achievements, and learn from challenges. This ongoing evaluation ensures continuous improvement, making your budget a living document that evolves with your financial journey.

FAQs About Preparing a Monthly Budget

How do I create a simple monthly budget in Excel?

  1. Open Excel and create a new spreadsheet.
  2. Label columns for income and expenses.
  3. Input your sources of income and estimated expenses.
  4. Use the SUM formula to calculate totals.
  5. Format for clarity with bold fonts and colors.
  6. Save and update regularly.

How do I create a budget for the month?

  1. List income sources.
  2. Detail expense categories.
  3. Assign amounts to each category.
  4. Calculate total income and expenses.
  5. Identify surplus or deficit.
  6. Adjust as needed.
  7. Save and review monthly.
  8. Continuously refine for financial control.

Wrap Up

Learning how to create a monthly budget in Excel isn’t just a skill; it’s a financial superpower. Excel’s customization allows you to tailor a budget that aligns with your unique needs and goals. Its flexibility adapts to the twists and turns of your financial journey, ensuring your budget remains relevant.

The magic lies in automated calculations no more number-crunching stress; Excel does it for you accurately and effortlessly.

Moreover, Excel transforms your budget into a visual feast. Bold fonts, borders, and colors turn mundane numbers into a dynamic, engaging story of your financial landscape.

Accessibility is key; with cloud storage and mobile apps, your budget is your companion wherever life takes you.

The monthly budget in Excel is more than a static plan; it’s a living document. Regular updates, comparisons with actual spending, and adjustments ensure it evolves with your financial reality. It becomes your financial ally, offering insights, control, and a roadmap to your goals.

Are you saving for a dream vacation, tackling debts, or building an emergency fund? Excel empowers you to turn these aspirations into achievable milestones. Your budget becomes a tool of financial transformation, shifting from chaos to clarity, from uncertainty to control.

So, embrace Excel and ChartExpo, customize your financial superhero, and embark on a journey of financial success. Your budget isn’t just about numbers. It’s your strategic partner in pursuing a financially sound and fulfilling life.

How much did you enjoy this article?

ExcelAd1
Start Free Trial!
134123

Related articles

next previous
Microsoft Excel13 min read

Excel for Teachers for Insightful Preparation

Excel for teachers simplifies grading, tracks attendance, and organizes data. Find its key features, expert tips, and how ChartExpo enhances data visualization.

Microsoft Excel14 min read

How to Make a Cash Flow Diagram in Excel?

Learn how to make a Cash Flow Diagram in Excel. It will help you learn to visualize and analyze inflows and outflows of your business cash flow.

Microsoft Excel11 min read

Succession Planning Template for Long-Term Success

Succession Planning Templates help businesses prepare for leadership changes. Learn to create, analyze, and use them for seamless transitions and growth.

Microsoft Excel10 min read

Grant Tracking Spreadsheet: Insights Made Easy

A Grant Tracker Spreadsheet helps track funding, deadlines, and expenses in Excel. Learn to use grant tracking templates, analyze data, and stay organized.

Microsoft Excel10 min read

What is Excel Software Used for: A Complete Guide

What is Excel software used for? It organizes, analyzes, and manages data. Explore its workplace applications, benefits, and top tips for efficiency and more.

ChartExpo logo

Turn Data into Visual
Stories

CHARTEXPO

  • Home
  • Gallery
  • Videos
  • Services
  • Pricing
  • Contact us
  • FAQs
  • Privacy policy
  • Terms of Service
  • Sitemap

TOOLS

  • ChartExpo for Google Sheets
  • ChartExpo for Microsoft Excel
  • Power BI Custom Visuals by ChartExpo
  • Word Cloud

CATEGORIES

  • Bar Charts
  • Circle Graphs
  • Column Charts
  • Combo Charts
  • Comparison Charts
  • Line Graphs
  • PPC Charts
  • Sentiment Analysis Charts
  • Survey Charts

TOP CHARTS

  • Sankey Diagram
  • Likert Scale Chart
  • Comparison Bar Chart
  • Pareto Chart
  • Funnel Chart
  • Gauge Chart
  • Radar Chart
  • Radial Bar Chart
  • Sunburst Chart
  • see more
  • Scatter Plot Chart
  • CSAT Survey Bar Chart
  • CSAT Survey Chart
  • Dot Plot Chart
  • Double Bar Graph
  • Matrix Chart
  • Multi Axis Line Chart
  • Overlapping Bar Chart
  • Control Chart
  • Slope Chart
  • Clustered Bar Chart
  • Clustered Column Chart
  • Box and Whisker Plot
  • Tornado Chart
  • Waterfall Chart
  • Word Cloud
  • see less

RESOURCES

  • Blog
  • Resources
  • YouTube
SIGN UP FOR UPDATES

We wouldn't dream of spamming you or selling your info.

© 2025 ChartExpo, all rights reserved.