• Home
  • Tools dropdown img
    • Spreadsheet Charts

      • ChartExpo for Google Sheets
      • ChartExpo for Microsoft Excel
    • Power BI Charts

      • Power BI Custom Visuals by ChartExpo
    • Word Cloud

  • Charts dropdown img
    • Chart Category

      • Bar Charts
      • Circle Graphs
      • Column Charts
      • Combo Charts
      • Comparison Charts
      • Line Graphs
      • PPC Charts
      • Sentiment Analysis Charts
      • Survey Charts
    • Chart Type

      • Box and Whisker Plot
      • Clustered Bar Chart
      • Clustered Column Chart
      • Comparison Bar Chart
      • Control Chart
      • CSAT Survey Bar Chart
      • CSAT Survey Chart
      • Dot Plot Chart
      • Double Bar Graph
      • Funnel Chart
      • Gauge Chart
      • Likert Scale Chart
      • Matrix Chart
      • Multi Axis Line Chart
      • Overlapping Bar Chart
      • Pareto Chart
      • Radar Chart
      • Radial Bar Chart
      • Sankey Diagram
      • Scatter Plot Chart
      • Slope Chart
      • Sunburst Chart
      • Tornado Chart
      • Waterfall Chart
      • Word Cloud
    • Google Sheets
      Microsoft Excel
  • Services
  • Pricing
  • Contact us
  • Blog
  • Support dropdown img
      • Gallery
      • Videos
      • Contact us
      • FAQs
      • Resources
    • Please feel free to contact us

      atsupport@chartexpo.com

Categories
All Data Visualizations Data Analytics Surveys
Add-ons/
  • Google Sheets
  • Microsoft Excel
  • Power BI
All Data Visualizations Data Analytics Surveys
Add-ons
  • Google Sheets
  • Microsoft Excel
  • Power BI

We use cookies

This website uses cookies to provide better user experience and user's session management.
By continuing visiting this website you consent the use of these cookies.

Ok

ChartExpo Survey


Home > Blog > Microsoft Excel

Optimizing Budgets with Price Comparison Template in Excel

Are you tired of feeling like you got ripped off every time you make a purchase? Do you wish there was an easy way to compare prices and find the best deals?

Look no further.

I’ll show you how to create a price comparison template in Excel that will change your shopping game.

Price Comparison Template In Excel

Now, I know what you’re thinking. Excel? Isn’t that just for number-crunching and boring spreadsheets?

Ah, my dear reader, you underestimate the power of this software. Excel allows you to compare product prices effortlessly and find the best value for your money. All this with a few clicks.

You’ll no longer frantically search through websites and flyers to find the lowest price. Or rely on your memory to remember which store had the better deal. With your handy-dandy price comparison template, you’ll have all the information you need right at your fingertips. It’s like having a shopping assistant without the hefty price tag.

Let’s dive in and create your price comparison masterpiece.

Table of Content:

  1. What is a Price Comparison Template?
  2. Why Do We Use a Price Comparison Template in Excel?
  3. Features of a Price Comparison Template
  4. Examples of Price Comparison Template
    1. Basic Price Comparison Template
    2. Detailed Product Comparison Template
    3. E-commerce Price Comparison Template
    4. Monthly Subscription Price Comparison Template
    5. Travel Price Comparison Template
  5. Benefits of Using a Price Comparison Template Excel
  6. How to Create a Price Comparison Template in Excel?
  7. How to Analyze an Excel Price Comparison Template? 
  8. How to Download Price Comparison Excel Template?
  9. How to Use the Cost Comparison Template in Excel?
  10. Price Comparison Template in Excel FAQs
  11. Wrap Up

What is a Price Comparison Template?

Definition: A price comparison template is a tool used to compare prices of products or services from different sources. It organizes data into columns, typically including product names and their respective prices.

This template aids decision-making by allowing you to analyze and contrast prices easily, whether through a stacked waterfall chart or other visualizations. Consequently, you can find the best deals or make cost-effective choices.

Why Do We Use a Price Comparison Template in Excel?

We use a price comparison template for various reasons, each contributing to better decision-making and efficient resource management:

  • Informed decision-making: First and foremost, this template is your guide to enlightenment. It illuminates the path to smart choices by allowing you to compare prices from different areas. Consequently, you can select the most cost-effective deal that meets your requirements.
  • Cost efficiency: It’s like having a magical magnifying glass for your gold coins. You can uncover the hidden cost efficiency gems, ensuring every coin spent is worth its weight in savings. This is especially beneficial for budget-conscious consumers and organizations aiming to maximize resources.
  • Budget planning: Price comparison templates are essential tools for budget planning. They assist in tracking expenses and ensuring that purchases align with financial goals, preventing overspending.
  • Time-saving: Manually analyzing competitors’ prices from various sources can be time-consuming. Templates streamline the process, saving valuable time that can be redirected towards other tasks or decision-making processes.
  • Vendor evaluation: For the business-minded among us, this template is your sage advisor. It lets you weigh different vendors’ offerings, helping you choose those worthy of your alliance.
  • Transparency: No more hidden fees or sneaky charges. This template unveils the truth, ensuring your financial dealings are as transparent as crystal waters.
  • Consistency: To err is human, but you’ll be consistently wise with the template as your guide. It keeps you on track, ensuring you evaluate every option with the same critical eye. Consequently, this consistency enhances the reliability of the decision-making process.

Features of a Price Comparison Template

  1. Product Description: Details of each item being compared.
  2. Pricing Information: Price listings from various vendors.
  3. Discounts: Section for noting discounts and promotions.
  4. Vendor Ratings: Ratings or reviews of each vendor.
  5. Shipping Costs: Additional fees for shipping and handling.
  6. Availability: Stock status for each product.
  7. Total Cost Calculation: Automated total cost calculations.
  8. Notes Section: Space for comments or observations.
  9. Visual Comparisons: Charts or graphs for price differences.
  10. User-Friendly Layout: Organized design for easy navigation.

Examples of Price Comparison Template

  • Basic Price Comparison Template

A straightforward layout that lists products and their prices from different vendors, allowing users to quickly identify the best deals.

  • Detailed Product Comparison Template

Includes additional columns for specifications, features, and customer ratings, providing a comprehensive overview of each product alongside its price.

  • E-commerce Price Comparison Template

Tailored for online shoppers, this template compares prices from various online retailers, focusing on shipping costs and delivery options.

  • Monthly Subscription Price Comparison Template

Ideal for assessing subscription services, this template lists pricing, features, and terms for different monthly services like streaming or software.

  • Travel Price Comparison Template

Designed for travelers, this template compares prices for flights, hotels, and vacation packages, helping users find the best travel deals.

Benefits of Using a Price Comparison Template Excel

Using a price comparison template in Excel offers a treasure trove of benefits:

  • Efficient Time Management

A price comparison template in Excel is like a time-turner from the wizarding world, helping you save precious hours. You no longer need to sift through price lists manually. It does it for you, freeing your time for more critical tasks.

  • Budget Management

A well-crafted template acts as your financial compass. It keeps you on course, ensuring your spending aligns with your budget and long-term financial goals examples. Spotting areas where you can save or allocate resources more effectively becomes easier.

  • Transparency

Transparency is the cloak of truth in the world of finance. The template lifts the veil on costs, revealing every detail. No more hidden fees or unexpected charges; everything is laid bare for your scrutiny.

  • Customization

One size doesn’t fit all, and your financial reports need are unique. The template is your chameleon, adapting to your specific requirements. You can tailor it to your heart’s content, ensuring it suits your individual or business needs.

  • Historical Tracking

The template is your time machine, allowing you to journey back in time and review past decisions. This historical tracking feature helps you identify trends, spot fluctuations, and learn from your financial history, making future decisions even wiser.

  • Data-driven Insights

In a world awash with data, the Excel template for price comparison is your oracle. It transforms raw information into actionable insights. Thus, you can make informed decisions that lead to cost savings, investment opportunities, and smarter financial strategies.

How to Create a Price Comparison Template in Excel?

Follow these simple steps to create an efficient Price Comparison Template in Microsoft Excel:

Step 1: Open a New Excel Spreadsheet

  • Launch Microsoft Excel and open a new worksheet.
  • Rename the sheet for easy reference (e.g., Price Comparison).

Step 2: Create Column Headers

  • In Row 1, add the following headers:
    • A1: Product Name
    • B1: Store/Vendor
    • C1: Price
    • D1: Discount (if applicable)
    • E1: Final Price (after discount)

Step 3: Input Product and Pricing Data

  • Enter product details and their prices from different stores.
  • Include discounts if available.

Step 4: Use Formulas for Automatic Calculations

  • Apply the formula to calculate the Final Price: =C2-(C2*D2/100)

Step 5: Apply Conditional Formatting

  • Highlight the lowest price for each product using Conditional Formatting:
    • Select the Price Column (C2:C100) → Click Conditional Formatting → Choose “Highlight Cells Rules” → Select “Lowest Value”.

Step 6: Insert a Chart for Visual Comparison

  • Select the Product and Price columns → Go to Insert → Column Chart to visualize price differences.

Step 7: Save and Reuse the Template

  • Save the file as “Price_Comparison_Template.xlsx” for future use.
  • Update it regularly to track changing prices.

How to Analyze an Excel Price Comparison Template?

In the thrilling world of data, visualizations are the unsung heroes. But our trusty sidekick, Excel, falls short in data visualization. This is where ChartExpo swoops in to rescue your spreadsheet from the clutches of dullness, bringing vibrant visualizations like the Sunburst Chart, Box and Whisker plot, and many others.

Let’s learn how to install ChartExpo in Excel.

  1. Open your Excel application.
  2. Open the worksheet and click the “Insert” menu.
  3. You’ll see the “My Apps” option.
  4. In the office Add-ins window, click “Store” and search for ChartExpo on the Apps Store.
  5. Click the “Add” button to install ChartExpo in Excel.

ChartExpo charts are available both in Google Sheets and Microsoft Excel. Please use the following CTA’s to install the tool of your choice and create beautiful visualizations in a few clicks in your favorite tool.

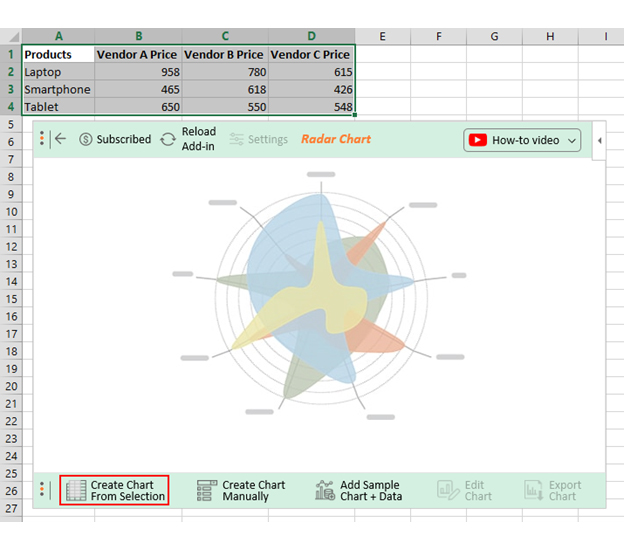
Let’s say you have data on vendors’ prices, as shown below.

Products Vendor A Price Vendor B Price Vendor C Price
Laptop 958 780 615
Smartphone 465 618 426
Tablet 650 550 548

You want to compare the prices using an Excel template to determine the best vendor to work with. Follow the steps below to learn how to create a price comparison template in Excel using different types of comparison charts with ChartExpo and glean insights. In the following example, we will be using a Radar Graph.

  • To get started with ChartExpo, install ChartExpo in Excel.
  • Now Click on My Apps from the INSERT menu.
insert chartexpo in excel
  • Choose ChartExpo from My Apps, then click Insert.
open chartexpo in excel
  • Once it loads, choose the “Radar Chart” from the charts list.
search radar chart in excel
  • Click the “Create Chart From Selection” button after selecting the data from the sheet, as shown.
Create Chart From Selection ce457
  • ChartExpo will generate the visualization below for you.
Price Comparison Template In Excel Design
  • If you want to have the chart’s title, click Edit Chart, as shown in the above image.
  • Click the pencil icon next to the Chart Header to change the title.
  • It will open the properties dialog. Under the Text section, you can add a heading in Line 1 and enable Show.
  • Give the appropriate title of your chart and click the Apply button.
Apply Tittle on Chart ce457
  • Let’s add the Prefix (e.g., $ sign) in the chart.
  • Click the highlighted pencil icon. Expand the “Label” properties to add the Prefix value (e.g., $ sign) and click the “Apply” button.
  • Click the “Save Changes” button to persist the changes.
Apply Label on Chat ce457
  • Your final chart will appear below.
Final Price Comparison Template In Excel

Insights

Price Variability

  • Vendor A has competitive smartphone pricing but offers the highest prices for laptops and tablets.
  • Vendor B has relatively high prices for smartphones.
  • Vendor C consistently offers the lowest prices for all three product categories.

Product Preference

  • Vendor C might be the preferred option for customers looking for budget-friendly choices for laptops, smartphones, and tablets.
  • Customers who prioritize brand reputation and specific features may choose Vendor A, even though it has a higher price tag.

Price Comparison Strategy

Vendor B’s pricing strategy is inconsistent, as they charge high prices for smartphones but offer low prices for laptops and tablets.

How to Download Price Comparison Excel Template?

1. Install ChartExpo in Excel

First, ensure that you have installed the ChartExpo add-in for Excel. You can find it in the Microsoft AppSource or install it directly from the Excel add-ins menu.

2. Open ChartExpo

Once installed, open Excel and navigate to the “Insert” tab. From there, click on “My Apps” and select ChartExpo.

3. Select Price Comparison Chart

In the ChartExpo interface, browse through the available charts and select the “Price Comparison Chart” template.

4. Customize the Template

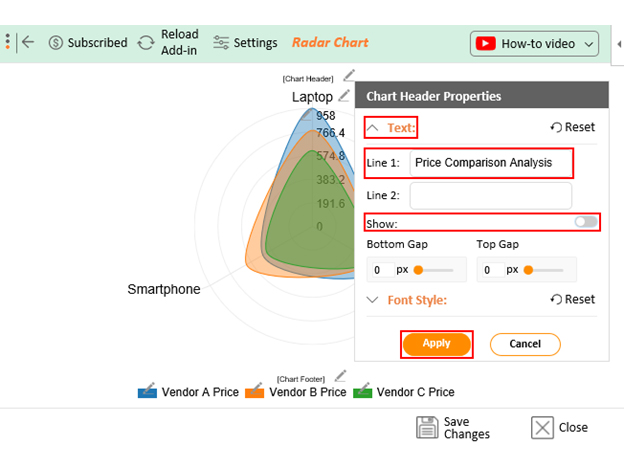
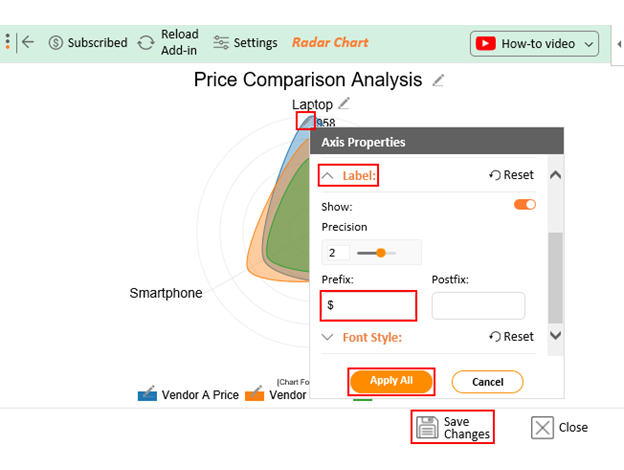
Enter your data into the provided fields and customize the template based on your specific needs. You can adjust labels, categories, and visual elements.

5. Download the Template

After customizing the template, click on the download or export option to save your Price Comparison Template as an Excel file or image.

How to Use the Cost Comparison Template in Excel?

  1. Input Costs: Begin by entering the costs of different items or services you wish to compare. These can include categories like product costs, shipping, or service fees.
  2. Add Comparison Criteria: Define the criteria you’ll use for the comparison, such as price, quality, or delivery time. Each criterion should be relevant to the items being evaluated.
  3. Analyze Results: The template will generate a comparison table or chart that highlights differences across your selected criteria, helping you identify the best option.
  4. Adjust Inputs: Update any values or criteria as needed to fine-tune your analysis.

Price Comparison Template in Excel FAQs

What is a price comparison template in Excel, and why would I use one?

A price comparison template in Excel is a pre-formatted spreadsheet that helps you organize and compare prices from different vendors or suppliers. It’s a valuable tool for businesses and individuals who want to:

  • Make informed purchasing decisions: By visually comparing prices, you can quickly identify the best deals and save money.
  • Track price changes over time: Monitor price fluctuations and identify trends to negotiate better deals or make timely purchases.

What is the purpose of using a Price Comparison Template in Excel?

The Price Comparison Template in Excel serves as a powerful tool to systematically compare prices of products or services from different sources. It aids in making informed decisions by organizing data, allowing users to find the best deals or make cost-effective choices effortlessly.

What is the formula for price comparison?

To compare prices in Excel;

  1. Subtract the old price from the new one.
  2. Divide by the old price.
  3. Multiply by 100 for a percentage change.

Use the formula below;

=((New Price – Old Price) / Old Price) * 100

Wrap Up

Crafting a price comparison template in Excel empowers you with a potent tool for informed decision-making. We’ve unveiled the template’s magic in organizing data efficiently, saving time, and promoting budget-conscious choices.

This template isn’t just a spreadsheet; it’s a financial compass guiding you through the labyrinth of pricing options. It brings transparency to your decisions, helps you manage budgets, and provides historical insights for future planning. With customization at your fingertips, you can tailor it to your unique needs.

Let’s not forget the world of data visualization. While Excel is a trusty companion, it does fall short in this realm. That’s where ChartExpo comes to the rescue, infusing life and clarity into your price comparison data.

Conclusively, a price comparison template is crucial for shoppers and business owners to find the best deals. It’s a passport to financial clarity and a bridge to more innovative, cost-effective choices. Harness its power, and confidently embark on your journey to financial mastery.

How much did you enjoy this article?

ExcelAd2
Start Free Trial!
130381

Related articles

next previous
Microsoft Excel13 min read

Excel for Teachers for Insightful Preparation

Excel for teachers simplifies grading, tracks attendance, and organizes data. Find its key features, expert tips, and how ChartExpo enhances data visualization.

Microsoft Excel14 min read

How to Make a Cash Flow Diagram in Excel?

Learn how to make a Cash Flow Diagram in Excel. It will help you learn to visualize and analyze inflows and outflows of your business cash flow.

Microsoft Excel11 min read

Succession Planning Template for Long-Term Success

Succession Planning Templates help businesses prepare for leadership changes. Learn to create, analyze, and use them for seamless transitions and growth.

Microsoft Excel10 min read

Grant Tracking Spreadsheet: Insights Made Easy

A Grant Tracker Spreadsheet helps track funding, deadlines, and expenses in Excel. Learn to use grant tracking templates, analyze data, and stay organized.

Microsoft Excel10 min read

What is Excel Software Used for: A Complete Guide

What is Excel software used for? It organizes, analyzes, and manages data. Explore its workplace applications, benefits, and top tips for efficiency and more.

ChartExpo logo

Turn Data into Visual
Stories

CHARTEXPO

  • Home
  • Gallery
  • Videos
  • Services
  • Pricing
  • Contact us
  • FAQs
  • Privacy policy
  • Terms of Service
  • Sitemap

TOOLS

  • ChartExpo for Google Sheets
  • ChartExpo for Microsoft Excel
  • Power BI Custom Visuals by ChartExpo
  • Word Cloud

CATEGORIES

  • Bar Charts
  • Circle Graphs
  • Column Charts
  • Combo Charts
  • Comparison Charts
  • Line Graphs
  • PPC Charts
  • Sentiment Analysis Charts
  • Survey Charts

TOP CHARTS

  • Sankey Diagram
  • Likert Scale Chart
  • Comparison Bar Chart
  • Pareto Chart
  • Funnel Chart
  • Gauge Chart
  • Radar Chart
  • Radial Bar Chart
  • Sunburst Chart
  • see more
  • Scatter Plot Chart
  • CSAT Survey Bar Chart
  • CSAT Survey Chart
  • Dot Plot Chart
  • Double Bar Graph
  • Matrix Chart
  • Multi Axis Line Chart
  • Overlapping Bar Chart
  • Control Chart
  • Slope Chart
  • Clustered Bar Chart
  • Clustered Column Chart
  • Box and Whisker Plot
  • Tornado Chart
  • Waterfall Chart
  • Word Cloud
  • see less

RESOURCES

  • Blog
  • Resources
  • YouTube
SIGN UP FOR UPDATES

We wouldn't dream of spamming you or selling your info.

© 2025 ChartExpo, all rights reserved.