Categories
Are you tired of manually tracking your business expenses? Do you find yourself buried under a mountain of receipts and spreadsheets?


Fear not.
The expense report template in Excel is here to save the day – and your sanity.
Here, I’ll show you how to create an expense report in Excel and streamline your accounting process.
Let’s start with a case study of a small business that overcame turmoil and found order.
The team at a small marketing agency was struggling to keep track of their business expenses. With multiple clients and projects to manage, their accounting process was a mess of receipts and spreadsheets. That is, until they discovered the expense report template in Excel.
After customizing the template to fit their needs, the team could easily track every expense. They could also categorize the expenses by project and client. The built-in formulas and charts enabled them to calculate, monitor expenses, and identify areas of overspending.
Thanks to this, the small business was able to streamline its accounting process. Consequently, saves countless hours of manual tracking.
Definition: An Expense Report Template in Excel is a preformatted spreadsheet designed to log, organize, and monitor business expenses. It typically includes columns for the date, expense category, amount, payment method, and receipt details.
This template simplifies tracking costs, supports accurate reimbursements, and helps maintain clear financial records for budgeting and reporting.
An Excel Expense Report Template is essential for organizations to maintain financial transparency, track expenditures, and ensure compliance with budgeting policies. Here’s why you need one:
You should use an expense report format in Excel whenever you need to track and organize spending in a clear, structured way. Common situations include:
An Excel expense report template is useful for anyone who needs to track and manage spending in an organized way, including:
There are different types of expense report Excel templates, depending on the nature and the submission frequency. The three main types are one-time, recurring, and long-term expense reports. Additionally, a price comparison template can be useful for evaluating costs across different vendors, helping to ensure that you are making the most cost-effective choices.
As the name implies, a one-time expense report documents expenses that only happen once. An example would be:
Recurring expense reports track regular expenses, such as monthly subscriptions or utility bills. By using these reports, you can better understand your regular expenses. Consequently, identify areas where you can cut costs or find more efficient ways to spend money.
Long-term expense reports track expenses over an extended time, such as yearly or quarterly. These reports usually include regular expenses like rent, utilities, and salaries. You can spot trends in your spending patterns by looking at long-term expense reports. As a result, decide where to devote resources in the future.
Expense report templates have various purposes, such as personal, business, or financial management. Some common examples of expense reports include:
A monthly expense report offers a thorough summary of expenditures for a specific month. Monthly expense reports usually contain the following:
A small business expense report records expenses incurred by employees while performing their necessary job duties. It keeps track of spending within the whole company, a department, or on a project.
A Personal Expense Report template in Excel tracks expenses incurred for personal endeavors, such as entertainment, hobbies, and clothing, especially when following performance-based budgeting. It helps in managing personal finances and identifying areas of overspending.
A quarterly expense report tracks expenses that occur over three months. Examples of such include business expenses, project expenses, or personal expenses. This report helps in analyzing spending patterns and identifying areas of cost savings.
A Travel Expense Report Template in Excel helps businesses track and manage travel-related costs efficiently. It includes sections for employee details, trip purpose, expense categories, and receipt attachments. With a structured format, it simplifies reimbursement processing and financial reporting.
Start by opening a blank Excel file and setting up a structured format for your expense report. Name the sheet appropriately, such as “Travel Expenses” or “Business Expenses.”
Include essential headers like Date, Expense Category, Description, Amount, Payment Method, and Receipt Attached. These columns help categorize expenses clearly for easy tracking and reporting.
Use Excel formulas like =SUM(range) to automatically calculate total expenses. You can also use separate sections for subtotal calculations based on different expense categories.
Apply bold headers, borders, and conditional formatting to highlight key expenses or exceed budget limits. Using drop-down lists for categories and payment methods can improve accuracy.
Save the file as an Excel template (.xltx) so it can be reused for multiple trips or reporting periods. You can also lock specific cells to prevent accidental changes while keeping entry fields editable.
For business owners or employees, we can also utilize a Waterfall chart to track expenses, which is crucial for effective fund management. Creating expense reports in Excel is one of the most effective methods for accomplishing this. But it can be challenging, particularly when there are numerous expenses to monitor.
That’s where ChartExpo comes in.
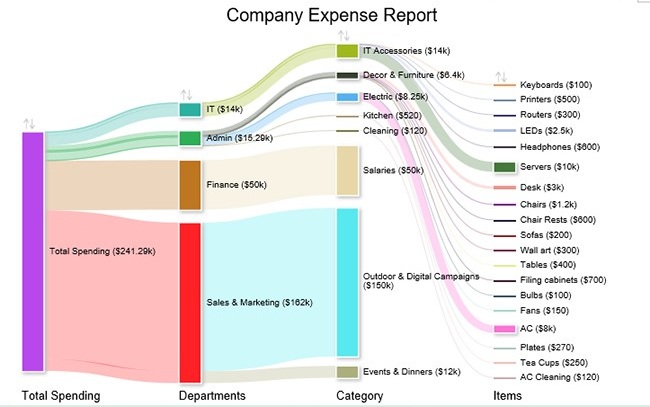
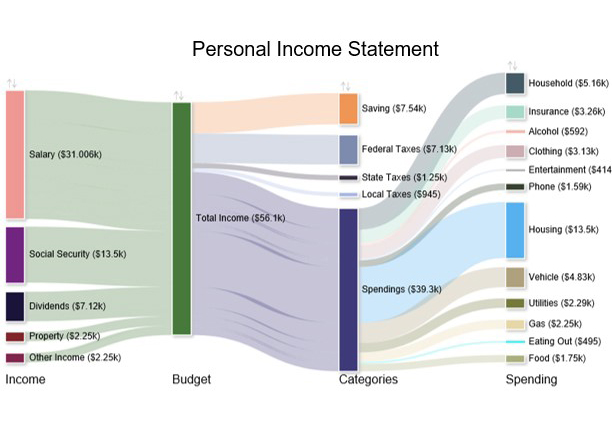
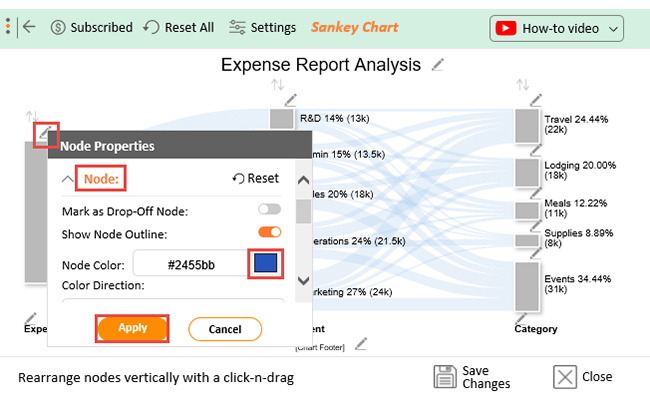
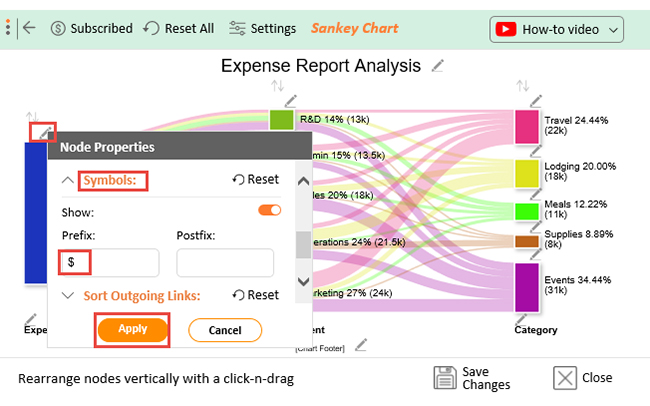
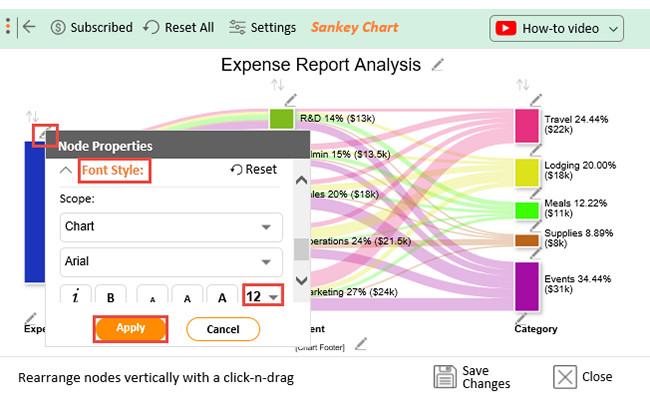
ChartExpo is a user-friendly add-in for Excel that allows you to create insightful charts and graphs, including a Sankey chart in Excel, to visualize how funds flow across categories. It not only presents your data in a visually appealing way but also provides valuable insights into your spending habits.
Why ChartExpo?
How to Install ChartExpo in Excel?
ChartExpo charts and graphs are available both in Google Sheets and Microsoft Excel. Please use the following CTA’s to install the tool of your choice and create interactive visualizations in a few clicks in your favorite tool.
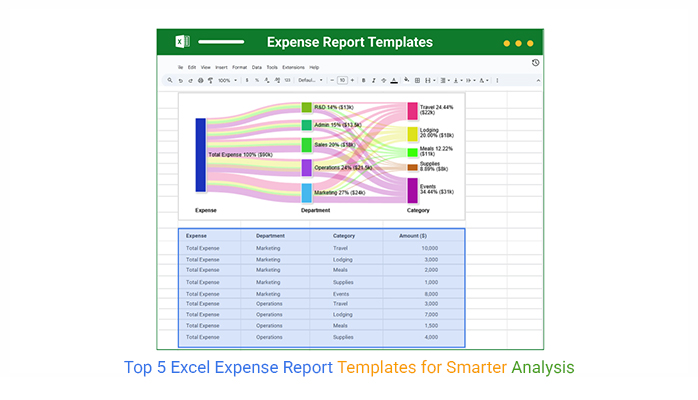
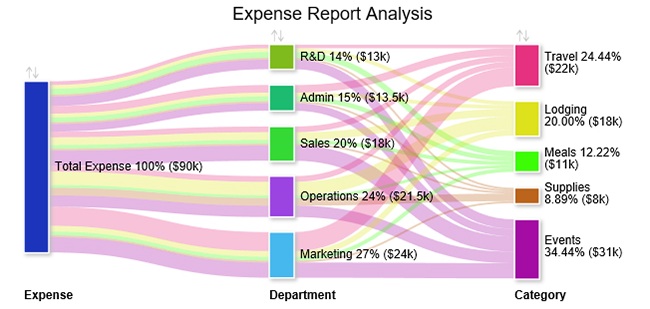
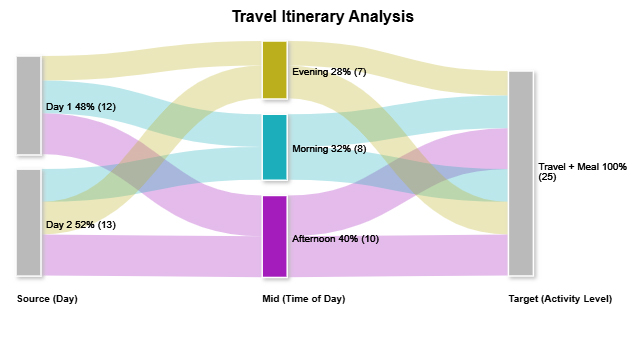
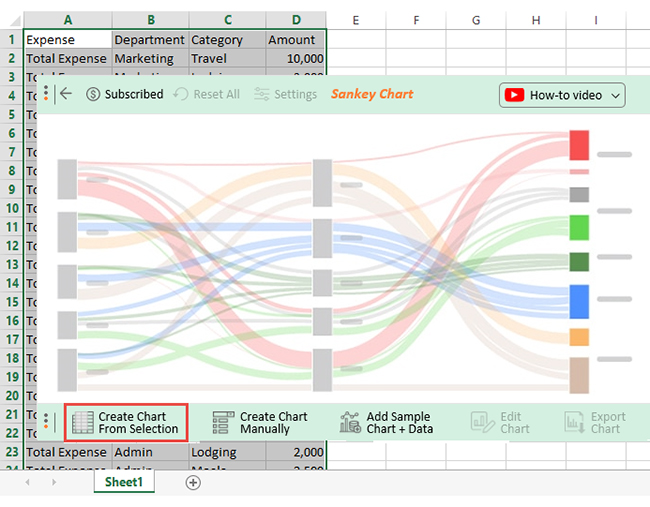
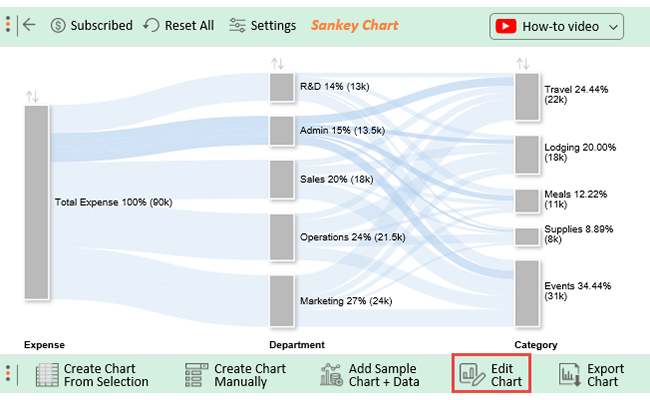
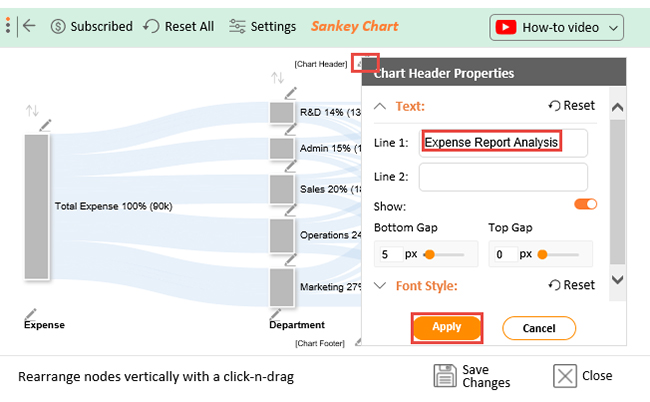
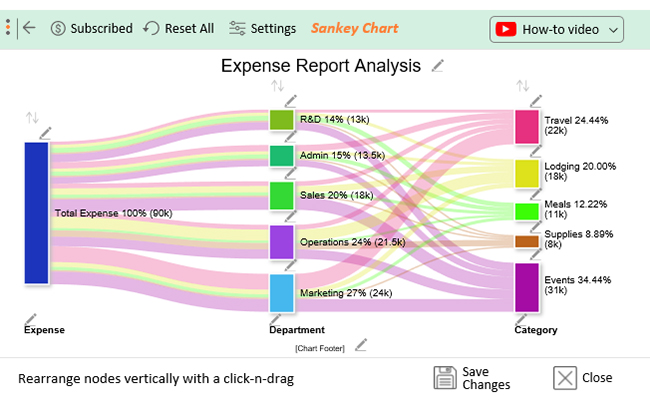
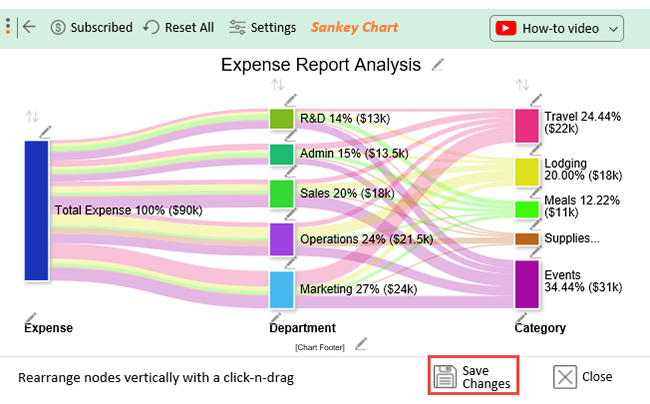
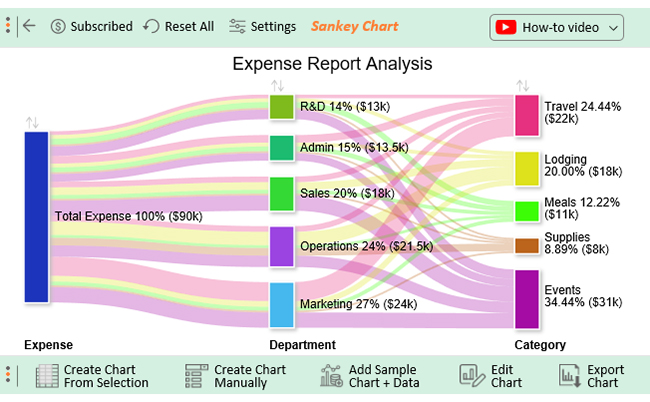
Let’s say you want to visualize your company expense report template in Excel using a Sankey chart below.
| Expense | Department | Category | Amount ($) |
| Total Expense | Marketing | Travel | 10,000 |
| Total Expense | Marketing | Lodging | 3,000 |
| Total Expense | Marketing | Meals | 2,000 |
| Total Expense | Marketing | Supplies | 1,000 |
| Total Expense | Marketing | Events | 8,000 |
| Total Expense | Operations | Travel | 3,000 |
| Total Expense | Operations | Lodging | 7,000 |
| Total Expense | Operations | Meals | 1,500 |
| Total Expense | Operations | Supplies | 4,000 |
| Total Expense | Operations | Events | 6,000 |
| Total Expense | Sales | Travel | 3,000 |
| Total Expense | Sales | Lodging | 4,000 |
| Total Expense | Sales | Meals | 2,000 |
| Total Expense | Sales | Supplies | 1,000 |
| Total Expense | Sales | Events | 8,000 |
| Total Expense | R&D | Travel | 2,000 |
| Total Expense | R&D | Lodging | 2,000 |
| Total Expense | R&D | Meals | 3,000 |
| Total Expense | R&D | Supplies | 1,000 |
| Total Expense | R&D | Events | 5,000 |
| Total Expense | Admin | Travel | 4,000 |
| Total Expense | Admin | Lodging | 2,000 |
| Total Expense | Admin | Meals | 2,500 |
| Total Expense | Admin | Supplies | 1,000 |
| Total Expense | Admin | Events | 4,000 |


Start by filling in your name, department, employee ID, and the date. Mention the purpose of the expenses, such as client meetings or business travel.
Record each expense with essential details, including the date, category (travel, meals, office supplies, etc.), vendor name, payment method, and amount spent.
Always upload or attach copies of receipts for each expense to validate the claim and ensure compliance.
Sum up all the expenses and categorize them properly to provide a clear overview of the spending.
Send the completed report to the concerned department or manager for review and approval.
Excel is a widely used spreadsheet program that is easy to use and navigate. An expense report template in Excel is user-friendly. It has pre-built formulas and fields that make entering and categorizing expenses easy.
Creating an expense report from scratch can be time-consuming, especially with many expenses to track. An operating expense report template in Excel saves time by providing a pre-designed format. You just need to fill in your expenses, and Excel will do the rest.
An expense report template in Excel ensures accurate reporting. This is achieved by automatically calculating expenses and breaking down spending reports. This helps in identifying areas of overspending and cost savings.
Using an operating expense report template in Excel improves financial charts. It provides a clear overview of expenses, enabling you to track spending patterns over time. This helps in identifying areas of improvement and making informed financial decisions.
An expense report spreadsheet allows you to add or remove fields where necessary. This makes it easy to tailor the template to specific needs and preferences.
Using an expense report spreadsheet promotes transparency, a significant benefit for employees and employers. Employees can quickly and accurately record their expenses, ensuring they are accounted for. This is crucial when it comes to tracking expenses and ensuring legitimate reimbursements.
Choose a template that is simple, easy to navigate, and requires minimal manual input. A clear structure helps employees fill out reports efficiently without confusion.
A good template should include built-in formulas to automatically calculate totals, reimbursements, and tax deductions. This reduces the risk of manual errors and saves time.
Select a template that organizes expenses into clear categories like travel, meals, office supplies, and lodging. Categorization helps in better budgeting and financial tracking.
A well-structured template should have a designated section for attaching receipts or invoice references. This helps in maintaining proper documentation and simplifies audits.
Opt for a template that allows customization based on business needs, such as adding additional fields, approval sections, or currency options.
A good Excel expense report template is well-structured, easy to use, and customizable to suit different business needs. Whether you’re using a daily expense report template Excel for tracking everyday costs or a weekly expense report template Excel for summarizing expenses over a week, it should include clearly labeled columns for essential details such as the date, expense category, description, amount, payment method, and receipt reference.
Automated formulas for total calculations and category summaries can save time and reduce errors. The layout should be clean and readable, making it simple for anyone to enter data and review expenses.
A strong template also supports accurate record-keeping, helps track spending trends, and ensures compliance with company policies and tax requirements.
To format an expense report, create a structured table with labeled columns for the date, expense category, description, amount, payment method, and receipt reference. Use consistent formatting for fonts, alignments, and currency values, and include formulas to calculate totals automatically.
The breakdown of an expense report is the detailed listing of all costs, typically grouped by categories such as travel, meals, office supplies, utilities, or project expenses. It shows each individual expense along with its date, purpose, and cost, helping track where money is spent and identify spending patterns.
Expenses seriously impact your financial life and the business you run. To manage money efficiently, you have to track expenses appropriately. It helps in ensuring legitimate reimbursements and identifying areas of overspending.
Creating an expense report doesn’t have to be daunting. With an expense report template in Excel, it can be straightforward. Furthermore, it offers benefits like saving time, data accuracy, and better financial management.
Using Excel in the business world isn’t just about crunching numbers anymore. It’s about gaining insights from data and visually communicating that information.
Charts and graphs are the best ways to do that.
Charting and graphing are no longer the exclusive domain of trained data analysts. Using the right tool, you can create insightful data visualizations.
To ensure your finances are on track, track your spending with ChartExpo. It is a potent Excel add-in that helps you visualize your data. It does not require any technical skills or coding. And best of all, it’s affordable.
How much did you enjoy this article?


Learn how to use sparklines in Excel to quickly visualize trends inside cells. Discover types, creation steps, customization, use cases, benefits, and best practices.

Learn what a confidence interval graph is, how to create it in Excel, and how to interpret results to make more reliable, data-driven decisions.

A correlation matrix in Excel helps identify relationships between variables. Learn how to create, read, and use it for effective data analysis.


