• Home
  • Tools dropdown img
    • Spreadsheet Charts

      • ChartExpo for Google Sheets
      • ChartExpo for Microsoft Excel
    • Power BI Charts

      • Power BI Custom Visuals by ChartExpo
    • Word Cloud

  • Charts dropdown img
    • Chart Category

      • Bar Charts
      • Circle Graphs
      • Column Charts
      • Combo Charts
      • Comparison Charts
      • Line Graphs
      • PPC Charts
      • Sentiment Analysis Charts
      • Survey Charts
    • Chart Type

      • Box and Whisker Plot
      • Clustered Bar Chart
      • Clustered Column Chart
      • Comparison Bar Chart
      • Control Chart
      • CSAT Survey Bar Chart
      • CSAT Survey Chart
      • Dot Plot Chart
      • Double Bar Graph
      • Funnel Chart
      • Gauge Chart
      • Likert Scale Chart
      • Matrix Chart
      • Multi Axis Line Chart
      • Overlapping Bar Chart
      • Pareto Chart
      • Radar Chart
      • Radial Bar Chart
      • Sankey Diagram
      • Scatter Plot Chart
      • Slope Chart
      • Sunburst Chart
      • Tornado Chart
      • Waterfall Chart
      • Word Cloud
    • Google Sheets
      Microsoft Excel
  • Services
  • Pricing
  • Contact us
  • Blog
  • Support dropdown img
      • Gallery
      • Videos
      • Contact us
      • FAQs
      • Resources
    • Please feel free to contact us

      atsupport@chartexpo.com

Categories
All Data Visualizations Data Analytics Surveys
Add-ons/
  • Google Sheets
  • Microsoft Excel
  • Power BI
All Data Visualizations Data Analytics Surveys
Add-ons
  • Google Sheets
  • Microsoft Excel
  • Power BI

We use cookies

This website uses cookies to provide better user experience and user's session management.
By continuing visiting this website you consent the use of these cookies.

Ok

ChartExpo Survey


Home > Blog > Microsoft Excel

How to Create a Small Business Expense Report in 6 Steps?

You undoubtedly have a lot going on as a small business owner. Aside from many other things, you also need to manage your budget, marketing initiatives, and staff.

small business expense report

Tracking your expenses is one of the most crucial tasks. Maintaining the financial stability of your business requires accurate tracking of your business expenses. Thus, a small business expense report is crucial.

Small businesses incur a variety of expenses that need monitoring. These can be costs for office supplies, travel, paying employees, advertising, etc.

Business owners must keep track of all of their spending. With this, they can accurately report their financial situation and stick to their budget.

Let’s discuss small business expense reports and learn how to create one in Excel.

Table of Contents:

  1. What is a Small Business Expense Report?
  2. Why Should Small Business Owners Track Their Expenses?
  3. Components of a Small Business Expense Report Templates
  4. Importance of Small Business Expense Report
  5. 3 Small Business Expense Report Examples 
  6. How to Create an Expense Report for a Small Business: Step-By-Step
    1. Step 1: Arrange Data
    2. Step 2: Install ChartExpo
    3. Step 3: Search Sankey Chart
    4. Step 4: Create a Chart From the Selection
    5. Step 5: Add Properties on the Chart
    6. Step 6: Final Expense Report
  7. How to Use Small Business Spreadsheet For Income And Expenses?
  8. Advantages of an Expense Report of a Small Business
  9. Tips For Creating Small Business Expense Report
  10. Small Business Expense Report FAQs
  11. Wrap Up

What is a Small Business Expense Report?

Definition: A Small Business Expense Report is a financial document used to track and record a company’s operational expenses. It provides information on expenses like travel, office supplies, utilities, and other essential costs.

By maintaining an accurate report, small businesses can effectively monitor their spending, stay within budget, and streamline tax preparation, while gaining insights into where money is being allocated.

Insights from this analysis, including the Mosaic Plot, can inform financial plans and choices about where to prioritize funds allocation. You can also use this report to keep track of every penny spent and pinpoint where savings are possible.

Why Should Small Business Owners Track Their Expenses?

Small business owners should track their expenses to gain better control over their finances. By keeping a detailed spending analysis, they can monitor cash flow, identify areas where they can cut costs, and ensure they stay within budget.

Expense tracking also simplifies tax preparation, as it helps document deductible expenses and ensures accurate reporting to the IRS. Additionally, it provides valuable insights into business performance through data reporting, allowing owners to make informed financial decisions and plan for future growth.

Components of a Small Business Expense Report Templates

  1. Date of the Expense – The date when the expense was incurred.
  2. Description – A brief explanation of the expense (e.g., office supplies, travel).
  3. Category – Classification of the expense (e.g., marketing, utilities, travel, or meals).
  4. Amount – The total cost of the expense, including taxes if applicable.
  5. Receipt or Invoice – Attachments or references to receipts as proof of the expense.
  6. Payment Method – Information on how the expense was paid (e.g., cash, credit card).
  7. Purpose – The reason or business-related purpose for incurring the expense.

Importance of Small Business Expense Report

It’s difficult to quantify the value of an accurate small business expense report.

  • It is essential for fiscal management and cost transparency. It offers a holistic perspective of costs for your business. Thus, you can keep tabs on your expenditures, spot problems, and adjust as required.
  • It also aids in planning budgets, identifying areas where you can cut expenses, and monitoring the advancement toward goals.
  • It enables businesses to examine their expenditures and decide on their future spending in detail.
  • You can also use it to assess the success of marketing initiatives and spot possibilities to raise ROI. This can aid in maintaining competitiveness and maximizing your earnings.

3 Small Business Expense Report Examples

  • Restaurant Expense Report

A restaurant’s total expenses are detailed in its expense report. It aids the owners and management in monitoring their expenditures.

A restaurant expense report should include all the expenses incurred during the fiscal period. This includes things like the cost of ingredients, labor costs, rent, utilities, advertising costs, and insurance.

You should also include special expenses such as catering or marketing expenses.

Upon listing the expenses and creating a monthly budget in Excel, you can use the report to analyze the restaurant’s profitability. From this, you can decide how to improve future spending.

  • Professional Services Expense Report

This report is necessary for tracking all expenses linked with the service and ensuring proper documentation.

Accuracy demands that you include all pertinent details. Include any invoices, receipts, or other paperwork that can help verify the cost incurred. Also, include things like flight and accommodation costs.

You should itemize all the expenses and, if applicable, break them down into their components.

expense report template
  • Retail Store Expense Report

This report tracks the expenses incurred by a retail store over a specific period.

It aids store owners and managers in understanding their financial situation.

The report gives specifics on every expense the store incurred. These include labor costs, rent, utilities, advertising, marketing, and other overhead costs.

How to Create an Expense Report for a Small Business: Step-By-Step

Now that we’ve discussed an expense report and why we need one, let’s discuss how to create one. To create an expense report, you need a data visualization tool. It’s impossible to examine the complex data required to make an expense report without a data visualization tool.

However, the usage of data visualization is broad. There are various applications for each style of data visualization. While many tools are at your disposal to assist you in creating your charts, the majority of them give you only some of the insights you desire from your data.

In this situation, you can construct all the charts in a single dashboard using the ChartExpo add-in. Sankey Diagrams cannot be drawn using such products’ built-in templates, hence creating one in Excel is a complicated operation.

But with the ChartExpo add-in for Excel, creating a Sankey Diagram is a straightforward procedure. It only takes a few clicks to generate a basic Sankey Diagram.

How to Install ChartExpo in Excel?

  1. Open your Excel application.
  2. Open the worksheet and click on the “Insert” menu.
  3. You’ll see the “My Apps”.
  4. In the office Add-ins window, click on “Store” and search for ChartExpo on my Apps Store.
  5. Click on the “Add” button to install ChartExpo in your Excel.

ChartExpo charts and graphs are available both in Google Sheets and Microsoft Excel. Please use the following CTA’s to install the tool of your choice and create beautiful visualizations in a few clicks in your favorite tool.

Step 1: Arrange Data

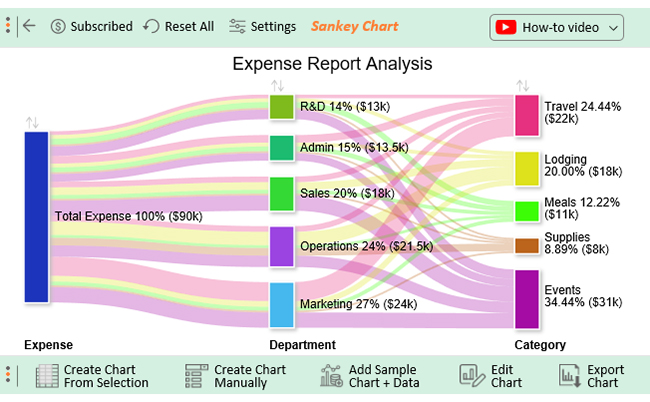
Let’s say you have access to your company’s records. You can gain insight into the expenses as shown below.

Total Spending Departments Category Items Amounts
Total Spending IT IT Accessories Keyboards 100
Total Spending IT IT Accessories Printers 500
Total Spending IT IT Accessories Routers 300
Total Spending IT IT Accessories LEDs 2500
Total Spending IT IT Accessories Headphones 600
Total Spending IT IT Accessories Servers 10000
Total Spending Admin Decor & Furniture Desk 3000
Total Spending Admin Decor & Furniture Chairs 1200
Total Spending Admin Decor & Furniture Chair Rests 600
Total Spending Admin Decor & Furniture Sofas 200
Total Spending Admin Decor & Furniture Wall art 300
Total Spending Admin Decor & Furniture Tables 400
Total Spending Admin Decor & Furniture Filing cabinets 700
Total Spending Admin Electric Bulbs 100
Total Spending Admin Electric Fans 150
Total Spending Admin Electric AC 8000
Total Spending Admin Kitchen Plates 270
Total Spending Admin Kitchen Tea Cups 250
Total Spending Admin Cleaning AC Cleaning 120
Total Spending Finance Salaries 50000
Total Spending Sales & Marketing Outdoor & Digital Campaigns 150000
Total Spending Sales & Marketing Events & Dinners 12000

Step 2: Install ChartExpo, then click My Apps

insert chartexpo in excel
  • Choose ChartExpo from My Apps, then click Insert.
open chartexpo in excel

Step 3: Search Sankey Chart

search sankey chart in excel

Step 4: Create a Chart From the Selection

Create Chart From Selection CE227
  • The Sankey Chart will look as follows.
Edit Chart CE227

Step 5: Apply the title and Other Properties on the Chart

Apply Button CE227
  • Let’s add the Prefix (e.g. $ Sign) with the numeric values in the chart.
  • Click on the highlighted pencil icon. Expand the “Symbols” properties to add the Prefix value (e.g. $ sign).
Stats CE227
  • Let’s hide the percentage of 4th node. Expand Percentage properties and toggle the Show button.
Percentage CE227
  • To alter the node’s color, press the pencil icon next to it. Then expand the ‘Node properties’ and choose the desired color from the ‘Node Color‘ property. Then click the “Apply” button.
Save Changes CE227

Step 6: Final Expense Report of Small Business

small business expense report CE227

Insights

  • At the first level, the total spending is $241.29k.
  • At level 2, the departments are listed, with the node’s size indicating the expense amount. The largest consumption of expense is in sales & marketing, with $162K taken from the total spending. The least is in IT, at around $4.4K.
  • At the third level, expenses are broken down into categories. The outdoor and digital campaigns take the largest chunk of around $150K.
  • The fourth level displays each item with its own expense.

How to Use Small Business Spreadsheet For Income And Expenses?

  1. Open your spreadsheet program.
  2. Create headers for date, income, expense, and amount.
  3. List and categorize income sources.
  4. Add categorized expenses.
  5. Use formulas to calculate totals.
  6. Regularly update and review your data.

Advantages of an Expense Report of a Small Business

Creating an expense report can be beneficial for small businesses in several ways.

  • Finances Tracking

It’ll shed light on your financial situation and equip you to make better financial decisions. Thus, you can find ways to cut costs and stick to your budget.

  • Proper Tax Filing

An expense report will be beneficial to you during the tax season.

It is easier to report your finances and remember all deductions. This is when you have all of your expenses in one spot. Doing this can help you save money on taxes by avoiding unnecessary deductions.

  • Cut Overspending

You can find areas where you need to make budget cuts using an expense report.

You can better understand where your money is going by keeping track of your expenses.

Additionally, you can see how much you are spending on each item. From this, you can determine areas where you might reduce expenses and save money.

Tips For Creating Small Business Expense Report

  1. Categorize Expenses – Group expenses into clear categories like travel, utilities, or office supplies for better organization.
  2. Keep Receipts – Always attach receipts or digital copies for each expense to ensure accuracy and tax compliance.
  3. Set a time frame – Regularly update the report (weekly or monthly) to stay on top of expenses.
  4. Use Accounting Software – Leverage tools like QuickBooks or Excel for easier expense tracking and reporting.
  5. Monitor for Accuracy – Double-check entries to ensure all amounts and descriptions are correct

Small Business Expense Report FAQs

What is the best way to track expenses for a small business?

Making an expense report is the ideal way for a small business to keep track of its spending. A small business must keep track of its expenses. This guarantees that the business is profitable and operating within its means.

What is a Small Business Expense Report?

A small business expense report keeps track of all costs associated with running a business. It contains the cost, the payer, and the expense’s date. It is employed for expense monitoring, budgeting, foreseeing, and analysis.

What are the benefits of creating a Small Business Expense Report?

There are numerous benefits to preparing a small business expense report;

  • Improved cost control.
  • Better expense management and tracking.
  • Improved accounting accuracy.
  • Greater visibility into spending.
  • Helps businesses better understand their financial situation.

What is the purpose of creating a Small Business Expense Report?

An organized record of all business spending is what a small business expense report intends to accomplish. It enables businesses to keep track of their spending and find places where they can cut expenses. The report also serves as a resource when creating budgets.

How often should I prepare a Small Business Expense Report?

You should prepare an expense report regularly, such as monthly or quarterly. It’s crucial to maintain track of all business-related spending. As a result, you can effectively assess your financial condition and make wise spending decisions.

Wrap Up

It’s crucial to compile a small business expense report. You can enhance financial management, boost productivity, and accomplish business objectives.

You can use it to find areas where you can save costs and improve your financial decisions. Creating an expense report can be a daunting task, but with ChartExpo, it can be much simpler.

ChartExpo makes it easy to track your expenses and create charts and graphs to visualize them. Thus, you can create an insightful visualization of your small business expenses.

Get started today with expense reports and discover the magic of tracking your expenses.

How much did you enjoy this article?

ExcelAd2
Start Free Trial!
124649

Related articles

next previous
Microsoft Excel13 min read

Excel for Teachers for Insightful Preparation

Excel for teachers simplifies grading, tracks attendance, and organizes data. Find its key features, expert tips, and how ChartExpo enhances data visualization.

Microsoft Excel14 min read

How to Make a Cash Flow Diagram in Excel?

Learn how to make a Cash Flow Diagram in Excel. It will help you learn to visualize and analyze inflows and outflows of your business cash flow.

Microsoft Excel11 min read

Succession Planning Template for Long-Term Success

Succession Planning Templates help businesses prepare for leadership changes. Learn to create, analyze, and use them for seamless transitions and growth.

Microsoft Excel10 min read

Grant Tracking Spreadsheet: Insights Made Easy

A Grant Tracker Spreadsheet helps track funding, deadlines, and expenses in Excel. Learn to use grant tracking templates, analyze data, and stay organized.

Microsoft Excel10 min read

What is Excel Software Used for: A Complete Guide

What is Excel software used for? It organizes, analyzes, and manages data. Explore its workplace applications, benefits, and top tips for efficiency and more.

ChartExpo logo

Turn Data into Visual
Stories

CHARTEXPO

  • Home
  • Gallery
  • Videos
  • Services
  • Pricing
  • Contact us
  • FAQs
  • Privacy policy
  • Terms of Service
  • Sitemap

TOOLS

  • ChartExpo for Google Sheets
  • ChartExpo for Microsoft Excel
  • Power BI Custom Visuals by ChartExpo
  • Word Cloud

CATEGORIES

  • Bar Charts
  • Circle Graphs
  • Column Charts
  • Combo Charts
  • Comparison Charts
  • Line Graphs
  • PPC Charts
  • Sentiment Analysis Charts
  • Survey Charts

TOP CHARTS

  • Sankey Diagram
  • Likert Scale Chart
  • Comparison Bar Chart
  • Pareto Chart
  • Funnel Chart
  • Gauge Chart
  • Radar Chart
  • Radial Bar Chart
  • Sunburst Chart
  • see more
  • Scatter Plot Chart
  • CSAT Survey Bar Chart
  • CSAT Survey Chart
  • Dot Plot Chart
  • Double Bar Graph
  • Matrix Chart
  • Multi Axis Line Chart
  • Overlapping Bar Chart
  • Control Chart
  • Slope Chart
  • Clustered Bar Chart
  • Clustered Column Chart
  • Box and Whisker Plot
  • Tornado Chart
  • Waterfall Chart
  • Word Cloud
  • see less

RESOURCES

  • Blog
  • Resources
  • YouTube
SIGN UP FOR UPDATES

We wouldn't dream of spamming you or selling your info.

© 2025 ChartExpo, all rights reserved.