Categories
Are you getting the expected returns from the money you invest in your business?
Spend analysis gives you the data you need to ensure you get the most bang for your buck.
Spend analysis involves tracking the money you spend while running your business. It’s a way of understanding where your money is going and why. You can identify areas of wastage and make changes to improve your bottom line.


Assume you head procurement for a food distribution business. You are responsible for monitoring the costs of purchasing food and supplies. Consequently, ensure that you are getting the best deals.
You can use spend reporting to track the costs of food and supplies. Then compare them to market prices, and identify areas of cost negotiations to strike the best deals.
It’s no secret that managing and analyzing spending data can be a challenge. Fortunately, tools are available to help you quickly and easily visualize and analyze your data.
Definition: Spend analysis comprises assessing and analyzing a business’s spending behaviors and patterns. It aids in identifying areas for cost savings.
Spend analysis is useful since it employs data analytics and reporting to aid in formulating strategies. These strategies help to reduce expenses and maximize profits.
Spend analysis helps organizations understand their spending patterns and identify potential vendor relationship issues. Consequently, develop strategies for improved budgeting and cost management.
Spend analysis is the process of collecting, categorizing, and evaluating company expenditures to identify cost-saving opportunities, improve procurement efficiency, and strengthen financial decision-making. When the results are visualized in financial charts, it becomes even easier to spot patterns and uncover actionable insights.
Spend reporting alludes to the most common way of following, examining, and introducing data about an organization’s uses or spending activities. It includes checking the monetary assets dispensed to different classifications, undertakings, or divisions within an organization.
Spend analysis gives insight into how assets are being used, permitting organizations to make informed decisions, recognize cost-saving opportunities, and guarantee productive financial management.
This reporting typically includes details on expenses, vendor payments, budget adherence, and other financial transactions. It often involves steps to make a monthly budget in Excel, presented in a structured and comprehensible format for stakeholders, executives, or relevant teams to assess and act upon.
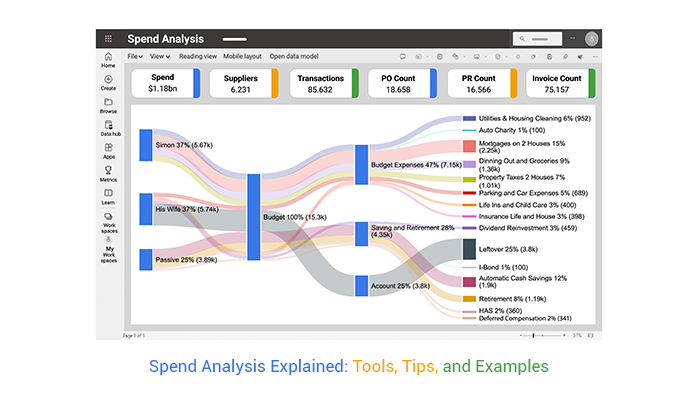
A spend analysis report gives you a bird’s-eye view of your spending patterns. You can also use a funds flow diagram to visualize how money moves across different areas. This helps you determine which departments are over- or under-utilizing funds and develop strategies to fix the problem areas.
The spend analysis report evaluates the cost-effectiveness of various functions. This helps to identify areas of wastage and the necessary improvements to reduce expenses.
A spend analysis report helps to improve efficiency by aiding in the identification and elimination of unnecessary costs. It also identifies areas where you can better allocate money to maximize the benefits of resources available.
A spend analysis report is an integral tool for budgeting and forecasting, especially within performance-based budgeting. You can better anticipate future financial needs and create a realistic budget.
Spend analysis is an invaluable tool for ensuring compliance with laws and regulations. You can identify areas of potential risk or fraud. Also, you can identify vendors not following proper procedures or rules. This helps to ensure that funds are only spent per the company’s policies and procedures.
Spending analysis involves systematically reviewing an organization’s spending data to understand purchasing patterns and identify opportunities for cost savings. This process typically involves tasks similar to what a data analyst does, including collecting and cleaning data from various sources.
It then categorizes and analyzes this data to uncover trends, inefficiencies, and areas for negotiation. The insights gained help organizations make informed decisions, optimize procurement strategies, and improve overall financial management.
Provides a high-level snapshot of overall company expenditure.
Why it matters: Helps monitor spending trends and detect significant changes over time.
Visualizes how spending is distributed across procurement categories.
Why it matters: Identifies major cost centers and opportunities for optimization.
Ranks suppliers based on total spend volume.
Why it matters: Aids in vendor spend analysis and strategic sourcing decisions.
Highlights off-contract or unauthorized purchases.
Why it matters: Flags non-compliance and reveals areas for policy enforcement.
Compares forecasted spending against actual expenses.
Why it matters: Supports accurate budgeting and financial accountability.
Direct Spend Analysis focuses on the expenditures that are directly tied to the production of goods or services. This includes costs associated with raw materials, components, and services that are directly incorporated into the final product.
Analyzing direct spending helps organizations optimize procurement processes, negotiate better terms with suppliers, and manage inventory effectively. The goal is to enhance cost-efficiency and ensure that production inputs are sourced at the best possible value.
Indirect Spend Analysis, on the other hand, deals with expenditures that are not directly linked to production but are necessary for overall operations. This includes costs such as office supplies, utilities, travel, and professional services.
Analyzing indirect spending helps organizations understand and control overhead costs, streamline procurement processes, and identify potential savings in operational areas. The focus is on optimizing spending on non-production-related items and services that support the organization’s day-to-day functions.
Item spend analytics looks at the price of individual items bought. It provides insights into the priciest items and those with the most significant influence on cost. It also offers guidance on where to concentrate your cost-cutting efforts.
Contract spend analytics looks at the cost of contracts entered into by a business. It provides insights into the most expensive contracts and those generating the most value. This way, you can identify contracts not provide value that can be renegotiated or canceled. It also provides insights into potential areas for improvement in the contract process.
Category spend analytics looks at the cost of goods and services hierarchically grouped into categories. It provides insights into the most expensive categories and those providing the most value. It can also shed light on potential areas for improvement in the purchasing process.
Supplier spending analytics assesses the quality of supplier services and performance. Thus, identify the best suppliers for a given product or service. Consequently, costs can be reduced through smarter supplier contracting decisions.
Tail spend analysis is a powerful strategy for increasing procurement effectiveness. It aids in identifying and controlling the “tail” of your spending. Tail spending is a minor fraction of the overall spending that is often overlooked. Tail spend analytics can help find areas for savings, cut expenses, and improve value from the procurement spend analysis process.
Payment term analytics is crucial for understanding a company’s purchase-to-pay (P2P) practices. It also keeps track of the purchases made within a specific time frame. This information helps to develop more effective payment terms and to bargain for better deals with vendor spend analysis.
This spend analysis in procurement template Excel focuses on evaluating company expenditures related to procurement activities. It helps identify who the top suppliers are, what categories consume the most budget, and where potential cost savings lie.
Key features include:
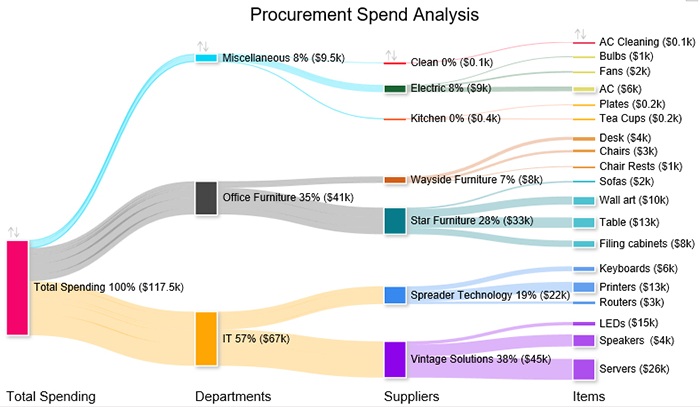
Ideal for: Procurement teams looking to optimize sourcing strategies and supplier performance.
A high-level spend analysis template that provides a comprehensive overview of overall company expenses across departments, projects, and time periods.
Key features include:
Ideal for: Finance and executive teams needing an organization-wide view of spending behavior.
Designed for tracking and reviewing expenditures every month, this template supports short-term budgeting and timely financial decisions.
Key features include:

Ideal for: Operational teams and managers aiming to maintain financial discipline throughout the year.
Spending is reviewed against agreed terms and conditions to ensure adherence. This helps flag any instances of excess payments or unauthorized purchases, supporting accountability and transparency in procurement spend analysis.
By analyzing spending patterns, businesses can uncover opportunities to cut costs. Strategies may include consolidating suppliers, standardizing procurement spend analysis processes, or renegotiating existing contracts to achieve better terms.
This involves identifying purchases made outside of approved procurement channels. Tackling maverick spending reduces inefficiencies, ensures policy compliance, and prevents unnecessary expenditures.
Focuses on optimizing low-value or infrequent transactions, often overlooked in traditional procurement reviews. Streamlining tail spend can lead to meaningful savings and improved procurement efficiency.
Evaluates how spending is distributed among diverse suppliers. This ensures compliance with diversity goals and promotes inclusive procurement practices across the supply chain.
The overall amount a company spends over a period, across all categories and suppliers.
Why it matters: Establishes a baseline for analysis and helps monitor cost trends.
Breaks down spending across categories like IT, marketing, operations, etc.
Why it matters: Identifies high-cost areas and potential for category-specific savings.
Tracks how much is spent with each supplier.
Why it matters: Helps uncover dependency on specific vendors and negotiate better terms.
The portion of spend made outside approved procurement processes.
Why it matters: High maverick spend indicates policy non-compliance and inefficiencies.
The percentage of spend that aligns with existing contracts.
Why it matters: Ensures purchasing follows negotiated terms, reducing risk and overspending.
Compares potential cost-saving opportunities against actual savings achieved.
Why it matters: Measures the effectiveness of procurement strategies.
This is a widely used spreadsheet application by Microsoft, offering features for data analysis, calculation, and visualization. It’s versatile and customizable, making it suitable for various tasks, including budgeting, financial analysis, and data organization.
Power BI is a business analytics tool by Microsoft that provides interactive visualizations and business intelligence capabilities. It allows users to connect to various data sources, create dynamic reports and dashboards, and share insights across organizations.
Google Sheets is a web-based spreadsheet application offered by Google. It provides collaborative editing features, real-time updates, and cloud storage, making it easy for teams to work together on data analysis, reporting, and sharing.
Excel is an effective and flexible tool for managing your finances. You can examine your spending data with the spreadsheet to help you make wiser financial decisions.
However, data analysis in Excel can be challenging.
This necessitates the use of extra tools to simplify this analysis.
This is where ChartExpo comes in handy.
ChartExpo is an Excel add-in that helps you quickly and easily visualize your spending. You can categorize your spending and create insightful charts and graphs effortlessly.
How to Install ChartExpo in Excel?
ChartExpo charts exist in both Google Sheets and Microsoft Excel. Utilize the given CTAs to install the tool you prefer. Then make eye-catching visuals with just a few clicks in your go-to program.
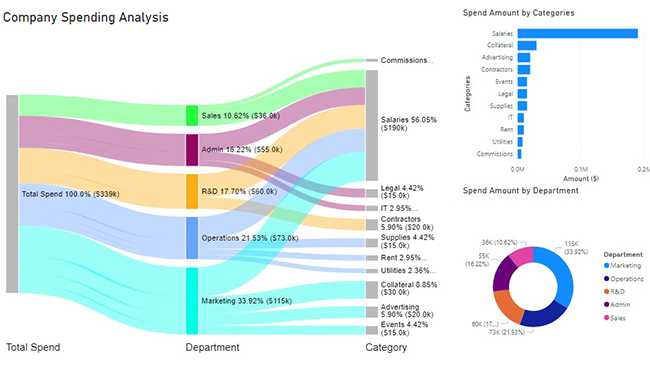
| Total Spend | Department | Category | Spend Amount($) |
| Total Spend | Marketing | Advertising | 20,000 |
| Total Spend | Marketing | Events | 15,000 |
| Total Spend | Marketing | Collateral | 30,000 |
| Total Spend | Marketing | Salaries | 50,000 |
| Total Spend | Operations | Rent | 10,000 |
| Total Spend | Operations | Utilities | 8,000 |
| Total Spend | Operations | Supplies | 15,000 |
| Total Spend | Operations | Salaries | 40,000 |
| Total Spend | Sales | Salaries | 30,000 |
| Total Spend | Sales | Commissions | 6,000 |
| Total Spend | R&D | Salaries | 40,000 |
| Total Spend | R&D | Contractors | 20,000 |
| Total Spend | Admin | Salaries | 30,000 |
| Total Spend | Admin | Legal | 15,000 |
| Total Spend | Admin | IT | 10,000 |
Use a Sankey Chart visualization to present this kind of data effectively. Follow through as I show you how to create a Sankey chart in Excel with ChartExpo.


Add a Prefix on the Chart


Spend analysis helps to increase visibility into where money is being spent. You can gain a better understanding of your spending habits and identify areas of potential savings. With this increased visibility, you can make improvements and streamline processes. Consequently, ensures the usage of funds most efficiently and effectively.
You can craft more effective budgets by understanding allocation and how they are used. With improved budgeting, you can reduce costs and increase profits while maintaining efficiency in money usage.
Spend analysis explains the business’s overall spending and purchasing power. This insight can help you make better decisions when choosing suppliers and negotiating contracts. Consequently, it leads to more cost-effective outcomes.
By analyzing supplier data, you can improve relationships with suppliers. Thus, you can more effectively address supplier issues and increase supplier satisfaction. You can also identify discrepancies between the promised and received services from suppliers. This can help ensure that you receive the services you have paid for. Therefore, ensures efficient supplier performance.
Conducting a spending analysis helps to ensure you get the most out of your investments. You can adjust your strategies to maximize the return on your investment by finding areas of inefficiency. Thus, ensure that your company uses resources as efficiently as possible.
A thorough review of a business’s spending should be part of spend analysis. This includes the amount spent on each product or service. It should also have a forecast of the future explaining how to fix your spending to improve performance.
Spend analysis involves identifying and understanding where your business is spending money. It helps you to identify areas for cost savings. Ultimately, contributes to improving efficiency and ROI.
As we have seen, spend analysis has various types, each having specific applications and benefits. The choice of the ideal type depends on your objectives.
We have discussed the basics of spend analysis and learned how to analyze the data. You have what it takes to analyze spending data in Excel.
However, it can be challenging to analyze spending report data in Excel.
Worry less. ChartExpo comes to your rescue.
With ChartExpo for Excel, you can extract actionable insights from your spend analysis data in no time. Then, use the insights to make smart decisions to drive savings and increase efficiency in your business.
How?
ChartExpo allows you to create insightful visualizations effortlessly. It’s easy to use, flexible, affordable, fast, and accurate.
How much did you enjoy this article?


Calculate accounts receivable turnover ratio to measure credit collection speed, improve cash flow, and strengthen your financial strategy. Read on!

Change Management KPIs are the key to tracking adoption, performance, and ROI during transitions. Find out which metrics matter. Read on!

Data collection methods and techniques determine the quality of every insight you act on. Explore key approaches for gathering reliable data. Read on!


