• Home
  • Tools dropdown img
    • Spreadsheet Charts

      • ChartExpo for Google Sheets
      • ChartExpo for Microsoft Excel
    • Power BI Charts

      • Power BI Custom Visuals by ChartExpo
    • Word Cloud

  • Charts dropdown img
    • Chart Category

      • Bar Charts
      • Circle Graphs
      • Column Charts
      • Combo Charts
      • Comparison Charts
      • Line Graphs
      • PPC Charts
      • Sentiment Analysis Charts
      • Survey Charts
    • Chart Type

      • Box and Whisker Plot
      • Clustered Bar Chart
      • Clustered Column Chart
      • Comparison Bar Chart
      • Control Chart
      • CSAT Survey Bar Chart
      • CSAT Survey Chart
      • Dot Plot Chart
      • Double Bar Graph
      • Funnel Chart
      • Gauge Chart
      • Likert Scale Chart
      • Matrix Chart
      • Multi Axis Line Chart
      • Overlapping Bar Chart
      • Pareto Chart
      • Radar Chart
      • Radial Bar Chart
      • Sankey Diagram
      • Scatter Plot Chart
      • Slope Chart
      • Sunburst Chart
      • Tornado Chart
      • Waterfall Chart
      • Word Cloud
    • Google Sheets
      Microsoft Excel
  • Services
  • Pricing
  • Contact us
  • Blog
  • Support dropdown img
      • Gallery
      • Videos
      • Contact us
      • FAQs
      • Resources
    • Please feel free to contact us

      atsupport@chartexpo.com

Categories
All Data Visualizations Data Analytics Surveys
Add-ons/
  • Google Sheets
  • Microsoft Excel
  • Power BI
All Data Visualizations Data Analytics Surveys
Add-ons
  • Google Sheets
  • Microsoft Excel
  • Power BI

We use cookies

This website uses cookies to provide better user experience and user's session management.
By continuing visiting this website you consent the use of these cookies.

Ok

ChartExpo Survey


Home > Blog > Microsoft Excel

Supplier Scorecard Examples: A Practical Guide

Supplier scorecard examples are like the golden keys to unlocking the kingdom of supplier performance evaluation. But let’s face it, creating a supplier scorecard can sometimes feel like juggling flaming torches. It requires careful consideration of what metrics matter most to your business. And how to communicate expectations to your suppliers effectively.

Supplier Scorecard Examples

It’s challenging, to say the least.

But don’t worry. This blog post takes you through creating supplier scorecard examples, step by step.

But first, you might wonder, “What’s the deal with supplier scorecard examples?”

Let me tell you.

Supplier scorecard examples like the secret sauce of supplier evaluation’ make everything clearer, snappier, and more effective. It’s like giving your suppliers a performance review but with a side of wit and charm.

With a supplier scorecard, you can identify top-performing suppliers and pinpoint areas for improvement. Moreover, the insights these scorecards provide inform data-driven decisions to optimize your supply chain.

Sounds pretty sweet, right?

So, buckle up and get ready to learn the ins and outs of creating a supplier scorecard. It’s time to turn those supplier scorecard examples into a powerful tool for your business.

Let’s dive in!

Table of Contents:

  1. What is a Supplier Scorecard?
  2. What to Include in a Vendor Scorecard?
  3. Supplier Scorecard Examples
  4. Who Uses Supplier Scorecards?
  5. How to Create a Supplier Scorecard?
  6. How to Examine Supplier Scorecard Examples?
  7. Wrap Up

What is a Supplier Scorecard?

Definition: A supplier scorecard is a performance measurement tool that assesses and monitors the performance of suppliers. It typically includes key performance indicators (KPIs) such as on-time delivery, quality, cost-effectiveness, and communication. The scorecard provides a quantitative and qualitative evaluation, allowing you to rank and compare suppliers objectively.

This tool facilitates data-driven decision-making. It helps you identify top-performing suppliers and areas for improvement. Moreover, a well-designed supplier scorecard enhances transparency, accountability, and collaboration in the supply chain.

Establishing a standardized evaluation process can help you strengthen relationships with suppliers. This facilitates continuous improvement and ensures alignment with strategic objectives.

In essence, the supplier scorecard is a valuable instrument for fostering a mutually beneficial and efficient supplier-customer relationship.

What to Include in a Vendor Scorecard?

A vendor scorecard is the North Star of vendor management, guiding businesses through the intricacies of supplier relationships. To create a compelling symphony, it’s imperative to delve into the granularity of supplier scorecard metrics. Here’s a list of what to include:

  • Quality of products/services: Evaluate the supplier’s deliverables in terms of quality and adherence to specifications. Supplier scorecard metrics may include defect rates, standards conformity, and product/service quality consistency.
  • Timeliness of delivery: Timeliness is a crucial vendor scorecard metric. Assess on-time delivery performance, analyzing lead times and fulfillment accuracy to ensure suppliers meet agreed-upon deadlines.
  • Cost and pricing: Assess the supplier’s cost-effectiveness. Include a detailed analysis of pricing structures, utilizing a price comparison template to compare quotes and evaluate overall cost competitiveness in the market.
  • Responsiveness and communication: Gauge the supplier’s responsiveness and communication effectiveness. Supplier scorecard metrics may include response times, communication clarity, and efficiency in addressing queries or issues.
  • Customer service: Evaluate the quality of customer service provided by the supplier. Supplier scorecard metrics to use here encompass response times, communication clarity, and resolution efficiency.
  • Compliance and ethics: Ensure the vendor adheres to ethical practices and complies with relevant regulations. Ethical conduct mitigates legal and reputational risks, safeguarding the business’s integrity.
  • Innovation and flexibility: Gauge the vendor’s innovative capabilities and adaptability. A forward-thinking vendor willing to evolve and introduce flexible solutions contributes to the business’s competitiveness and resilience.
  • Financial stability: Examine the vendor’s financial stability. A financially stable vendor is less likely to face disruptions that could impact the supply chain and business operations.
  • Relationship management: Consider the vendor’s approach to relationship management. A vendor actively invested in building a collaborative and mutually beneficial relationship fosters a positive and enduring partnership.
  • Risk management: Evaluate the vendor’s risk management practices. This involves understanding how the vendor identifies, mitigates, and plans for potential risks that may affect the supply chain.
  • Performance history: Review the vendor’s historical performance. Analyzing past performance offers valuable insights into consistency, reliability, and the ability to meet expectations consistently over time.
  • Feedback and reviews: Incorporate feedback from internal stakeholders and industry reviews. External perspectives provide a broader view of the vendor’s reputation, performance, and relationships with other businesses.

Supplier Scorecard Examples

A supplier scorecard is a tool used by organizations to evaluate and measure the performance of their suppliers. It helps in assessing various aspects like quality, delivery, cost, and service. Here are some common supplier scorecard metrics examples across various categories:

Quality Metrics

  • Defect Rate: Percentage of defective products or services delivered.
  • Compliance Rate: Percentage of products or services that meet specified standards and regulations.
  • Returned Products Rate: Percentage of products returned due to defects or non-conformance.

Delivery Metrics

  • On-time Delivery: Percentage of deliveries made on or before the agreed-upon delivery date.
  • Fill Rate: Percentage of ordered items delivered in full.
  • Lead Time: Average time taken from order placement to delivery.

Cost Metrics

  • Cost Savings: Percentage or amount of cost savings achieved compared to previous periods or benchmarks.
  • Cost of Poor Quality (COPQ): Total costs associated with poor-quality products or services, including rework, returns, and warranty claims.
  • Total Cost of Ownership (TCO): Total cost of acquiring, operating, and maintaining a product or service over its lifecycle.

Service Metrics

  • Responsiveness: Average response time to inquiries, issues, or complaints.
  • Communication: Frequency and effectiveness of communication between the supplier and the organization.
  • Problem Resolution Time: Average time taken to resolve issues or complaints.

Relationship Metrics

  • Supplier Relationship Score: Overall satisfaction score based on relationship management, trust, and collaboration.
  • Innovation Rate: Number or percentage of innovative solutions or ideas proposed by the supplier.
  • Supplier Development: Level of involvement and support provided by the supplier in enhancing capabilities or improving processes.

Sustainability Metrics

  • Environmental Impact: Measures to evaluate the supplier’s efforts in reducing environmental footprint, such as waste reduction, energy efficiency, and carbon footprint.
  • Ethical Practices: Compliance with ethical standards, labor laws, and fair trade practices.
  • Social Responsibility: Initiatives taken by the supplier to contribute positively to society, community engagement, and philanthropic activities.

Financial Metrics

  • Payment Terms Adherence: Adherence to agreed-upon payment terms and conditions.
  • Financial Stability: Evaluation of the supplier’s financial health, including liquidity, profitability, and solvency ratios.

Who Uses Supplier Scorecards?

It’s now clear that supplier scorecards are a compass for businesses navigating the complex landscape of supplier relationships. Let’s explore how different sectors leverage these scorecards.

  • Manufacturing Companies

Manufacturers rely heavily on supplier scorecards to ensure raw materials’ quality, timely delivery, and cost-effectiveness. It aids in maintaining efficient production processes and streamlining supply chain operations.

  • Retailers

Retailers use supplier scorecards to assess suppliers’ ability to meet demand and deliver on time. Moreover, they can assess whether the supplier can provide products that align with consumer expectations. It contributes to maintaining a seamless and well-stocked inventory.

  • Healthcare Providers

Supplier scorecards are crucial in healthcare for evaluating the reliability of medical equipment, pharmaceuticals, and other critical supplies. It ensures compliance with stringent quality and regulatory standards.

  • Technology Companies

Technology firms use supplier scorecards to assess the performance of vendors providing components, software, and services. It aids in managing the intricate supply chains inherent in the tech industry.

  • Service Providers

Companies offering services, such as consulting or IT services, use scorecards to evaluate the performance of subcontractors or partners. It helps ensure the delivery of high-quality services to clients.

  • Government Agencies

Government agencies deploy supplier scorecards to evaluate the performance of contractors and suppliers. It ensures accountability, transparency, and adherence to regulations in public procurement.

  • Financial Institutions

In the financial sector, supplier scorecards assess vendors providing various services, from IT infrastructure to security solutions. It contributes to operational efficiency and risk management.

How to Create a Supplier Scorecard?

A well-structured supplier scorecard facilitates collaboration, drives improvement, and ensures your supply chain is a strategic asset. Here’s a detailed guide on how to create a supplier scorecard:

  1. Define objectives: Clarify the goals of your supplier scorecard. Common objectives include improving product quality, reducing costs, enhancing on-time delivery, ensuring compliance, and fostering long-term relationships.
  2. Identify key metrics: Choose metrics that directly contribute to the defined objectives. Consider factors such as on-time delivery, product quality, lead time, cost competitiveness, communication responsiveness, and sustainability. Tailor these metrics and KPIs to match your industry, product/service requirements, and your organization’s strategic priorities.
  3. Establish weighting: Assign weights to each metric based on their relative importance. For example, if timely delivery is a top priority, allocate a higher weight to the on-time delivery metric. This weighting ensures the score reflects the significance of each aspect in achieving overall supply chain objectives.
  4. Set performance targets: Define specific, measurable, and realistic performance targets for each metric. These targets should be challenging enough to drive improvement but achievable to maintain supplier motivation. Benchmark against industry standards or historical data to set meaningful and contextually relevant goals.
  5. Collect data: Implement a robust data collection process. Utilize key performance indicators (KPIs), supplier surveys, and feedback from various departments involved in the supply chain. Establish a regular data collection cadence and validate the data for accuracy to ensure performance evaluation reliability.
  6. Analyze performance: Utilize collected data to analyze supplier performance comprehensively. Compare actual results against established metrics and targets. Employ tools such as the Box And Whisker plot to identify trends and variations over time, gaining deeper insights into supplier performance patterns. This analysis forms the basis for informed decision-making and improvement initiatives.
  7. Provide feedback: Transparent communication is key. Share performance results and feedback with suppliers regularly. Offer constructive feedback on strengths and weaknesses, emphasizing collaboration for mutual improvement. Establishing a feedback loop fosters a continuous improvement mindset among suppliers.
  8. Continuous improvement: Encourage suppliers to implement corrective actions based on feedback and performance reviews. Collaborate with them to develop improvement plans and provide necessary support. Revisit and update the supplier scorecard regularly to adapt to changing business dynamics, ensuring ongoing alignment with strategic goals.

How to Examine Supplier Scorecard Examples?

Data analysis can be a labyrinth of numbers, spreadsheets, and types of charts. Amidst this data wilderness, understanding supplier scorecard examples can feel like finding a needle in a haystack.

This is where data visualization swoops in as the hero. It wields the power to untangle complexity and unveil insights with clarity. However, while Excel is a trusty sidekick in crunching numbers and creating basic types of charts, its visualization capabilities often fall short.

But don’t worry; we have ChartExpo.

ChartExpo offers a seamless solution to Excel’s visualization limitations with advanced options, including the ability to create detailed visualizations like an IELTS band score chart. It empowers you to conquer the data deluge and extract actionable intelligence from supplier scorecard examples.

Let’s learn how to Install ChartExpo in Excel.

  1. Open your Excel application.
  2. Open the worksheet and click the “Insert” menu.
  3. You’ll see the “My Apps” option.
  4. In the Office Add-ins window, click “Store” and search for ChartExpo on my Apps Store.
  5. Click the “Add” button to install ChartExpo in your Excel.

ChartExpo charts are available both in Google Sheets and Microsoft Excel. Please use the following CTAs to install the tool of your choice and create beautiful visualizations with a few clicks in your favorite tool.

Example

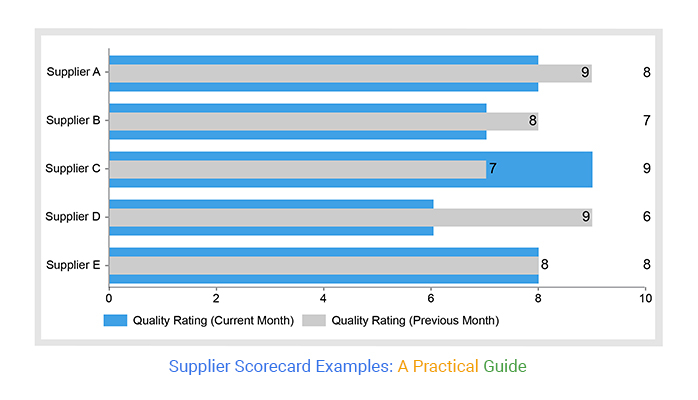
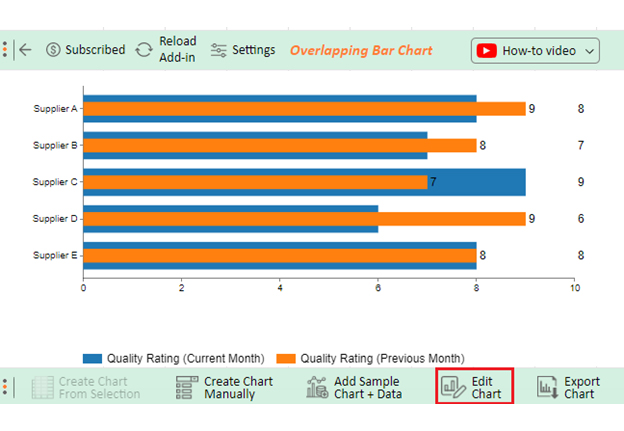
Let’s say you want to analyze the supplier scorecard sample data below.

Suppliers Quality Rating

(Current Month)

Quality Rating

(Previous Month)

Supplier A 8 9
Supplier B 7 8
Supplier C 9 7
Supplier D 6 9
Supplier E 8 8

Let’s visualize this supplier scorecard sample data in Excel and glean valuable insights.

  • To get started with ChartExpo, install ChartExpo in Excel.
  • Now Click on My Apps from the INSERT menu.
insert chartexpo in excel
  • Choose ChartExpo from My Apps, then click Insert.
open chartexpo in excel
  • Once it loads, scroll through the charts list to locate and choose the “Overlapping Bar Chart”. This chart is best suited to this scenario.
search overlapping bar chart in excel
  • You will see an Overlapping Bar Chart on the screen.
Load Chart for Examining Supplier Scorecard Examples
  • Click the “Create Chart From Selection” button after selecting the data from the sheet, as shown.
Click Create Chart From Selection for Examining Supplier Scorecard Examples
  • ChartExpo will generate the visualization below for you.
Edit Chart for Examining Supplier Scorecard Examples
  • If you want to have the chart’s title, click Edit Chart, as shown in the above image.
  • Click the pencil icon next to the Chart Header to change the title.
  • It will open the properties dialog. Under the Text section, you can add a heading in Line 1 and enable Show.
  • Give the appropriate title of your chart and click the Apply button.
Add Title of Chart for Examining Supplier Scorecard Examples
  • Click the “Save Changes” button to persist the changes.
Click Save Changes for Examining Supplier Scorecard Examples
  • Your Overlapping Bar Chart will appear as below.
Final Supplier Scorecard Examples

Insights

  • Supplier A experienced a reduction in quality rating from 9 to 8.
  • Supplier B saw a decline in their rating from 8 to 7.
  • Supplier C witnessed an improvement, with their rating rising from 7 to 9.
  • Supplier D’s rating showed an increase from 6 to 9.
  • Supplier E maintained a consistent rating of 8.
  • In summary, there are variations in quality ratings across suppliers, reflecting both improvements and declines in performance.

FAQs

How do I make a vendor scorecard?

To create a vendor scorecard:

  1. Define objectives.
  2. Select key metrics and assign weights.
  3. Set performance targets and establish a data collection process.
  4. Analyze results, provide feedback, and encourage continuous improvement.
  5. Regularly update the scorecard to align with business goals.

What is the supplier scoring process?

The supplier scoring process involves the following steps;

  1. Define objectives, select metrics, and assign weights.
  2. Set performance targets, collect data, and analyze results.
  3. Provide transparent feedback, encouraging improvements.
  4. Continuously refine the scoring system to align with business goals and foster supplier collaboration.

What is a typical supplier scorecard?

A typical supplier scorecard includes defined objectives, key metrics, weighted criteria, and set performance targets. Data is collected and analyzed, and feedback is provided. It’s a dynamic tool for evaluating and improving supplier performance.

Wrap Up

Creating Supplier scorecard examples is crucial for efficient supply chain management. Defining clear objectives, identifying key metrics, and establishing weighting helps to ensure alignment with strategic goals.

Setting performance targets and collecting data systematically enables accurate evaluation. The analysis of supplier performance, followed by transparent feedback, is integral to fostering collaboration and improvement.

Continuous improvement is at the heart of the supplier scorecard process. Encouraging suppliers to implement corrective actions and collaborate on improvement plans enhances overall supply chain efficiency. Moreover, regularly updating the scorecard ensures it remains relevant to changing business dynamics and evolving objectives.

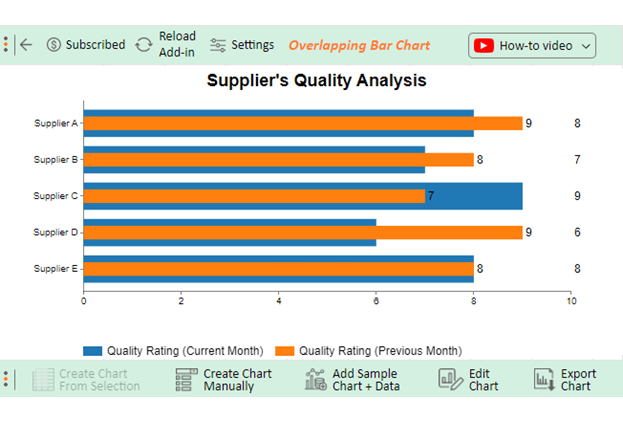
The Supplier scorecard examples are more than a tool for assessment; it’s a dynamic framework that drives collaboration and efficiency. With fluctuations in supplier ratings, the scorecard reflects both areas of improvement and those needing attention.

This real-time feedback loop ensures you don’t just evaluate suppliers. It ensures they are actively engaged in the pursuit of excellence.

A well-detailed supplier scorecard example is a strategic asset in the fast-paced business landscape. It provides a comprehensive view of supplier performance, allowing you to make informed decisions and drive continuous improvement. It catalyzes building strong, resilient, and mutually beneficial supplier relationships.

Do not hesitate.

Create a supplier scorecard with ChartExpo today to ensure a robust and optimized supply chain for sustained success.

How much did you enjoy this article?

ExcelAd2
Start Free Trial!
134043

Related articles

next previous
Microsoft Excel8 min read

Excel Task Tracker Template for Smarter Task Insights

Task tracker template in Excel organizes tasks, tracks deadlines, and boosts efficiency. Learn its benefits, and explore expert tips to simplify task management.

Microsoft Excel10 min read

Invoice Tracker Template in Excel for Better Insights

An invoice tracker Excel template helps track invoices, due dates, and payments. Learn how to use this template for better financial management.

Microsoft Excel12 min read

Key Performance Indicators in Healthcare for Better Insights

Key Performance Indicators in healthcare track patient care and efficiency. Learn about these KPIs, top examples, and how to use them to improve outcomes.

Microsoft Excel10 min read

BMI Calculation Formula in Excel for Better Fitness Insights

The BMI calculation formula in Excel helps track and analyze body mass index. Explore step-by-step instructions and tips to simplify BMI tracking in Excel.

Microsoft Excel29 min read

How to Create a Tornado Chart in Excel? A Complete Guide

Click to learn how to plot a Tornado Chart in Excel using easy-to-follow steps. Also, we’ll address the following question: what is a Tornado Diagram?

ChartExpo logo

Turn Data into Visual
Stories

CHARTEXPO

  • Home
  • Gallery
  • Videos
  • Services
  • Pricing
  • Contact us
  • FAQs
  • Privacy policy
  • Terms of Service
  • Sitemap

TOOLS

  • ChartExpo for Google Sheets
  • ChartExpo for Microsoft Excel
  • Power BI Custom Visuals by ChartExpo
  • Word Cloud

CATEGORIES

  • Bar Charts
  • Circle Graphs
  • Column Charts
  • Combo Charts
  • Comparison Charts
  • Line Graphs
  • PPC Charts
  • Sentiment Analysis Charts
  • Survey Charts

TOP CHARTS

  • Sankey Diagram
  • Likert Scale Chart
  • Comparison Bar Chart
  • Pareto Chart
  • Funnel Chart
  • Gauge Chart
  • Radar Chart
  • Radial Bar Chart
  • Sunburst Chart
  • see more
  • Scatter Plot Chart
  • CSAT Survey Bar Chart
  • CSAT Survey Chart
  • Dot Plot Chart
  • Double Bar Graph
  • Matrix Chart
  • Multi Axis Line Chart
  • Overlapping Bar Chart
  • Control Chart
  • Slope Chart
  • Clustered Bar Chart
  • Clustered Column Chart
  • Box and Whisker Plot
  • Tornado Chart
  • Waterfall Chart
  • Word Cloud
  • see less

RESOURCES

  • Blog
  • Resources
  • YouTube
SIGN UP FOR UPDATES

We wouldn't dream of spamming you or selling your info.

© 2025 ChartExpo, all rights reserved.