• Home
  • Tools dropdown img
    • Spreadsheet Charts

      • ChartExpo for Google Sheets
      • ChartExpo for Microsoft Excel
    • Power BI Charts

      • Power BI Custom Visuals by ChartExpo
    • Word Cloud

  • Charts dropdown img
    • Chart Category

      • Bar Charts
      • Circle Graphs
      • Column Charts
      • Combo Charts
      • Comparison Charts
      • Line Graphs
      • PPC Charts
      • Sentiment Analysis Charts
      • Survey Charts
    • Chart Type

      • Box and Whisker Plot
      • Clustered Bar Chart
      • Clustered Column Chart
      • Comparison Bar Chart
      • Control Chart
      • CSAT Survey Bar Chart
      • CSAT Survey Chart
      • Dot Plot Chart
      • Double Bar Graph
      • Funnel Chart
      • Gauge Chart
      • Likert Scale Chart
      • Matrix Chart
      • Multi Axis Line Chart
      • Overlapping Bar Chart
      • Pareto Chart
      • Radar Chart
      • Radial Bar Chart
      • Sankey Diagram
      • Scatter Plot Chart
      • Slope Chart
      • Sunburst Chart
      • Tornado Chart
      • Waterfall Chart
      • Word Cloud
    • Google Sheets
      Microsoft Excel
  • Services
  • Pricing
  • Contact us
  • Blog
  • Support dropdown img
      • Gallery
      • Videos
      • Contact us
      • FAQs
      • Resources
    • Please feel free to contact us

      atsupport@chartexpo.com

Categories
All Data Visualizations Data Analytics Surveys
Add-ons/
  • Google Sheets
  • Microsoft Excel
  • Power BI
All Data Visualizations Data Analytics Surveys
Add-ons
  • Google Sheets
  • Microsoft Excel
  • Power BI

We use cookies

This website uses cookies to provide better user experience and user's session management.
By continuing visiting this website you consent the use of these cookies.

Ok

ChartExpo Survey


Home > Blog > Data Analytics

Why Are Fixed vs. Variable Costs Important?

Have you ever wondered why understanding the difference between fixed vs. variable costs is crucial in business?

Picture this: you’re running a lemonade stand. You’ve got the lemons, the sugar, and the cups. But what if it starts raining, and suddenly nobody wants lemonade?

Fixed vs. Variable Costs

You’ve already spent money on the lemons and sugar your fixed costs. However, you only buy the cups when you make a sale those are your variable costs.

Understanding the difference between fixed and variable costs is just as crucial in business. It’s like knowing the weather forecast for your lemonade stand. Fixed costs stay constant, like the price of lemons, regardless of how much lemonade you sell. Variable costs, like the cups, fluctuate with your level of sales.

So, why should you care about fixed vs. variable costs?

Knowing these costs helps you make smarter decisions. It enables you to determine the profitability of your products, set the right prices, and plan for the future. Understanding these costs can be the difference between thriving and barely staying afloat in business.

This blog post will delve deeper into fixed versus variable costs. We’ll explore why they matter and how they impact your business’s bottom line. We’ll also show you how to use this knowledge to steer your business towards success.

Table of Contents:

  1. Fixed vs. Variable Costs: Definition
  2. Fixed and Variable Costs: Key Differences
  3. Recognizing the Value of Differentiating Fixed vs. Variable Costs
  4. How to Examine Fixed vs. Variable Costs?
  5. Wrap Up

So, buckle up, and let’s navigate the rollercoaster of fixed vs. variable costs together.

Fixed vs. Variable Costs: Definition

Delving into your company’s financial landscape requires a keen grasp of fixed vs. variable costs.

  • Fixed Costs

Definition: Fixed costs are stable, unchanging expenses that businesses incur regardless of production or sales levels. These costs remain constant over a specific period, providing a foundational element in the company’s financial structure. Examples of fixed costs include rent for facilities, salaries of permanent employees, insurance premiums, and lease payments.

Fixed costs provide stability and are essential for business operations. However, their rigidity necessitates careful management and strategic planning to maintain financial health and sustainability. Therefore, understanding fixed costs is crucial for stability and budgeting in the ever-evolving operations landscape and market dynamics.

  • Variable Costs

Definition: Variable costs are expenses that fluctuate based on the level of production or sales. These costs are directly proportional to the volume of goods or services produced. Examples of variable costs include raw materials, direct labor per unit, and utilities tied to production.

Unlike fixed costs, variable costs increase as production or sales increase and decrease when production levels drop. Managing variable costs is crucial to optimize efficiency, control expenses, and adapt to changes in demand. Moreover, understanding variable cost dynamics is essential for strategic decision-making and maintaining financial flexibility in dynamic market conditions.

Fixed and Variable Costs: Key Differences

Exploring the distinctions between fixed vs. variable costs unveils valuable insights.

Fixed Costs:

  1. Stability: Fixed costs, such as rent, remain constant despite changes in production or sales, offering stability in financial planning.
  2. Examples: Rent, salaries, insurance premiums necessary expenditures for maintaining business operations.
  3. Nature: Fixed costs are rigid, forming the baseline structure of a business’s financial commitments.
  4. Commitment: These costs are committed and must be paid consistently, irrespective of business activity levels.
  5. Impact: The unyielding nature of fixed costs directly impacts a business’s profitability and financial resilience.

Variable Costs:

  1. Responsiveness: Variable costs, like raw materials and labor per unit, respond directly to changes in production or sales volumes.
  2. Examples: Costs tied to production, such as raw materials and labor fluctuate with output levels.
  3. Per-unit basis: Variable costs are assessed on a per-unit basis, aligning directly with the quantity of goods or services produced.
  4. Flexibility: Variable costs offer flexibility, adjusting proportionately to changes in production levels, contributing to cost efficiency.
  5. Total cost calculation: Calculating total variable costs involves multiplying the variable cost per unit by the quantity produced. This provides a dynamic perspective on production expenses.

Recognizing the Value of Differentiating Fixed vs. Variable Costs

Fixed vs. variable costs carry significance well beyond their accounting labels, influencing the strategic architecture of business operations.

How?

  1. Cost analysis: Fixed costs provide a stable financial baseline, while variable costs are sensitive to production changes. Collectively, they allow for a nuanced analysis of an organization’s expenditure structure.
  2. Pricing decisions: A comprehensive understanding of fixed and variable costs guides pricing decisions. They help ensure you optimally set product or service prices for both profitability and competitiveness in the market. Using tools like a price comparison template in Excel can further streamline this process, allowing you to easily compare costs and make informed pricing adjustments.
  3. Break-even analysis: In break-even analysis, distinguishing between fixed vs. variable costs is essential for pinpointing the threshold where total revenue matches total costs, aiding in strategic decision-making and financial planning.
  4. Financial planning: Integrating fixed and variable costs into financial planning ensures effective resource allocation. Moreover, this fosters sustainable growth and provides stability in dynamic market conditions.
  5. Operational efficiency: Understanding fixed and variable costs enhances operational efficiency. This knowledge guides you in optimizing resources, streamlining operations, and minimizing unnecessary expenses.
  6. Strategic decision-making: Insights derived from fixed and variable costs, including the analysis of marginal revenue vs marginal cost, inform strategic decision-making. You can align business operations with overarching organizational goals and objectives from this perspective.
  7. Performance evaluation: Evaluation of fixed and variable costs serves as benchmarks for assessing business performance. This detailed analysis enables you to identify areas for improvement and optimization.
  8. Cost-Volume-Profit (CVP) analysis: CVP analysis relies on fixed and variable costs to assess the impact of production volume changes on profitability. This analysis aids in making informed decisions for sustainable growth.
  9. Risk management: Fixed and variable cost analysis is integral to risk management. It helps you identify potential financial vulnerabilities. This proactive approach allows for the development of strategies to mitigate risks effectively.
  10. Investor and stakeholder communication: Clear articulation of fixed and variable costs facilitates transparent communication with investors and stakeholders. This transparency instills confidence in financial management practices, fostering trust and collaboration.

How to Examine Fixed vs. Variable Costs?

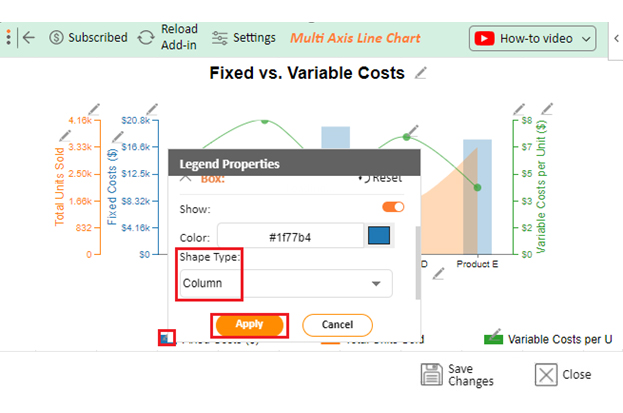
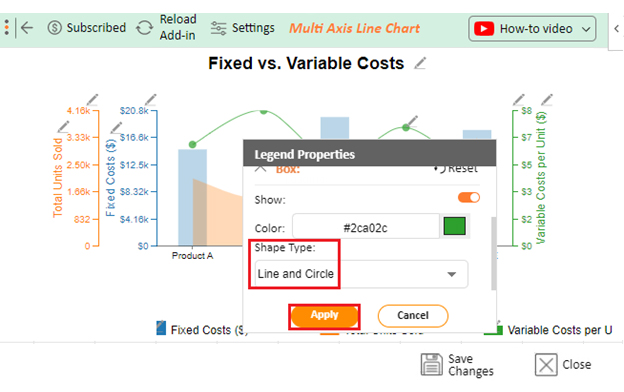
Analyzing fixed vs. variable costs is daunting and time-consuming when done manually. This is where the power of data visualization comes into play. Visualizations provide a clear and efficient way to understand and analyze this critical financial information.

While Excel is a popular tool for data visualization, its limited options can be a hindrance. ChartExpo fills this gap by seamlessly complementing Excel and offering a wide range of visualization options. This makes it ideal for creating insightful visualizations that simplify analyzing fixed vs. variable costs.

Later in this blog, I will demonstrate how you can analyze fixed versus variable costs using ChartExpo.

Let’s Learn How to Install ChartExpo in Excel.

  1. Open your Excel application.
  2. Open the worksheet and click the “Insert” menu.
  3. You’ll see the “My Apps” option.
  4. In the Office Add-ins window, click “Store” and search for ChartExpo on my Apps Store.
  5. Click the “Add” button to install ChartExpo in your Excel.

ChartExpo charts are available both in Google Sheets and Microsoft Excel. Please use the following CTA’s to install the tool of your choice and create beautiful visualizations in a few clicks in your favorite tool.

Example

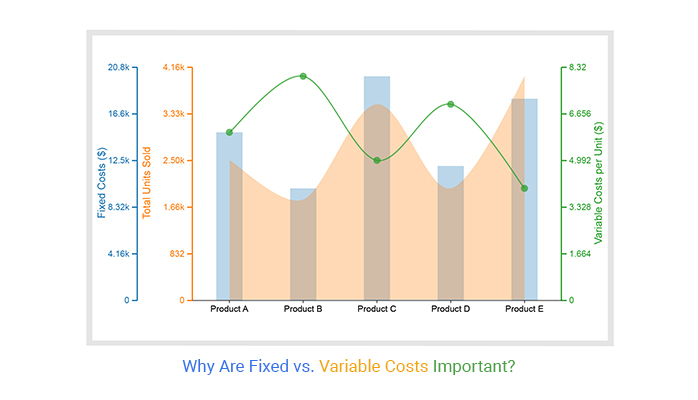
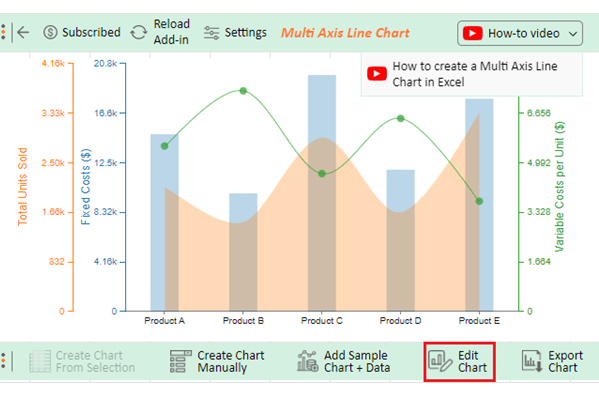
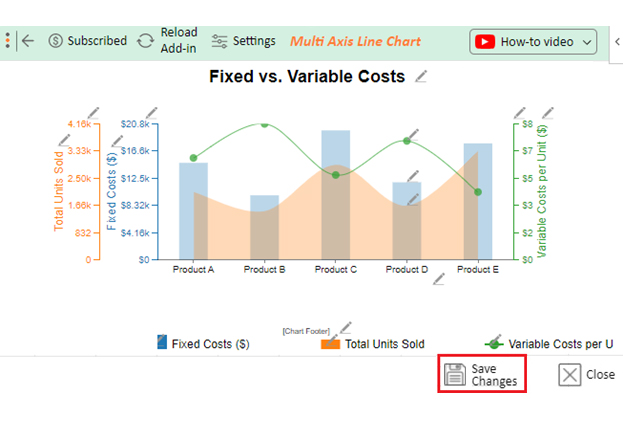
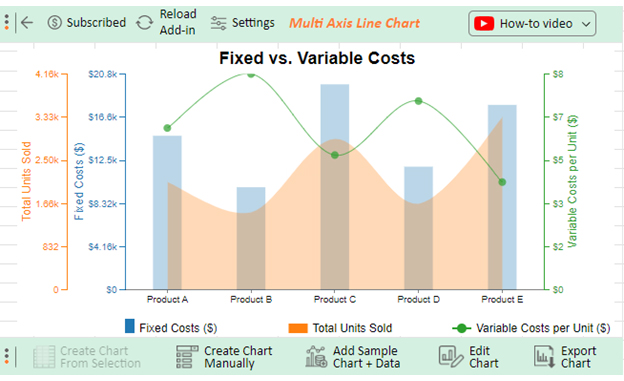
Let’s say you want to examine the data below on five products.

Product Fixed Costs ($) Variable Costs per Unit ($) Total Units Sold
Product A 15,000 6 2,500
Product B 10,000 8 1,800
Product C 20,000 5 3,500
Product D 12,000 7 2,000
Product E 18,000 4 4,000

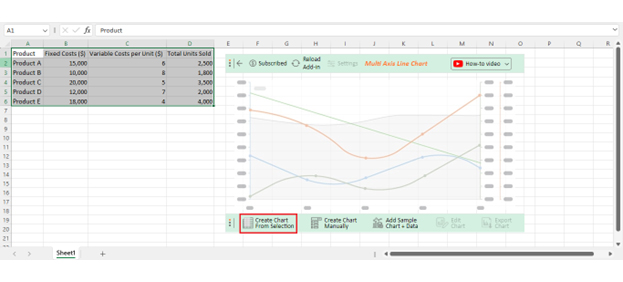
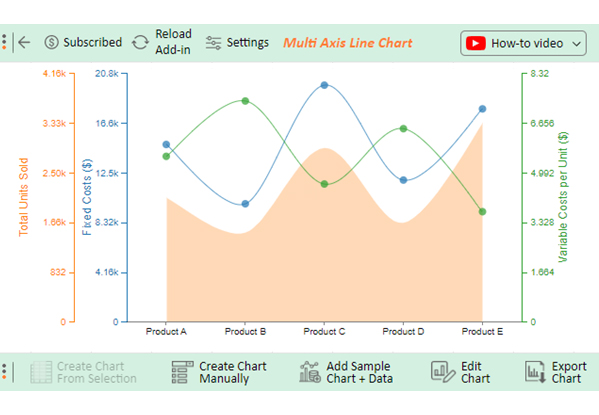
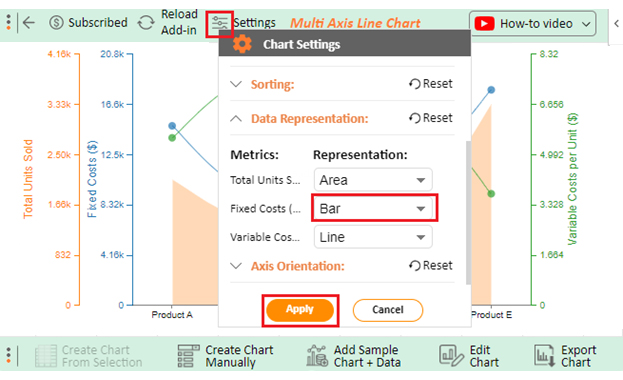
Let’s visualize this data in Excel using ChartExpo and glean valuable insights.

  • To get started with ChartExpo, install ChartExpo in Excel.
  • Now Click on My Apps from the INSERT menu.
insert chartexpo in excel
  • Choose ChartExpo from My Apps, then click Insert.
open chartexpo in excel
  • Once it loads, scroll through the charts list to locate and choose the “Multi-Axis Line Chart”.
search multi axis line chart in excel
  • Click the “Create Chart From Selection” button after selecting the data from the sheet, as shown.
Create Chart From Selection ce525
  • ChartExpo will generate the visualization below for you.
Fixed vs. Variable Costs Design Template
  • Click on Settings and change the “Data Representation” as follows.
Data Representation ce525
  • If you want to add anything to the chart, click the Edit Chart button:
Edit Chart ce525
  • Click the pencil icon next to the Chart Header to change the title.
  • It will open the properties dialog. Under the Text section, you can add a heading in Line 1 and enable Show.
  • Give the appropriate title of your chart and click the Apply button.
Apply Tittle on Chart ce525
  • Change the precision value of Variable Costs per Unit to zero and add the dollar sign:
Change precision value Variable Costs ce525
  • Change the precision value of Fixed Costs per Unit to zero and add the dollar sign:
Change precision value Fixed Costs ce525
  • Change the Legend shape of “Fixed Costs” to Column and click the “Apply” button.
Change Legend shape of Fixed Costs ce525
  • Change the Legend shape of “Variable Costs” into a Line and Circle and click the “Apply” button.
Change Legend shape of Variable Costs ce525
  • Click the “Save Changes” button to persist the changes made to the chart.
Save Changes ce525
  • Your final Multi Axis Line Chart will look like the one below.
Final Fixed vs. Variable Costs

Insights

  • Compare product cost structures using fixed and variable costs per unit. Higher fixed costs may indicate higher initial investments; higher variable costs suggest increased production expenses.
  • Examine sales volumes for product market demand insights. Higher volumes signify broader appeal or effective marketing strategies.
  • Analyze cost efficiency by comparing total costs to units sold. Lower total costs per unit indicate greater cost efficiency for a product.

FAQs

What is the difference between fixed cost and marginal cost?

Fixed costs remain constant regardless of production levels, providing stability. Marginal costs, however, change with each additional unit produced. Marginal costs capture the incremental cost of producing one more unit and directly influence short-term production decisions.

Which is better for a company, high fixed cost or variable cost?

It depends on the industry and business model. High fixed costs offer stability but may lead to losses in low production periods. High variable costs provide flexibility but may reduce profitability. A balanced cost structure is often optimal for long-term sustainability.

Why are fixed and variable costs important?

Fixed and variable costs are crucial for cost analysis, pricing decisions, break-even analysis, financial planning, and operational efficiency. They inform strategic decisions, aid performance evaluation, and facilitate risk management. Consequently, they help ensure effective resource allocation and transparent communication with investors and stakeholders.

Wrap Up

Understanding fixed vs. variable costs extends far beyond financial categorization. It becomes the compass guiding your business through the intricate terrain of economic decision-making. Fixed costs, offering stability, and variable costs, providing flexibility, collectively shape the financial landscape of an organization.

These cost distinctions play a pivotal role in cost analysis. They allow you to dissect and comprehend your business’s expenditure structures comprehensively. They guide pricing decisions, ensuring that product or service prices are set optimally for profitability and competitiveness.

Break-even analysis utilizes fixed vs. variable costs to identify the equilibrium where total revenue equals total costs, aiding in strategic decisions and financial planning.

Financial planning, an essential aspect of organizational success, is greatly influenced by fixed and variable costs. Integrating these costs ensures effective resource allocation, fostering sustainable growth and providing stability in dynamic market conditions.

Informed by insights from Fixed vs. Variable Costs, strategic decision-making aligns business operations with overarching organizational goals. Evaluating these costs serves as a benchmark for assessing business performance, allowing for continuous improvement and optimization.

Moreover, clearly articulating these costs facilitates transparent communication with investors and stakeholders. This instills confidence in financial management practices and fosters trust.

Do not hesitate.

Harness the capabilities of Fixed vs. Variable Costs with ChartExpo to achieve a clearer, visually enhanced grasp of your cost dynamics.

How much did you enjoy this article?

PBIAd1
Start Free Trial!
133810

Related articles

next previous
Data Analytics12 min read

Business Intelligence in Healthcare Industry: A Visual Approach

Business Intelligence in the healthcare industry improves patient care and streamlines operations. Learn how BI works and benefits healthcare providers.

Data Analytics10 min read

Analytics in Telecom Industry for Better Insights

Analytics in the telecom industry optimizes networks, enhances customer experience, and detect fraud. Learn its key benefits, challenges, and use cases.

Data Analytics7 min read

Financial Forecasting for Startups: A Complete Guide

This guide dives deep into financial forecasting for startups. You'll also discover elements of a financial projection for a startup, and tips for creating one.

Data Analytics32 min read

Data Reporting: Making Your Reports Irresistible

Data reporting turns numbers into insights that guide decisions. Learn how to simplify complex data and make confident choices. Read on for key strategies!

Data Analytics10 min read

Employee Performance KPIs: Insights That Drive Action

Employee performance KPIs track productivity and success. Learn the key metrics, measurement methods, and analysis techniques to boost performance.

ChartExpo logo

Turn Data into Visual
Stories

CHARTEXPO

  • Home
  • Gallery
  • Videos
  • Services
  • Pricing
  • Contact us
  • FAQs
  • Privacy policy
  • Terms of Service
  • Sitemap

TOOLS

  • ChartExpo for Google Sheets
  • ChartExpo for Microsoft Excel
  • Power BI Custom Visuals by ChartExpo
  • Word Cloud

CATEGORIES

  • Bar Charts
  • Circle Graphs
  • Column Charts
  • Combo Charts
  • Comparison Charts
  • Line Graphs
  • PPC Charts
  • Sentiment Analysis Charts
  • Survey Charts

TOP CHARTS

  • Sankey Diagram
  • Likert Scale Chart
  • Comparison Bar Chart
  • Pareto Chart
  • Funnel Chart
  • Gauge Chart
  • Radar Chart
  • Radial Bar Chart
  • Sunburst Chart
  • see more
  • Scatter Plot Chart
  • CSAT Survey Bar Chart
  • CSAT Survey Chart
  • Dot Plot Chart
  • Double Bar Graph
  • Matrix Chart
  • Multi Axis Line Chart
  • Overlapping Bar Chart
  • Control Chart
  • Slope Chart
  • Clustered Bar Chart
  • Clustered Column Chart
  • Box and Whisker Plot
  • Tornado Chart
  • Waterfall Chart
  • Word Cloud
  • see less

RESOURCES

  • Blog
  • Resources
  • YouTube
SIGN UP FOR UPDATES

We wouldn't dream of spamming you or selling your info.

© 2025 ChartExpo, all rights reserved.