Categories
You run a lemonade stand, selling refreshing beverages to parched passersby. As your customers line up, their dollars clutched tightly in anticipation; you face a perplexing dilemma. How do you determine the sweet spot where your profits are maximized?


Enter the critical economic concepts of marginal revenue vs. marginal cost.
Marginal revenue, my dear friend, is the additional revenue generated from selling one more unit of your product. Think of it as the lemon wedge in your drink.
On the other hand, marginal cost represents the additional cost incurred to produce that extra unit. It’s like the cost of that extra lemon or the wages for your hardworking assistant.
In the realm of economics, these concepts hold great power. Therefore, it’s essential to understand the delicate balance between marginal revenue and marginal cost. From this, you can unlock the secrets to maximizing profits and achieving entrepreneurial success.
Join us as we embark on this exhilarating journey through the intricate web of economic theory. Let’s discover the difference between Marginal Revenue and Marginal Cost and unravel the dynamics of marginal revenue vs. marginal cost that shape sound economic decision-making.
Embark on a comprehensive exploration of the dynamics between Marginal Revenue vs. Marginal Cost:
Definition: Marginal revenue represents the additional revenue generated from selling one more unit of a product or service. It is the change in total revenue resulting from a unit increase in quantity sold. Understanding marginal revenue is crucial in determining optimal pricing and production levels. So, you can maximize profits while considering the impact of each additional unit sold.
Definition: Marginal cost refers to the extra expense incurred from producing an additional unit of a product or service. It reflects the change in total cost resulting from a unit increase in production. Analyzing marginal cost is essential for optimizing production levels and pricing strategies. This ensures you make informed decisions that balance cost efficiency with revenue generation.
Let’s separate the marginal revenue vs. marginal cost, shall we?
Marginal revenue (MR) represents the extra income generated by selling an additional unit of a product or service. It helps businesses understand how total revenue changes due to changes in quantity sold. Conversely, Marginal cost (MC) signifies the extra expense involved in producing an additional unit. It shows how total changes with variations in production levels cost.
To calculate marginal revenue, you divide the change in total revenue by the change in quantity sold. Conversely, marginal cost is calculated by dividing the change in total cost by the change in quantity produced.
Marginal revenue serves as a vital metric for pricing decisions. If MR is greater than the marginal cost, increasing production is profitable. However, if MR is less than MC, it may be prudent to reduce production. In contrast, marginal cost aids in determining the optimal level of production to minimize costs and maximize profitability.
The ultimate goal is to optimize profits by finding the point where marginal revenue equals marginal cost. This equilibrium point signifies the most efficient production level; the business maximizes its profits without overproducing or underproducing. Optimization involves adjusting production or pricing strategies to achieve this equilibrium.
The relationship between marginal revenue and marginal cost is crucial for businesses seeking to achieve profit maximization. When MR surpasses MC, increasing production becomes a favorable contribution to profit. Conversely, if MC exceeds MR, reducing production may be more profitable. Maintaining a delicate balance between these two metrics ensures businesses informed decision-making to achieve optimal financial outcomes.
Use these parameters to compare and contrast Marginal Revenue vs. Marginal Cost and gain valuable insights into the dynamic relationship between these two critical economic metrics.
Comparing marginal revenue and marginal cost involves identifying the optimization point where the two intersect. This point signifies the production level at which a business maximizes its profit. Determining this equilibrium helps avoid underproduction or overproduction, ensuring efficient resource allocation.
Evaluating the relationship between MR and MC is essential for gauging profitability. If MR is greater than MC, producing additional units contributes positively to profit. Conversely, if MC exceeds MR, reducing production may be more profitable. Continuous assessment of this relationship helps to fine-tune production levels to optimize your business’s financial outcomes.
Comparing MR and MC allows you to assess operational efficiency. When MR and MC are in equilibrium, it suggests that you are operating at an efficient production level. This efficiency ensures you are neither underutilizing resources, leading to missed revenue opportunities, nor overproducing, incurring unnecessary costs.
Market dynamics play a significant role in comparing MR and MC. Fluctuations in demand, competition, and external factors can impact these metrics. You must adapt your strategies based on market conditions. Understanding how MR and MC respond to shifts in the market enables agile decision-making to stay competitive.
Considering the relationship between MR and MC is crucial for long-term planning. You need to anticipate changes in production costs, market demand, and pricing strategies. Continuous analysis of MR and MC guides strategic planning. It helps you navigate evolving market landscapes and make informed decisions for sustained profitability.
The comparison of MR and MC is instrumental in setting optimal prices for products or services. If MR exceeds MC, there is room for adjusting prices upward. Conversely, if MC exceeds MR, consider lowering prices. Striking the right balance through price adjustments ensures alignment of pricing strategies with market conditions and revenue maximization.
Comparing MR and MC guides decision-making at various levels of the organization. A thorough understanding of their relationship informs decisions directly impacting your business’s financial health and competitiveness. Regular assessments of these metrics contribute to agile and effective decision-making processes.
Data visualization is the superhero cape that transforms boring numbers into captivating stories. It gives your data a makeover, taking it from drab to fab.
But alas, when it comes to Excel, things can get a bit… well, lackluster.
Worry not – ChartExpo is here to the rescue. With its powerful features, ChartExpo will help you analyze marginal revenue vs. marginal cost like a pro.
Let’s learn how to install ChartExpo in Excel.
ChartExpo charts are available both in Google Sheets and Microsoft Excel. Please use the following CTAs to install the tool of your choice and create beautiful visualizations with a few clicks in your favorite tool.
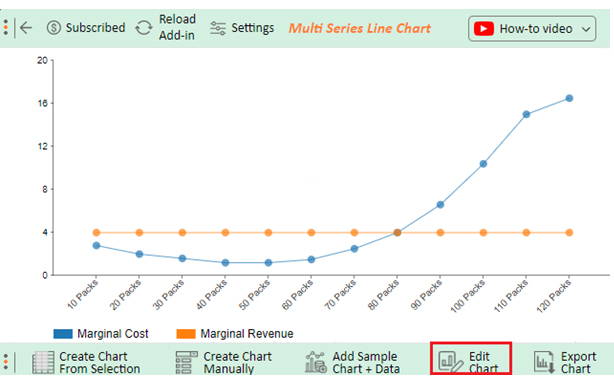
Assume you have marginal cost, and marginal revenue data against the pineapple pack quantity produced in a farm.
| Quantity | Marginal Revenue | Marginal Cost |
| 10 Packs | 4 | 2.80 |
| 20 Packs | 4 | 2.00 |
| 30 Packs | 4 | 1.60 |
| 40 Packs | 4 | 1.20 |
| 50 Packs | 4 | 1.20 |
| 60 Packs | 4 | 1.50 |
| 70 Packs | 4 | 2.50 |
| 80 Packs | 4 | 4.00 |
| 90 Packs | 4 | 6.60 |
| 100 Packs | 4 | 10.40 |
| 110 Packs | 4 | 15.00 |
| 120 Packs | 4 | 16.50 |
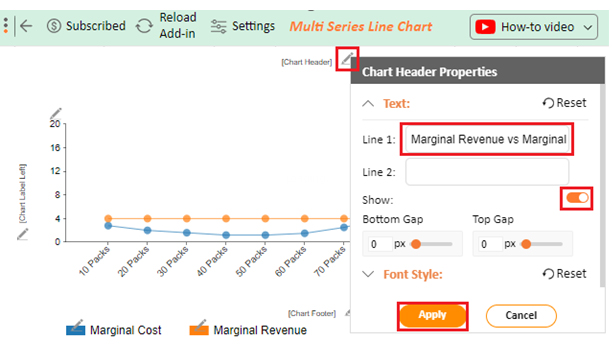
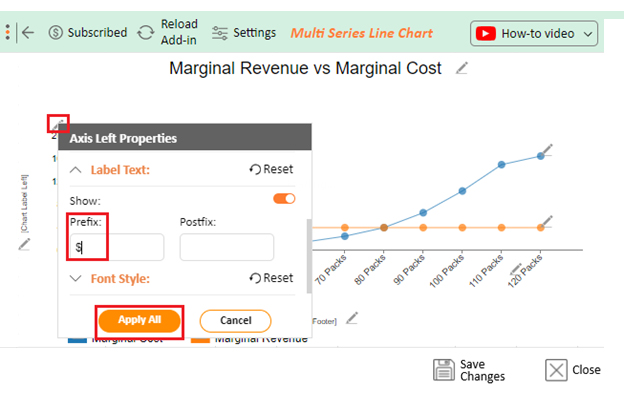
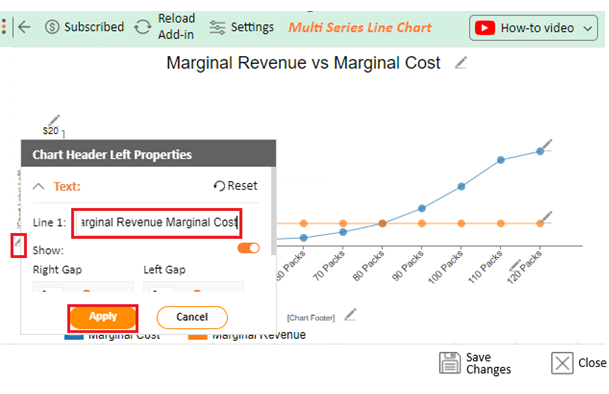
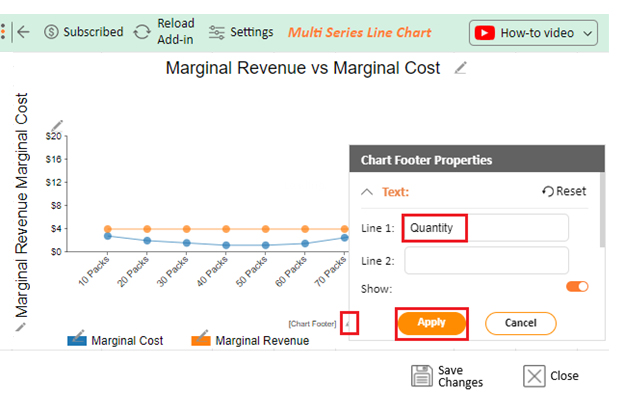
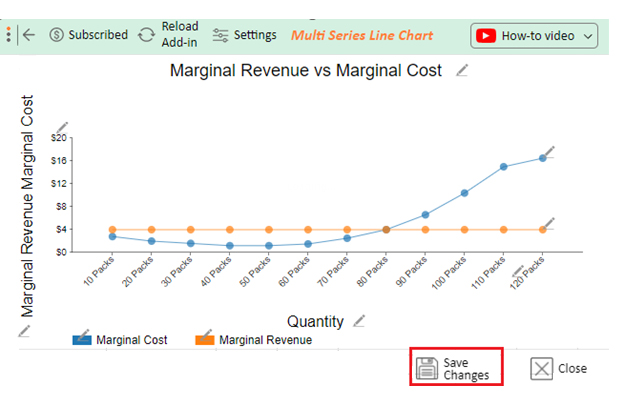
Follow these steps to create a visualization with ChartExpo and glean the MC vs MR insights.


Marginal revenue is the additional revenue generated by selling one more unit, influencing profit. Total cost encompasses all expenses incurred in production. The difference lies in their focus – MR on incremental revenue and total cost on overall production expenses.
Yes, if marginal revenue (MR) exceeds the marginal cost (MC), it indicates increased profitability. Producing more units adds more revenue than the cost incurred, contributing positively to the firm’s overall profit.
The difference between Marginal Revenue (MR) and Marginal Cost (MC) forms the crux of sound economic decision-making. MR, the additional revenue from one more unit sold, serves as a beacon for Marginal Revenue vs. Marginal Cost profit optimization. On the other hand, MC encapsulates all costs incurred in production.
The pivotal moment arises when comparing these metrics – if MR surpasses MC, expanding production proves profitable. Conversely, if MC exceeds MR, curtailing production becomes prudent. This delicate balance is the linchpin of efficient resource allocation and profit maximization.
The dance between MR and MC guides businesses through the complexities of pricing strategies, production levels, and market dynamics. The stage where MR equals MC, or hovers close to that point, represents the pinnacle of profit maximization. The ultimate goal is to find this sweet spot for Marginal Revenue vs. Marginal Cost.
In essence, the interplay between marginal revenue and marginal cost is the choreography of economic decision-making. Each step influences the financial performance of a business, guiding it towards strategic decisions.
Embrace this difference and ChartExpo to orchestrate a symphony of financial success.
How much did you enjoy this article?


Calculate accounts receivable turnover ratio to measure credit collection speed, improve cash flow, and strengthen your financial strategy. Read on!

Change Management KPIs are the key to tracking adoption, performance, and ROI during transitions. Find out which metrics matter. Read on!

Data collection methods and techniques determine the quality of every insight you act on. Explore key approaches for gathering reliable data. Read on!


