• Home
  • Tools dropdown img
    • Spreadsheet Charts

      • ChartExpo for Google Sheets
      • ChartExpo for Microsoft Excel
    • Power BI Charts

      • Power BI Custom Visuals by ChartExpo
    • Word Cloud

  • Charts dropdown img
    • Chart Category

      • Bar Charts
      • Circle Graphs
      • Column Charts
      • Combo Charts
      • Comparison Charts
      • Line Graphs
      • PPC Charts
      • Sentiment Analysis Charts
      • Survey Charts
    • Chart Type

      • Box and Whisker Plot
      • Clustered Bar Chart
      • Clustered Column Chart
      • Comparison Bar Chart
      • Control Chart
      • CSAT Survey Bar Chart
      • CSAT Survey Chart
      • Dot Plot Chart
      • Double Bar Graph
      • Funnel Chart
      • Gauge Chart
      • Likert Scale Chart
      • Matrix Chart
      • Multi Axis Line Chart
      • Overlapping Bar Chart
      • Pareto Chart
      • Radar Chart
      • Radial Bar Chart
      • Sankey Diagram
      • Scatter Plot Chart
      • Slope Chart
      • Sunburst Chart
      • Tornado Chart
      • Waterfall Chart
      • Word Cloud
    • Google Sheets
      Microsoft Excel
  • Services
  • Pricing
  • Contact us
  • Blog
  • Support dropdown img
      • Gallery
      • Videos
      • Contact us
      • FAQs
      • Resources
    • Please feel free to contact us

      atsupport@chartexpo.com

Categories
All Data Visualizations Data Analytics Surveys
Add-ons/
  • Google Sheets
  • Microsoft Excel
  • Power BI
All Data Visualizations Data Analytics Surveys
Add-ons
  • Google Sheets
  • Microsoft Excel
  • Power BI

We use cookies

This website uses cookies to provide better user experience and user's session management.
By continuing visiting this website you consent the use of these cookies.

Ok

ChartExpo Survey


Home > Blog > Microsoft Excel

3-Statement Financial Model: Design, Implementation, and Tips

3-statement financial modeling is crucial for anyone involved in finance, accounting, or business analysis. Accurate financial models open the door to making informed decisions that drive growth and success.

3-Statement Financial Modeling

Envision this scene: you’re desk-bound, enveloped by spreadsheets, facing an impending deadline. Your objective? Delivering your company’s financial forecast in the boardroom.

Amidst a whirlwind of numbers, you’re endeavoring to untangle the intricacies. The challenge? Initiating a 3-statement financial modeling journey, lacking a clear starting point.

Rest assured, we’ve all experienced that moment.

The process of mastering the creation of 3-statement financial modeling resembles harnessing a potent superpower in finance. It acts as the linchpin for accessing valuable insights into a company’s performance and potential prospects.

But where do you begin?

Rest assured; we’re here to support you. Throughout this post, we’ll lead you step by step in crafting a 3-statement financial model from scratch. Furthermore, we’ll offer practical suggestions and insights to enhance your understanding and proficiency in financial modeling.

Table of Content:

  1. Video Tutorial: How to Create a 3-Statement Model
  2. What is the 3-Statement Model?
  3. Why Does the 3-Statement Model Matter?
  4. Periodicity in a 3-Statement Model
  5. Top 3 Types of 3-Statement Model
  6. How to Read a 3-Statement Financial Model?
  7. Core Elements of a 3-Statement Financial Modeling
  8. How to Gather Data for Financial Modeling?
  9. How to Build a 3-Statement Financial Model From Scratch: Step-By-Step
    1. Step 1: Data Gathering
    2. Step 2: Assumption Setting
    3. Step 3: Income Statement Projection
    4. Step 4: Balance Sheet Construction
    5. Step 5: Cash Flow Statement Development
    6. Step 6: Supporting Schedules and Checks:
    7. Step 7: Graphs and Charts
  10. How to Visualize a 3-Statement Financial Model in Excel?
  11. How to Use the 3-Statement Financial Model?
  12. How to Format and Structure a 3-Statement Model?
  13. Tips For 3-Statement Financial Modeling 
  14. FAQs About the 3-Statement Model
  15. Wrap Up

So, roll up your sleeves and prepare to wield the power of 3-statement financial modeling.

What is the 3-Statement Model?

Definition: 3-statement financial modeling is a comprehensive financial analysis method encapsulating the income statement, balance sheet, and cash flow statement. It interconnects these statements to provide a holistic view of a company’s financial health, aiding in strategic decision-making. This modeling technique is pivotal for forecasting, valuation, and assessing a company’s overall financial performance.

Here’s an overview of each statement:

  • Income Statement (Profit and Loss Statement):

The income statement in Power BI presents a company’s revenues, costs, and profits over a specific period, providing a structured overview of its financial performance. It begins with sales, subtracts costs, and arrives at the net income. It’s a snapshot of a company’s profitability, which is crucial for assessing operational efficiency and performance.

Example:

3-Statement Financial Modeling 1
  • Balance Sheet:

The Balance Sheet provides a snapshot of a company’s financial position at a specific time. It consists of assets (what a company owns), liabilities (what it owes), and equity (ownership stake). The equation (Assets = Liabilities + Equity) reflects the balance between a company’s resources and obligations.

Example:

3-Statement Financial Modeling 2
  • Cash Flow Statement:

The Cash Flow Statement tracks the inflow and outflow of cash over a specified period. It categorizes activities into operating, investing, and financing. This statement is vital for assessing a company’s liquidity, operational strength, and ability to meet short-term obligations. Understanding the sources and uses of cash enhances financial decision-making.

Example:

3-Statement Financial Modeling 3

Why Does the 3-Statement Model Matter?

The 3-statement model is used to integrate and analyze a company’s Income Statement, Balance Sheet, and Cash Flow Statement into one cohesive framework. It provides a comprehensive view of financial health, aiding in budgeting and evaluating the impact of business decisions or potential mergers and acquisitions.

Periodicity in a 3-Statement Model

In a 3-statement model, periodicity refers to the frequency at which financial data is reported and updated. Common periodicities include:

  1. Monthly: Provides detailed insights for short-term analysis and operational decisions.
  2. Quarterly: Offers a balance between detail and manageability, useful for intermediate-term forecasting and performance tracking.
  3. Annually: Summarizes financial performance over a year, often used for long-term planning and strategic decisions.

Top 3 Types of 3-Statement Model

  1. Standard 3-Statement Model: Integrates the Income Statement, Balance Sheet, and Cash Flow Statement for basic financial analysis and forecasting.
  2. Integrated Forecasting Model: Provides detailed projections and assumptions for revenues, expenses, and capital expenditures, linking them to the three statements for more precise forecasts. This approach also ensures that the business expense report is aligned with broader financial assumptions, offering a clearer picture of overall financial health.
  3. Discounted Cash Flow (DCF) Model: Focuses on valuing a company by projecting free cash flows and discounting them to present value, using the 3-statement model to support the DCF analysis.

How to Read a 3-Statement Financial Model?

  • Review Each Statement: Understand the Income Statement for profitability, the Balance Sheet for financial position, and the Cash Flow Statement for liquidity.
  • Analyze Interconnections: Observe how net income from the Income Statement affects cash flow and impacts the Balance Sheet.
  • Evaluate Key Metrics: Focus on profitability ratios from the Income Statement, liquidity and solvency from the Balance Sheet, and cash flow trends.

Core Elements of a 3-Statement Financial Modeling

A 3-statement financial model stands as a resilient tool for thorough financial assessment. Through the integration of various components, it furnishes a comprehensive grasp of a company’s financial state. This makes it an adaptable instrument for strategic planning, decision-making, and assessing a company’s financial direction.

  • Assumptions section: This segment outlines the key assumptions underpinning the model. It includes revenue growth rates, expense projections, and other critical variables. Transparent assumptions enhance the model’s credibility.
  • Income Statement (Profit and Loss Statement): A fundamental aspect of financial reporting, the Income Statement seeks to forecast a company’s anticipated revenue sources, expenditure trends, and resultant profits over a defined reporting period.
  • Balance Sheet: Revealing a glimpse of a company’s assets, liabilities, and equity at a given point, the Balance Sheet highlights the financial posture, accentuating the balance between resources and liabilities.
  • Cash Flow Statement: Observing the cash inflow and outflow, the Cash Flow Statement organizes transactions into operating, investing, and financing sections. It is essential for analyzing liquidity and financial agility.
  • Supporting schedules: These detailed schedules clarify aspects like depreciation, debt schedules, and working capital. They supplement the core statements, offering granular insights.
  • Financial ratios: Analyzing ratios like profitability, liquidity, and solvency ratios the model’s analytical depth. Ratios offer essential performance indicators vital for decision-making.
  • Scenario analysis: The 3-financial statement model accommodates uncertainties by assessing different scenarios. This section explores best-case, worst-case, and base-case scenarios, facilitating risk assessment and strategic planning.
  • Graphs and charts: Utilizing visual representations through graphs and charts, such as an income statement template in Excel, amplifies the model’s communicative prowess.
  • Summary and conclusion: Summarizing key findings and conclusions ensures a clear takeaway. This section distills complex information into actionable insights, guiding decision-makers.
  • Documentation: Thorough documentation guarantees openness and reproducibility. It includes detailed explanations of formulas, assumptions, and methodologies, supporting model integrity.

How to Gather Data for Financial Modeling?

  1. Collect Historical Financial Statements: Obtain past Income Statements, Balance Sheets, and Cash Flow Statements from financial reports or accounting systems to understand historical performance.
  2. Research Industry Benchmarks: Look up industry standards and benchmarks to compare performance and set realistic assumptions. Sources include industry reports, market research, and financial databases.
  3. Consult Management and Stakeholders: Gather input from key personnel, including finance teams, management, and operational staff, to incorporate strategic plans, growth expectations, and operational details.
  4. Review External Data Sources: Use external sources like market trends, economic forecasts, and competitor analysis to inform assumptions and projections.
  5. Verify and Validate Data: Cross-check data for accuracy and consistency, ensuring that all sources are reliable and up-to-date.

How to Build a 3-Statement Financial Model From Scratch: Step-By-Step

3-Statement financial modeling is indispensable for conducting thorough financial analysis. This comprehensive guide outlines detailed steps, highlighting the significance of each phase in crafting a precise and enlightening model.

Step 1: Data Gathering

Collect relevant financial data from reliable sources, including historical financial statements, market trends, and industry benchmarks. Thorough data gathering forms the bedrock for precise projections, ensuring the model reflects the company’s financial reality.

Step 2: Assumption Setting

Clearly define key assumptions, including revenue growth rates, expense projections, and other factors influencing financial outcomes. Careful assumption setting lays the groundwork for accurate projections, making the model a reliable tool.

Step 3: Income Statement Projection

This step involves projecting the company’s future income statement using historical data and assumptions. This includes forecasting revenues, identifying the cost of goods sold, estimating operating expenses, and deriving the operating income.

Step 4: Balance Sheet Construction

Translate the projections from the Income Statement into the Balance Sheet. This step captures the financial position at specific points, maintaining the balance equation of assets, liabilities, and equity.

Step 5: Cash Flow Statement Development

Develop the Cash Flow Statement by meticulously tracking cash movements in operating, investing, and financing activities. This section is pivotal for assessing a company’s liquidity and cash flow dynamics.

Step 6: Supporting Schedules and Checks:

Enhance the model’s granularity by creating supporting schedules for items like depreciation, debt, and working capital. Rigorous checks ensure the accuracy of calculations, validating the model’s integrity.

Step 7: Graphs and Charts

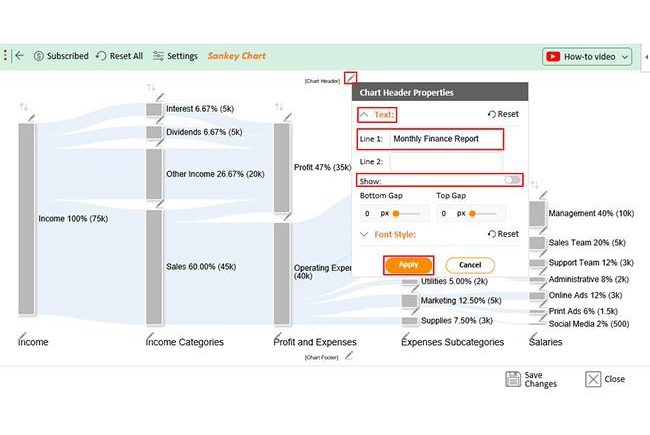
Integrate visual elements like graphs and charts for a more intuitive representation of data trends. Visual aids enhance the model’s communicative power, facilitating a clearer understanding of complex financial information.

3-Statement financial modeling recommends leveraging a pre-built financial model template to accelerate the modeling process. These templates feature predefined structures and formulas, offering a framework that can be customized to meet specific business needs.

How to Visualize a 3-Statement Financial Model in Excel?

Creating and analyzing a financial model in Excel is a complex and demanding task. It requires meticulous attention to detail and a deep understanding of financial intricacies. This is where data visualization comes into play, making financial statement modeling more insightful and impactful.

Excel serves as a formidable tool for number crunching and scenario analysis. However, when it comes to presenting and analyzing financial data, its native visualization capabilities fall short.

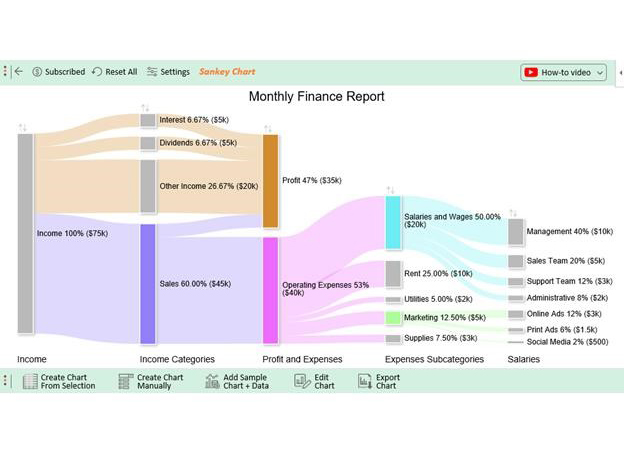
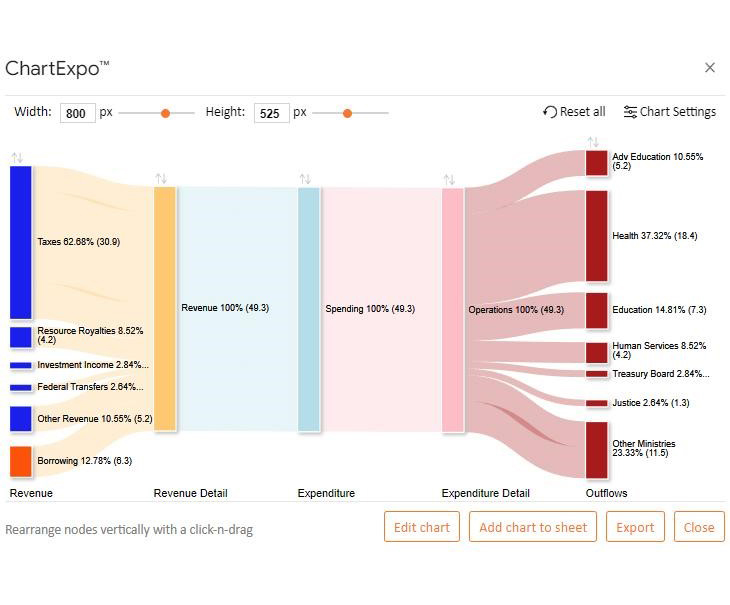
This is where ChartExpo steps into a powerful data visualization tool designed to seamlessly complement Excel. ChartExpo offers advanced visualizations to elevate the presentation and analysis of financial models.

Let’s explore how ChartExpo enhances the visualization of financial data in Excel.

But first”¦

Let’s learn how to Install ChartExpo in Excel.

  1. Open your Excel application.
  2. Open the worksheet and click the “Insert” menu.
  3. You’ll see the “My Apps” option.
  4. In the office Add-ins window, click “Store” and search for ChartExpo on my Apps Store.
  5. Click the “Add” button to install ChartExpo in your Excel.

ChartExpo charts are available both in Google Sheets and Microsoft Excel. Please use the following CTA’s to install the tool of your choice and create beautiful visualizations in a few clicks in your favorite tool.

Example

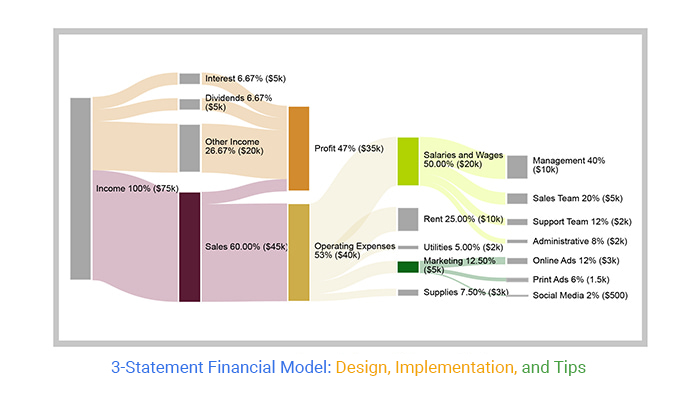
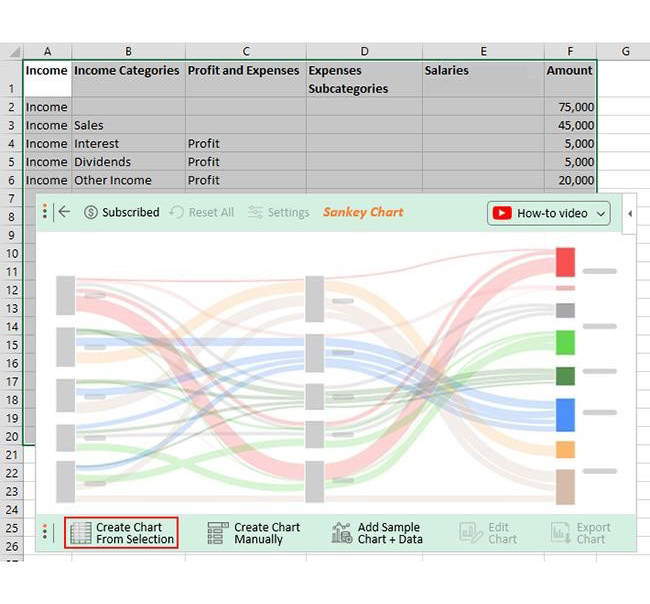
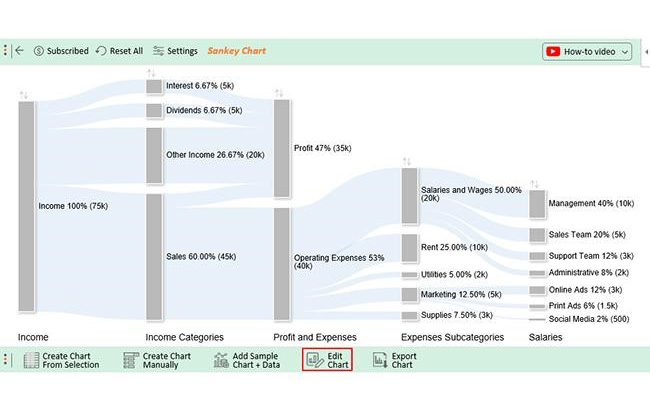
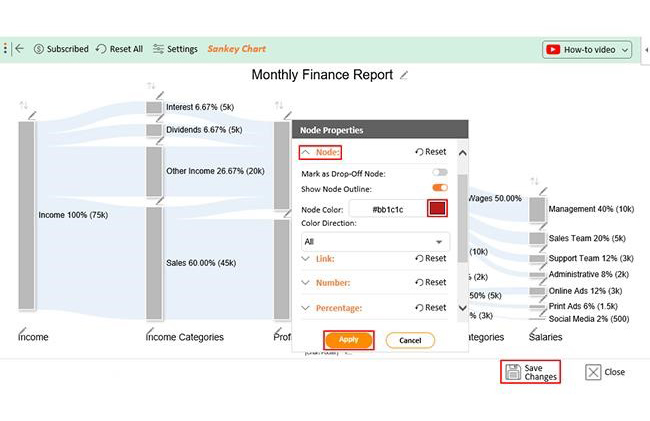
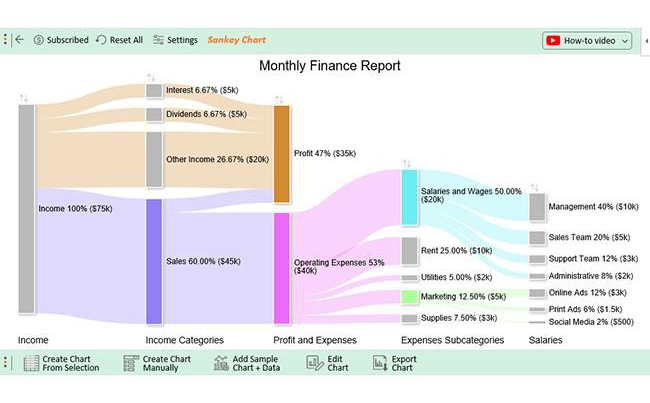
The table below contains sample financial modeling data.

Income Income Categories Profit and Expenses Expenses Subcategories Salaries Amount
Income       75,000
Income Sales       45,000
Income Interest Profit          5,000
Income Dividends Profit          5,000
Income Other Income Profit       20,000
Sales Profit          5,000
Sales Operating Expenses       40,000
Operating Expenses Salaries and Wages       20,000
Salaries and Wages Management       10,000
Salaries and Wages Sales Team          5,000
Salaries and Wages Support Team          3,000
Salaries and Wages Administrative          2,000
Operating Expenses Rent       10,000
Operating Expenses Utilities          2,000
Operating Expenses Marketing          5,000
Marketing Online Ads          3,000
Marketing Print Ads          1,500
Marketing Social Media             500
Operating Expenses Supplies          3,000

Let’s visualize this 3-statement financial modeling data to make its analysis easier. Follow these steps to create a visualization in Excel with ChartExpo.

  • To get started with ChartExpo, install ChartExpo in Excel.
  • Now Click on My Apps from the INSERT menu.
insert chartexpo in excel
  • Choose ChartExpo from My Apps, then click Insert.
open chartexpo in excel
  • Once it loads, choose the “Sankey Chart” from the charts list.
search sankey chart in excel
  • Click the “Create Chart From Selection” button after selecting the data from the sheet, as shown.
Create Chart From Selection ce520
  • ChartExpo will generate the visualization below for you.
3-Statement Financial Modeling Design Template
  • If you want to have the chart’s title, click Edit Chart, as shown in the above image.
  • Click the pencil icon next to the Chart Header to change the title.
  • It will open the properties dialog. Under the Text section, you can add a heading in Line 1 and enable Show.
  • Give the appropriate title of your chart and click the Apply button.
Apply Tittle on Chart ce520
  • Click the pencil icon at the top of nodes to add the Prefix (e.g., $ sign) with the numeric values in the chart.
  • Click the highlighted pencil icon, then expand the “Symbols” properties to add the Prefix value (e.g., $ sign).
Add the Prefix Ce520
  • Let’s give colors to the nodes. Click the pencil icon at the top of the nodes and go to “Node“. Select the color and click the “Apply” button to save all changes.
  • Click the “Save Changes” button to persist the changes.
Save Changes ce520
  • Your final chart will appear below.
Final 3-Statement Financial Modeling

Insights

  • Although revenue is generated from diverse sources, the business experiences a net loss. This is primarily attributed to rising operating costs, especially in salaries, rent, and marketing.
  • A breakdown of salaries and wages highlights that the management and sales team incur the highest costs.
  • The substantial rent expenses of $10K underscore the imperative for streamlined cost management.
  • To attain profitability, the business must vigilantly monitor its expenses, especially in high-cost segments relative to revenue, and implement effective management strategies.

How to Use the 3-Statement Financial Model?

  1. Input Assumptions: Enter assumptions for revenues, expenses, capital expenditures, and financing into the model. These assumptions drive the projections in the Income Statement, Balance Sheet, and Cash Flow Statement.
  2. Generate Projections: Use the input assumptions to project future financial performance. Review how changes in assumptions affect the Income Statement (profits), Balance Sheet (assets, liabilities, equity), and Cash Flow Statement (cash flow).
  3. Analyze Results: Evaluate the projected financial statements to assess profitability, financial position, and liquidity. Use this analysis for budgeting, forecasting, and decision-making.
  4. Perform Sensitivity Analysis: Test different scenarios by adjusting assumptions to see how variations impact the financial statements, helping to understand potential risks and opportunities.

How to Format and Structure a 3-Statement Model?

  • Separate Sheets: Create individual sheets for the Income Statement, Balance Sheet, and Cash Flow Statement.
  • Link Statements: Connect net income from the Income Statement to the Cash Flow Statement and update the Balance Sheet with changes in cash and equity.
  • Ensure Accuracy: Use formulas to ensure the Balance Sheet balances and cash flows reconcile with net income.

Tips For 3-Statement Financial Modeling

  1. Clear Structure: Organize the model with separate, well-defined sheets for the Income Statement, Balance Sheet, and Cash Flow Statement, ensuring proper linking between them.
  2. Detailed Assumptions: Document all assumptions and inputs to ensure transparency and accuracy.
  3. Consistent Formatting and Validation: Use consistent formatting for readability and regularly validate the model to ensure the Balance Sheet balances and cash flow align with net income.

FAQs About the 3-Statement Model

What is the difference between the DCF model and the 3-statement model?

The Discounted Cash Flow (DCF) model focuses on future cash flows to determine a company’s valuation, emphasizing intrinsic value. In contrast, the 3-statement model integrates Income, Balance Sheet, and Cash Flow for comprehensive financial health analysis.

What does a 3-statement model do?

A 3-statement model integrates Income, Balance Sheet, and Cash Flow statements, offering a comprehensive financial health analysis. It aids in strategic planning, decision-making, and understanding of operational and financial dynamics.

What are the three 3 financial statement analysis approaches?

  1. Horizontal Analysis: Compares financial data over time to identify trends.
  2. Vertical Analysis: Evaluate the proportions of financial data relative to a base figure.
  3. Ratio Analysis: Assesses relationships between different financial variables, providing insights into a company’s performance and health.

Wrap Up

3-Statement financial modeling entails a meticulous yet indispensable process. It encompasses gathering accurate data, establishing transparent assumptions, and projecting financial statements.

The model’s effectiveness lies in integrating the Income Statement, Balance Sheet, and Cash Flow Statement. This, as a result, provides a holistic view of a company’s financial landscape. Moreover, thorough supporting schedules, checks, and visual elements enhance its accuracy and communicative power.

3-Statement financial modeling, by utilizing a pre-built template, can expedite the process. This template serves as a solid foundation that you can customize to suit specific business needs. Each step, starting from assumption setting to constructing supporting schedules, adds to the model’s robustness.

This financial tool becomes a dynamic ally for strategic planning and decision-making in a dynamic business environment. It reflects the historical performance and is a forward-looking guide for anticipating future financial scenarios. The meticulous documentation ensures transparency, replicability, and adaptability to changing circumstances.

3-Statement financial modeling, fundamentally, is a potent asset for businesses. It facilitates informed decisions, effective risk management, and the maintenance of financial well-being. As the business environment changes, this tool becomes increasingly essential for navigating the intricacies of financial planning and analysis.

Do not hesitate.

Embrace the 3-statement financial modeling with ChartExpo today – your ticket to unlocking new opportunities.

How much did you enjoy this article?

ExcelAd1
Start Free Trial!
133638

Related articles

next previous
Microsoft Excel8 min read

Excel Task Tracker Template for Smarter Task Insights

Task tracker template in Excel organizes tasks, tracks deadlines, and boosts efficiency. Learn its benefits, and explore expert tips to simplify task management.

Microsoft Excel10 min read

Invoice Tracker Template in Excel for Better Insights

An invoice tracker Excel template helps track invoices, due dates, and payments. Learn how to use this template for better financial management.

Microsoft Excel12 min read

Key Performance Indicators in Healthcare for Better Insights

Key Performance Indicators in healthcare track patient care and efficiency. Learn about these KPIs, top examples, and how to use them to improve outcomes.

Microsoft Excel10 min read

BMI Calculation Formula in Excel for Better Fitness Insights

The BMI calculation formula in Excel helps track and analyze body mass index. Explore step-by-step instructions and tips to simplify BMI tracking in Excel.

Microsoft Excel29 min read

How to Create a Tornado Chart in Excel? A Complete Guide

Click to learn how to plot a Tornado Chart in Excel using easy-to-follow steps. Also, we’ll address the following question: what is a Tornado Diagram?

ChartExpo logo

Turn Data into Visual
Stories

CHARTEXPO

  • Home
  • Gallery
  • Videos
  • Services
  • Pricing
  • Contact us
  • FAQs
  • Privacy policy
  • Terms of Service
  • Sitemap

TOOLS

  • ChartExpo for Google Sheets
  • ChartExpo for Microsoft Excel
  • Power BI Custom Visuals by ChartExpo
  • Word Cloud

CATEGORIES

  • Bar Charts
  • Circle Graphs
  • Column Charts
  • Combo Charts
  • Comparison Charts
  • Line Graphs
  • PPC Charts
  • Sentiment Analysis Charts
  • Survey Charts

TOP CHARTS

  • Sankey Diagram
  • Likert Scale Chart
  • Comparison Bar Chart
  • Pareto Chart
  • Funnel Chart
  • Gauge Chart
  • Radar Chart
  • Radial Bar Chart
  • Sunburst Chart
  • see more
  • Scatter Plot Chart
  • CSAT Survey Bar Chart
  • CSAT Survey Chart
  • Dot Plot Chart
  • Double Bar Graph
  • Matrix Chart
  • Multi Axis Line Chart
  • Overlapping Bar Chart
  • Control Chart
  • Slope Chart
  • Clustered Bar Chart
  • Clustered Column Chart
  • Box and Whisker Plot
  • Tornado Chart
  • Waterfall Chart
  • Word Cloud
  • see less

RESOURCES

  • Blog
  • Resources
  • YouTube
SIGN UP FOR UPDATES

We wouldn't dream of spamming you or selling your info.

© 2025 ChartExpo, all rights reserved.