Categories
Embark on a journey to master the art of creating financial models in Excel, where the power of data visualization with tools like the radar chart unlocks unparalleled insights.
Imagine you’re a savvy investor evaluating a potential opportunity. You’re presented with a stack of disorganized numbers and projections that lack clarity. Frustrated, you yearn for a comprehensive financial model that paints a vivid picture of the investment’s potential.


Enter Excel, the tool that can transform scattered data into a compelling financial narrative. With Excel, you can weave together revenue forecasts, expense breakdowns, and growth assumptions with precision.
Yet, navigating the world of financial modeling can be daunting.
Fear not; Excel holds the key to unraveling complex financial concepts. Moreover, you can present them in a visually appealing, easy-to-understand format.
Excel gives you the power to craft intricate financial models that breathe life into your investment proposals. From sensitivity analysis to scenario planning, you can showcase the resilience and potential of your investments.
Ready to unlock the full potential of Excel and elevate your financial modeling expertise? Let’s embark on a journey to master the art of creating financial models in Excel.
First”¦
Definition: Excel-based financial models serve as dynamic tools for analyzing and forecasting financial performance. To visualize both the negative and positive aspects of a company’s finances, we can use a Waterfall chart in Excel. These models typically involve organizing financial data, creating formulas, and utilizing functions to generate projections. Excel’s powerful features allow for the manipulation of variables, facilitating scenario analysis and risk assessment.
The realm of creating financial models in Excel offers boundless opportunities. Excel enables users to create income statements, balance sheets, and cash flow statements, thereby gaining a detailed understanding of a company’s financial status.
Moreover, sensitivity analysis, scenario planning, and goal-seeking capabilities enhance the versatility of Excel-based models. By incorporating historical data, assumptions, and projections, creating financial models in Excel allows for dynamic analysis of various financial metrics, empowering users for data-driven decision-making.
Financial modeling helps in making informed decisions by forecasting future financial outcomes and assessing risks. It is used for valuing investments and companies, developing detailed budgets, and forecasting financial performance, including return on investment capital. This structured approach enables businesses to plan effectively and evaluate the impact of various scenarios on their financial health.
When it comes to creating financial models in Excel, the software serves as a versatile canvas capable of constructing a myriad of models. Each of these models assumes a unique role, providing essential insights vital for decision-making, planning, and valuation.
Budgeting models in Excel provide a systematic framework to plan and allocate resources, especially for performance-based budgeting. They help set financial targets, monitor expenses, and ensure financial stability by aligning expenditures with strategic goals.
Forecasting models enable you to predict future trends and performance. These models incorporate historical data and relevant assumptions, aiding in anticipating market changes, sales trajectories, and financial outcomes. Utilizing tools like an income statement template in Excel can further enhance the accuracy of these forecasts by providing a structured format for analyzing financial data.
Valuation models assess the worth of a business or asset. This Excel financial model helps to determine fair market value, supporting investment decisions. It employs various methods, such as discounted cash flows (DCF) and comparable company analysis (CCA).
Cash flow models focus on tracking the inflow and outflow of cash within a business. They ensure liquidity by forecasting and managing cash movements, providing a critical perspective on your company’s financial health.
Financial statement models encompass income statements, balance sheets, and cash flow statements. These comprehensive models offer a holistic view of your company’s financial performance, aiding in strategic planning and analysis.
M&A models assist in evaluating the financial implications of mergers, acquisitions, or divestitures. Consequently, they help assess synergies, estimate transaction values, and make informed decisions during corporate transactions.
Loan amortization models outline the repayment schedule for loans. These models help borrowers understand the distribution of payments over time, including interest and principal components. This, as a result, facilitates effective debt management.
Portfolio models in Excel aid investors in managing and optimizing their investment portfolios. They consider risk, return, and diversification, assisting investors in making informed decisions to achieve their financial objectives.
Options pricing models calculate the theoretical value of financial options. They use mathematical formulas to assess option prices. Consequently, they assist investors and traders in understanding potential risks and returns in the options market.
Capital budgeting models guide organizations in making investment decisions, and integrating a finance dashboard in Excel helps visualize project performance and financial implications, supporting strategic planning and optimal allocation of resources.
Sensitivity analysis models assess how changes in variables impact financial outcomes. This Excel financial modeling allows you to analyze the sensitivity of key parameters. Consequently, it provides insights into potential risks and uncertainties.
Scenario analysis models in Excel explore different potential future situations. By incorporating a 3-statement financial model into these scenarios, you can examine how changes in key assumptions affect financial statements.
Modeling various scenarios helps you better prepare for uncertainties, allowing you to make strategic decisions that are robust across a range of possible outcomes.
This model helps in planning and tracking expenses against budgeted amounts. It typically includes categories for various costs and revenues, allowing you to monitor financial performance and make adjustments to stay within budget.
Project future cash inflows and outflows to ensure that a business has enough liquidity to meet its obligations. It helps in planning for short-term cash needs and identifying potential funding gaps.
Calculates the present value of an investment based on its expected future cash flows, discounted at a specified rate. This model is used for valuing companies, projects, or assets and making investment decisions.
Uses historical data and statistical methods to predict future financial outcomes, such as sales, revenue, or expenses. It assists in strategic planning by providing insights into potential future performance.
Determines the sales volume needed to cover all fixed and variable costs, indicating the point at which a business starts to generate profit. This model helps in pricing strategies and assessing the viability of business ventures.
Embarking on a data analysis journey is akin to navigating a labyrinth of numbers and patterns. This challenge beckons both the analytical and creative mind.
Amidst this labyrinth, data visualization emerges as the guiding light. It illuminates insights and anomalies hidden within the numerical maze.
While Excel is a formidable ally in financial modeling, its visualization capabilities often fall short. This is where ChartExpo strides in—a beacon of innovation in data visualization, making it effortless to create a Sankey diagram in Excel for clearer data storytelling.
ChartExpo offers a bridge between the analytical prowess of Excel and the captivating storytelling of visual data representation.
Let’s learn how to install ChartExpo in Excel.
ChartExpo charts are available in Google Sheets and Microsoft Excel. Please use the following CTAs to install your favorite tool and create beautiful visualizations, such as a funds flow diagram, with just a few clicks.
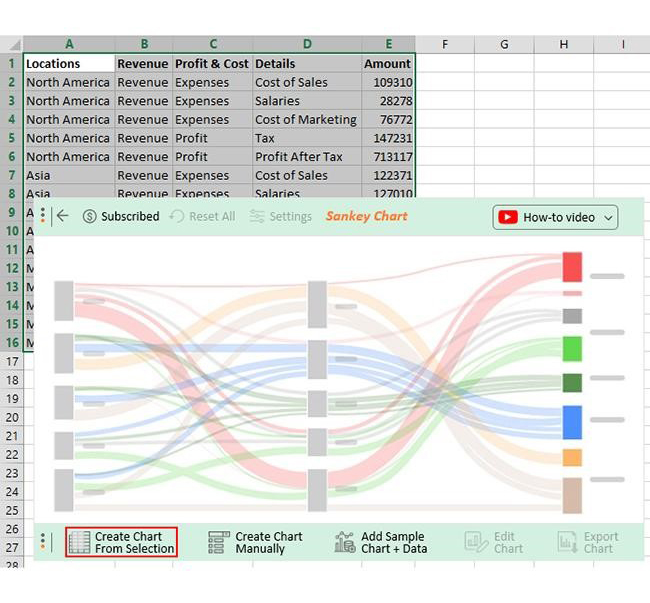
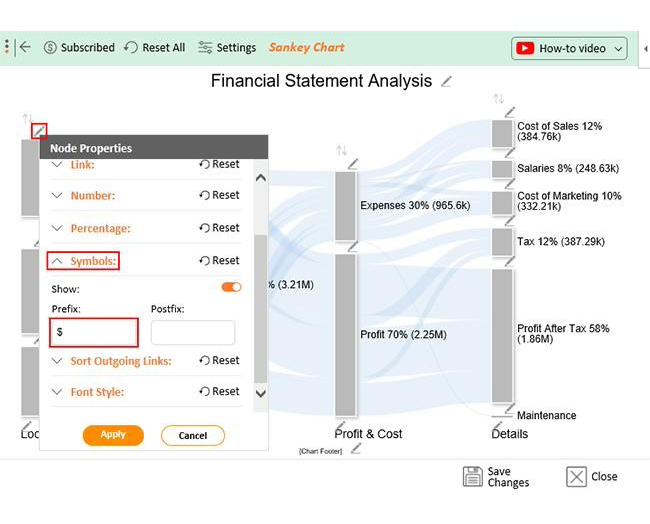
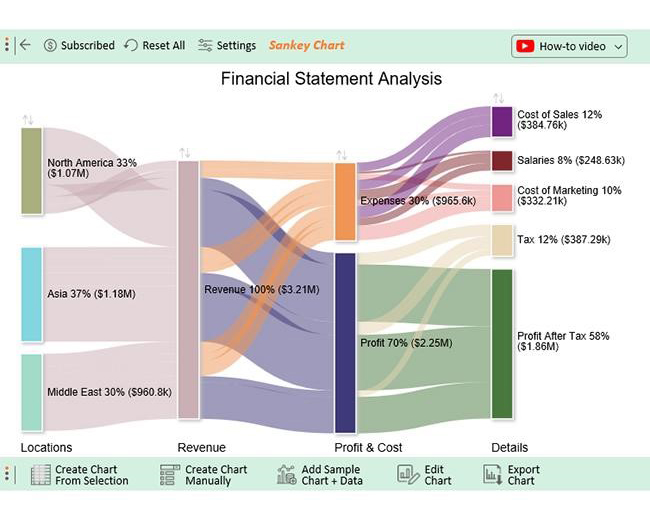
Let’s say you’re working with the sample financial charts in Excel data below.
| Locations | Revenue | Profit & Cost | Details | Amount |
| North America | Revenue | Expenses | Cost of Sales | 109310 |
| North America | Revenue | Expenses | Salaries | 28278 |
| North America | Revenue | Expenses | Cost of Marketing | 76772 |
| North America | Revenue | Profit | Tax | 147231 |
| North America | Revenue | Profit | Profit After Tax | 713117 |
| Asia | Revenue | Expenses | Cost of Sales | 122371 |
| Asia | Revenue | Expenses | Salaries | 127010 |
| Asia | Revenue | Expenses | Cost of Marketing | 72919 |
| Asia | Revenue | Profit | Tax | 161953 |
| Asia | Revenue | Profit | Profit After Tax | 692948 |
| Middle East | Revenue | Expenses | Cost of Sales | 153080 |
| Middle East | Revenue | Expenses | Salaries | 93339 |
| Middle East | Revenue | Expenses | Cost of Marketing | 182517 |
| Middle East | Revenue | Profit | Tax | 78101 |
| Middle East | Revenue | Profit | Profit After Tax | 453762 |
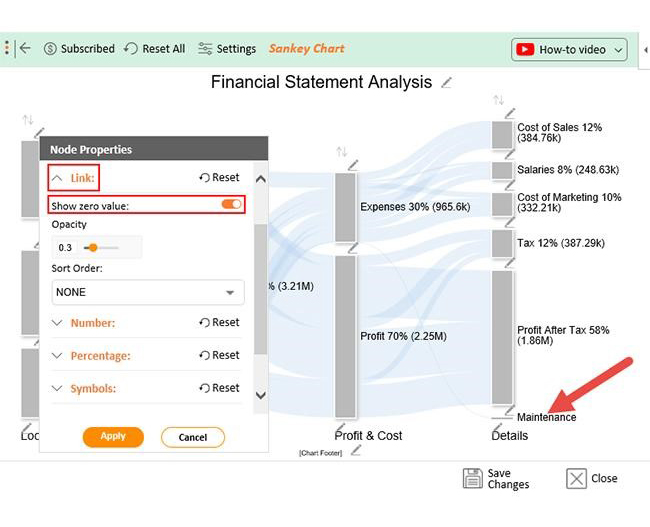
| Middle East | Revenue | Expenses | Maintenance |
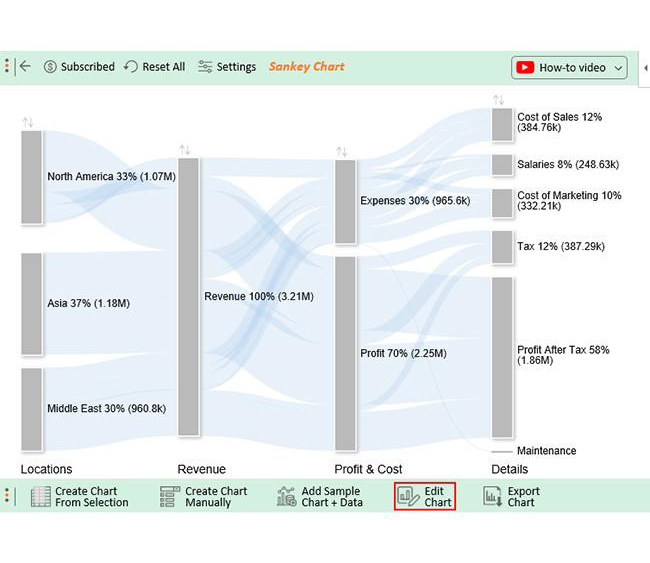
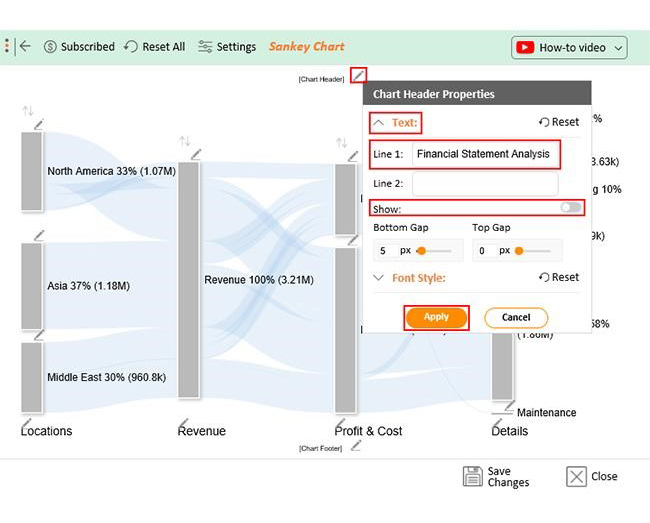
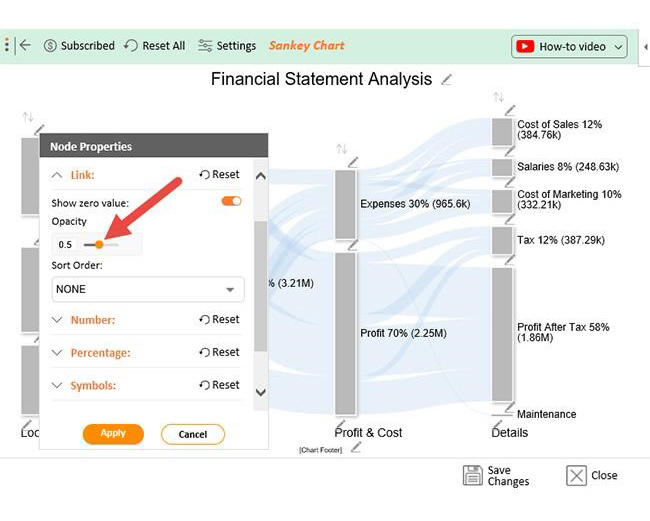
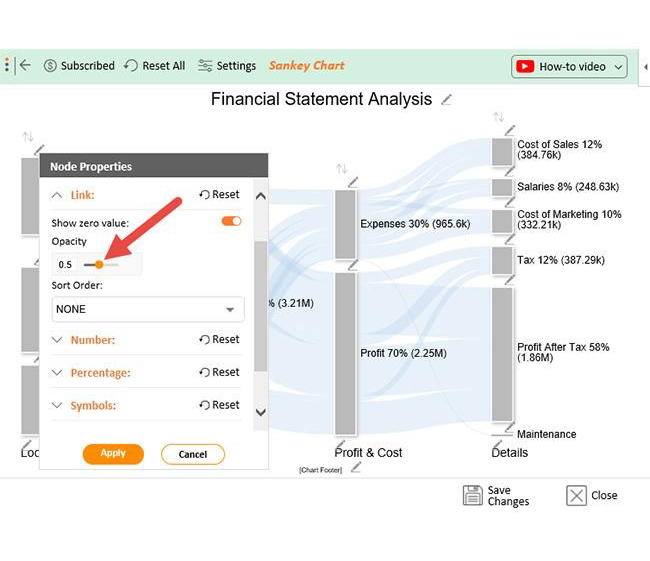
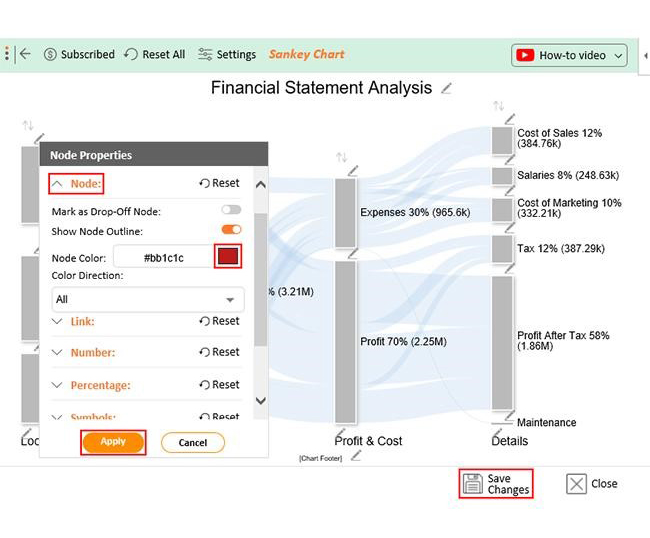
Follow these steps to visualize this data using a Sankey chart with ChartExpo and examine it.


Creating financial models in Excel demands precision and foresight. Adhering to these best practices will ensure your models’ accuracy, reliability, and user-friendliness.
Adding unnecessary complexity can make the model difficult to understand and prone to errors. Simplicity and clarity are key.
Using unrealistic or outdated assumptions can lead to misleading charts and results. It’s crucial to base assumptions on reliable data and realistic scenarios to avoid inaccuracies in your analysis.
Inconsistencies in formulas, data sources, or formatting can cause confusion and errors. Ensuring uniformity throughout the model is essential.
Failing to test how changes in assumptions impact outcomes can lead to overconfidence in the model’s predictions. Sensitivity analysis helps in understanding potential risks.
Not documenting assumptions, sources, and methodologies can make it challenging for others to review or update the model. Clear documentation is important for transparency and future use.
To create a simple financial model, use Excel;
Key financial modeling formulas in Excel include SUM, NPV, IRR, PMT, VLOOKUP, HLOOKUP, INDEX, MATCH, and IF. These formulas are vital for cash flow projections, valuation, and analyzing financial data in comprehensive Excel models.
The time to create a financial model in Excel varies based on complexity. A simple model may take a few hours, while more intricate models could require days or weeks. Thorough planning, data accuracy, and familiarity with Excel expedite the process.
Creating financial models in Excel is both an art and a science. It involves meticulous attention to detail, strategic planning, and leveraging Excel’s versatile features. Each stage, from initial organization to complex formula application, contributes to the model’s overall efficacy.
Maintaining a structured approach, including consistent naming conventions, ensures the model’s reliability and facilitates a clear audit trail. Moreover, incorporating error-checking mechanisms, designing user-friendly interfaces, and providing thorough documentation enhance the model’s clarity and usability.
Whether constructing budgeting models, valuation models, or engaging in sensitivity analysis, precision is crucial. Collaboration, seeking feedback, and regular reviews elevate the model’s quality and foster a culture of continuous improvement.
ChartExpo revolutionizes financial modeling in Excel, seamlessly blending data visualization with spreadsheet functionality. Its visualizations elevate mundane spreadsheets into vibrant, interactive representations, enhancing comprehension and strategic decision-making.
Conclusively, creating financial models in Excel emerges as a strategic asset. It empowers you to navigate uncertainties, make informed decisions, and shape your business’s trajectory in a data-driven environment.
Do not hesitate.
Embrace financial modeling in Excel with ChartExpo today and navigate financial landscapes with precision and confidence.
How much did you enjoy this article?


Learn how to use sparklines in Excel to quickly visualize trends inside cells. Discover types, creation steps, customization, use cases, benefits, and best practices.

Learn what a confidence interval graph is, how to create it in Excel, and how to interpret results to make more reliable, data-driven decisions.

A correlation matrix in Excel helps identify relationships between variables. Learn how to create, read, and use it for effective data analysis.


