Categories
Are you ready to crack the code of finance? In this blog post, we’ll uncover the secrets of how to calculate return on investment capital. With the global economy constantly evolving, having a firm grasp on this concept is more important than ever.


Now, you may wonder what the return on investment capital is. Well, in simple terms, it’s a measure of the profitability of an investment or business venture. Interestingly, studies show that companies/ investors who clearly understand ROIC make informed, successful financial decisions. This results in a 15% increase in overall profitability compared to those without such clarity.
Here’s the catch. 76% of investors struggle with accurately computing their return on investment capital.
But fear not; unraveling the complexities of how to calculate return on investment capital doesn’t have to be daunting. We’ll break it down into manageable steps. This will enable you to gauge the efficiency of your investment and make sound financial choices.
So, buckle up – it’s time to level up your investment game and become an ROIC calculation maestro. Your financial IQ is about to get a serious upgrade.
First…
Definition: Return on Investment Capital (ROIC) is like a business scorecard. It tells us how good a company is at turning its investments into profit. Think of it as a performance check – the higher, the better.
To calculate ROIC, we use a formula: divide the net operating profit after taxes (NOPAT) by the invested capital. This might sound jargon-y, but it’s like checking how well a team plays with the money they have.
Investors really like ROIC. Why? Because it’s a no-nonsense way to see if a company is making smart moves with its money. A high ROIC is like a gold star, showing the company is using its resources wisely. Conversely, a low ROIC can be a warning sign that things might not be going well.
In a nutshell, ROIC is your financial GPS, helping you navigate the market and pick the winning players. Understanding it gives you a sneak peek into a company’s financial health – pretty handy for making investment choices.
Definition: ROIC stands for Return on Investment Capital. It is a financial metric that assesses a company’s efficiency in generating profits from its invested capital. It represents the return a business earns on the total capital invested, including both equity and debt.
What is the formula for return on invested capital/ what is the ROIC equation?
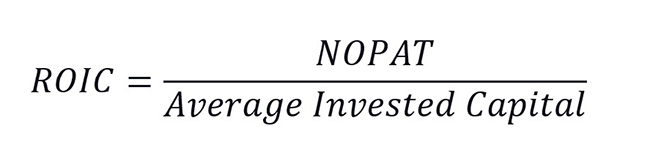
Let’s break it down. NOPAT is a company’s profit from its core operations, excluding taxes. The average invested capital is the average of the company’s debt and equity over a specified period. When you divide NOPAT by Average Invested Capital and multiply by 100, you get the ROIC.
Let’s use an example to learn how to calculate return on investment capital.
Assume XYZ company has a NOPAT of $500,000 and an average invested capital of $2 million. The ROIC would be:
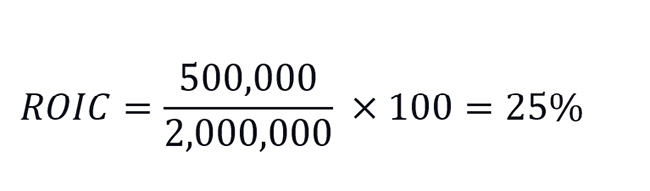
So, the ROIC for Company XYZ is 25%. This means the company generates a 25% return for every dollar of invested capital. A higher ROIC indicates efficient capital utilization. This makes it an attractive metric for investors seeking companies with a strong track record of turning investments into profits.
Return on Investment Capital (ROIC) transcends mere numbers, offering profound insights into a company’s financial landscape. Let’s dissect why it isn’t just another acronym but a crucial ally in fiscal wisdom.
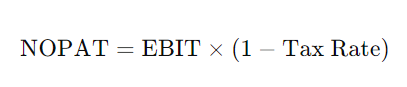
The formula for Return on Invested Capital (ROIC) is:
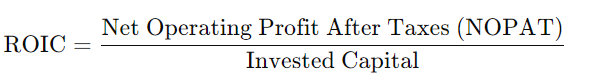
Invested Capital = Total Assets – Non-Interest-Bearing Current Liabilities
NOPAT=EBIT×(1−Tax Rate)=500,000×(1−0.30)=500,000×0.70=350,000
Invested Capital = Total Assets – Non-Interest-Bearing Current Liabilities
Invested Capital = 2,000,000 – 500,000 = 1,500,000
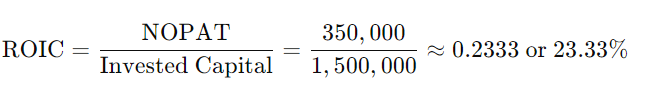
In this example, the ROIC of 23.33% indicates that the company generates a return of 23.33 cents for every dollar of invested capital, suggesting efficient capital use.
Data analysis is like navigating a maze blindfolded – challenging yet oddly exhilarating. But don’t worry. Data visualization is the beacon in the fog of numbers.
Excel, the dependable workhorse of spreadsheets, crunches numbers with finesse. However, when it comes to visual storytelling, it’s like a mime in a library – silent and lacking flair.
This is where ChartExpo swoops in like a superhero, rescuing you from Excel’s visualization limitations. With ChartExpo, data analysis becomes a captivating journey of discovery. Insights leap off the screen like characters in a 3D movie.
So, fasten your seatbelt and get ready to witness your data in a whole new dimension.
Let’s learn how to install ChartExpo in Excel.
ChartExpo charts are available both in Google Sheets and Microsoft Excel. Please use the following CTAs to install the tool of your choice and create beautiful visualizations in a few clicks in your favorite tool.
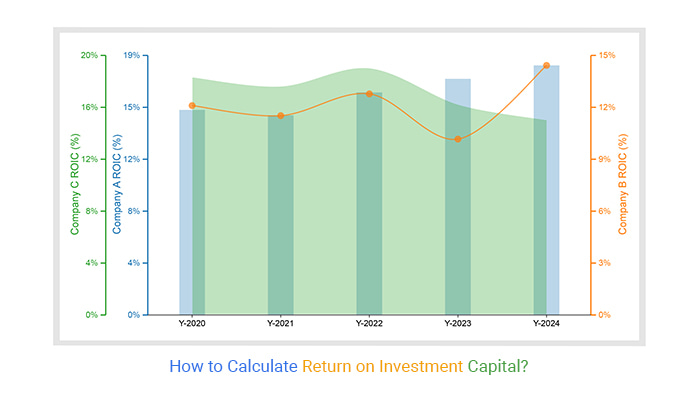
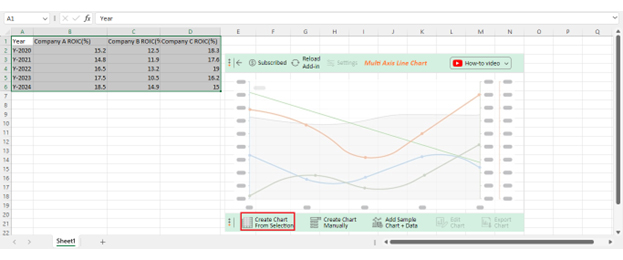
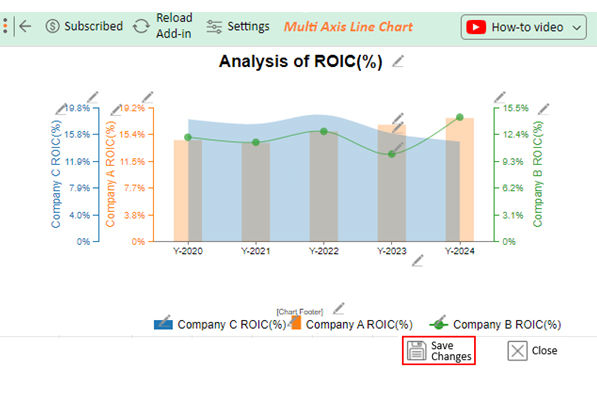
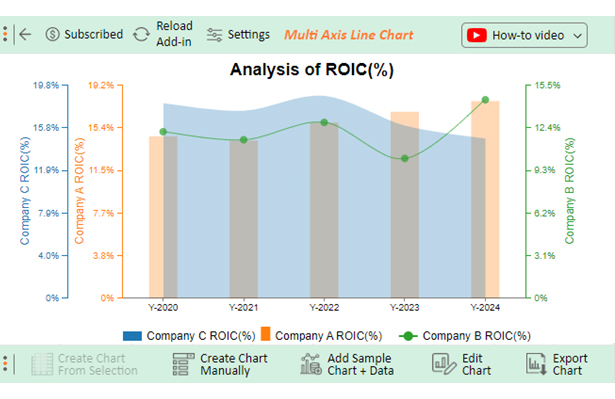
The table below contains ROIC sample data for three companies.
| Year | Company A ROIC (%) | Company B ROIC (%) | Company C ROIC (%) |
| Y-2020 | 15.2 | 12.5 | 18.3 |
| Y-2021 | 14.8 | 11.9 | 17.6 |
| Y-2022 | 16.5 | 13.2 | 19 |
| Y-2023 | 17.5 | 10.5 | 16.2 |
| Y-2024 | 18.5 | 14.9 | 15 |
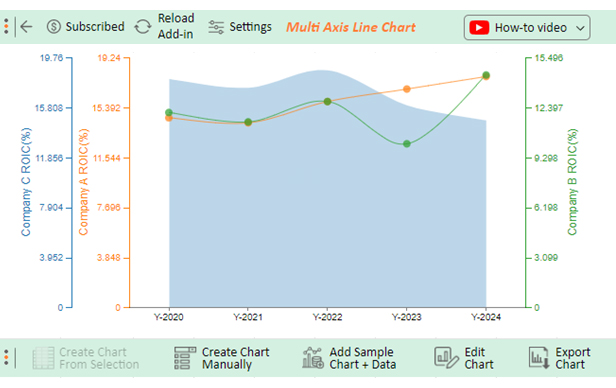
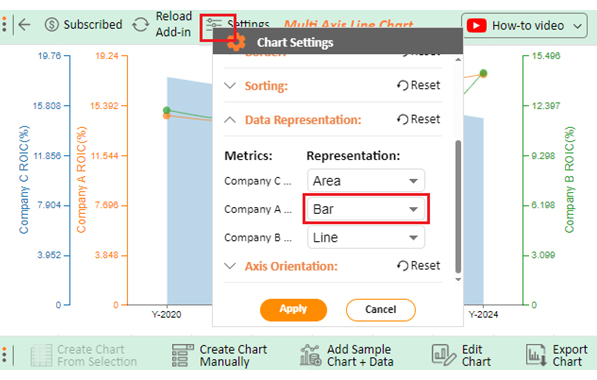
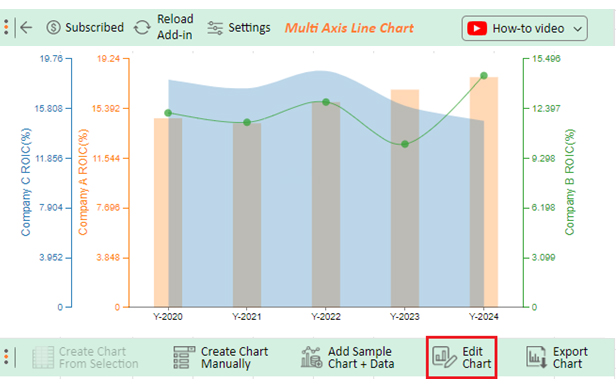
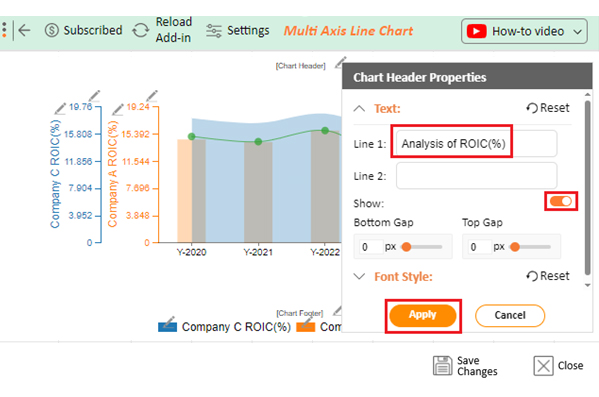
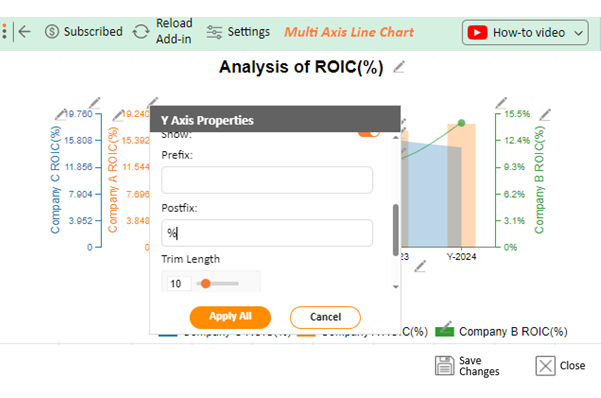
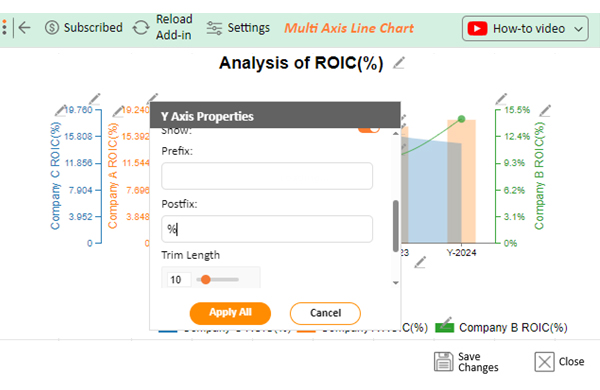
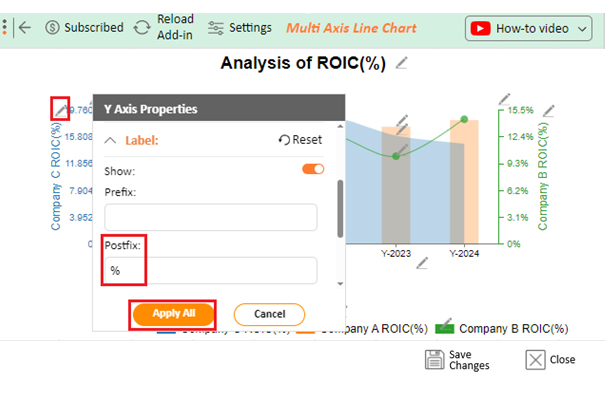
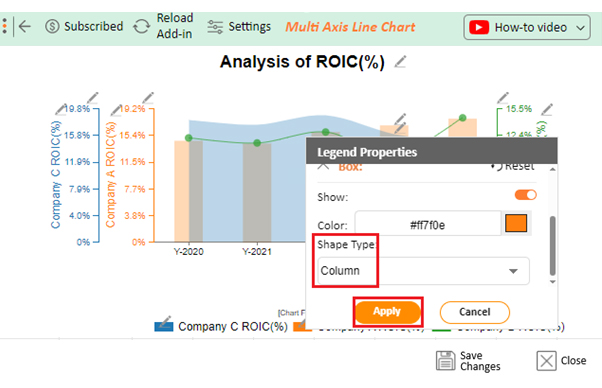
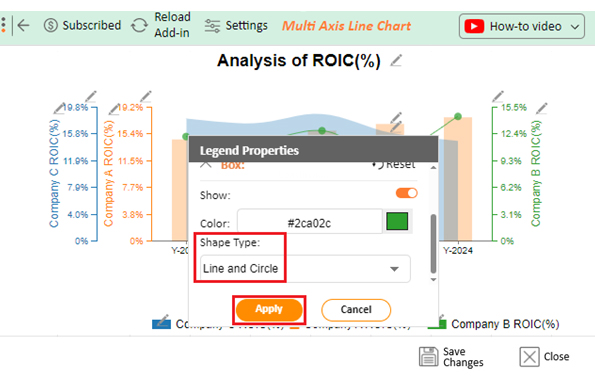
Follow these steps to learn how to visualize and analyze this data in Excel using ChartExpo.


A good ROIC ratio typically ranges above 10-15%, indicating that a company is effectively using its capital to generate profits. A higher ROIC indicates that the company is generating substantial returns on the capital invested in its operations.
Are you wondering if there’s more to the Return on Investment Capital (ROIC) story? Brace yourself. Like any financial metric, ROIC has limitations, offering a peek behind the numerical curtain.
To calculate Return on Invested Capital (ROIC), divide Net Operating Profit After Taxes (NOPAT) by the Average Invested Capital. The formula is ROIC = NOPAT / Average Invested Capital. This ratio reveals a company’s efficiency in generating returns from its capital.
A good Return on Investment Capital (ROIC) varies by industry but generally exceeds the cost of capital. A ROIC surpassing 10-12% is often considered favorable. Higher percentages suggest efficient capital use, while lower ones may indicate less effective deployment.
Yes, a 10% return on investment is realistic and achievable in various industries. It depends on factors like risk tolerance, market conditions, and the specific investment. Consistent and sustainable returns may require careful analysis and strategic decision-making.
Learning how to calculate Return on Investment Capital (ROIC) opens a gateway to financial understanding. This metric, a beacon in the fiscal landscape, unveils a company’s efficiency in turning invested capital into profit. Its simplicity, encapsulated in the formula ROIC = NOPAT / Average Invested Capital, belies its profound implications.
ROIC is more than a numerical output; it’s a strategic tool for investors and decision-makers alike. Its ability to measure efficiency, facilitate comparative analysis, and evaluate long-term performance is unmatched. Through ROIC, investment decisions become informed, guided by the metric’s keen eye for efficient capital deployment.
Capital allocation finds direction as ROIC navigates companies through the intricacies of projects and initiatives. It identifies growth opportunities as prospects and strategic pathways based on sound financial principles. ROIC also serves as a real-time performance tracker, offering a dynamic pulse check for investors adjusting their strategies.
Yet, ROIC has limitations – nuances in accounting assumptions, non-operating items, and industry variations require careful consideration. Despite this, ROIC remains an indispensable ally in the quest for financial wisdom.
Do not hesitate.
Embrace the power of ROIC with ChartExpo today to decode the secrets of investment returns. It is not just about numbers; it’s about deciphering the language of financial health, sustainability, and strategic growth.
How much did you enjoy this article?


Calculate accounts receivable turnover ratio to measure credit collection speed, improve cash flow, and strengthen your financial strategy. Read on!

Change Management KPIs are the key to tracking adoption, performance, and ROI during transitions. Find out which metrics matter. Read on!

Data collection methods and techniques determine the quality of every insight you act on. Explore key approaches for gathering reliable data. Read on!


