• Home
  • Tools dropdown img
    • Spreadsheet Charts

      • ChartExpo for Google Sheets
      • ChartExpo for Microsoft Excel
    • Power BI Charts

      • Power BI Custom Visuals by ChartExpo
    • Word Cloud

  • Charts dropdown img
    • Chart Category

      • Bar Charts
      • Circle Graphs
      • Column Charts
      • Combo Charts
      • Comparison Charts
      • Line Graphs
      • PPC Charts
      • Sentiment Analysis Charts
      • Survey Charts
    • Chart Type

      • Box and Whisker Plot
      • Clustered Bar Chart
      • Clustered Column Chart
      • Comparison Bar Chart
      • Control Chart
      • CSAT Survey Bar Chart
      • CSAT Survey Chart
      • Dot Plot Chart
      • Double Bar Graph
      • Funnel Chart
      • Gauge Chart
      • Likert Scale Chart
      • Matrix Chart
      • Multi Axis Line Chart
      • Overlapping Bar Chart
      • Pareto Chart
      • Radar Chart
      • Radial Bar Chart
      • Sankey Diagram
      • Scatter Plot Chart
      • Slope Chart
      • Sunburst Chart
      • Tornado Chart
      • Waterfall Chart
      • Word Cloud
    • Google Sheets
      Microsoft Excel
  • Services
  • Pricing
  • Contact us
  • Blog
  • Support dropdown img
      • Gallery
      • Videos
      • Contact us
      • FAQs
      • Resources
    • Please feel free to contact us

      atsupport@chartexpo.com

Categories
All Data Visualizations Data Analytics Surveys
Add-ons/
  • Google Sheets
  • Microsoft Excel
  • Power BI
All Data Visualizations Data Analytics Surveys
Add-ons
  • Google Sheets
  • Microsoft Excel
  • Power BI

We use cookies

This website uses cookies to provide better user experience and user's session management.
By continuing visiting this website you consent the use of these cookies.

Ok

ChartExpo Survey


Home > Blog > Data Analytics

Debt-to-Total Assets Ratio Analysis: Illustrated Insights

Let us sail through the world of debt-to-total assets ratio analysis. This fundamental financial metric, often overlooked, has been a cornerstone of financial assessment since its inception.

Debt-to-Total Assets Ratio Analysis

Dating back to the early 20th century, the debt-to-total assets ratio analysis has been a beacon of insight. It has weathered market crashes and economic upheavals, remaining a steadfast investment guide.

In today’s dynamic business landscape, understanding this ratio is vital for making informed investment and operational decisions. It offers invaluable insights into a company’s financial structure and risk profile. This empowers you to see beyond the numbers, deciphering the story behind a company’s financial stability.

Proficiency in ratio analysis, like any valuable skill, necessitates patience, practice, and attention to detail. One must tread cautiously, as mistakes in calculation or interpretation may result in incorrect conclusions. It’s a delicate dance between numbers and intuition, where the rhythm of analysis dictates the melody of decision-making.

Join us – let’s break down the complexities of debt-to-total assets ratio analysis and make it easily digestible. By the end, you’ll be equipped to discern whether a company is sailing smoothly. Or sailing into stormy financial seas.

Table of Contents:

  1. Understand Debt-to-Total Assets Ratio Analysis
  2. Why Should We Calculate Total Debt-to-Total Asset Ratio?
  3. How to Calculate Debt-to-Total Assets Ratio?
  4. How to Perform Debt-to-Total Assets Ratio Analysis?
  5. What are the Limitations of the Debt-to-Total Assets Ratio?
  6. Wrap Up

First…

Understand Debt-to-Total Assets Ratio Analysis

Definition: Debt-to-total assets ratio analysis is a financial metric used to assess a company’s leverage and solvency. This ratio provides insight into a firm’s leverage and risk exposure by dividing total debt by total assets.

A high ratio suggests higher dependency on borrowed funds, indicating potential financial vulnerability. Conversely, a lower ratio implies a healthier balance between debt and assets. Investors, creditors, and analysts rely on this metric to assess a company’s financial vulnerability, data-driven decisions, and risk management capabilities.

Understanding this ratio is essential for making informed investment decisions, evaluating creditworthiness, and gauging long-term sustainability.

In essence, debt-to-total assets ratio analysis forms a cornerstone of financial analysis. It offers a glimpse into the stability and resilience of a company’s financial structure.

Why Should We Calculate Total Debt-to-Total Asset Ratio?

The total debt-to-total asset ratio isn’t just a bunch of numbers. It’s a powerful tool for unraveling the mysteries of corporate finance. Here are the reasons why calculating is essential.

  • Financial health assessment: Consider this ratio a stethoscope; it assists in evaluating the finances of a business. By analyzing how a firm’s liabilities stack up against its overall assets, you can obtain an instant view of its financial structure. Should liabilities overshadow assets significantly? Houston, we may have a problem.
  • Risk evaluation: The total debt-to-total asset ratio is your financial crystal ball, foreseeing potential risks that could derail a company’s operations. A high ratio suggests a company is heavily leveraged, dancing precariously at the edge of a financial cliff. Watch out for signs of instability!
  • Comparative analysis: Have you ever been torn between two options? Calculating this ratio allows you to stack up different companies side by side. It reveals which ones are carrying more debt baggage than others.
  • Trend analysis: Trends aren’t just for fashionistas; they matter in finance, too. Tracking changes in the total debt-to-total asset ratio over time unveils a company’s financial evolution. Are they shedding debt like a snake shedding its skin? Or are they piling it on like there’s no tomorrow? Trends speak volumes, my friend.
  • Investment decision-making: Picture yourself as a savvy investor, sifting through mountains of financial data in search of hidden gemstones. This ratio guides you toward businesses with robust financial foundations. After all, no one desires to spend money on a sinking ship.
  • Creditworthiness assessment: Credit rating impacts life significantly. For example, the credit score is the focal point if one is considering applying for a loan. Companies have their version of a credit score, which is captured in their total debt-to-overall asset ratio. The lenders are interested in this ratio since it shows whether a company can repay the extra cash they borrow. Besides, the ratio is used to see whether a company should be given additional cash.

How to Calculate Debt-to-Total Assets Ratio?

How do you crack the code and calculate the debt-to-total assets ratio? Follow these steps.

  1. Obtain financial statements: Find the financial statements of the company in question. These documents hold the secrets you seek.
  2. Identify total debt: Now that you have the financial statements ready, it’s time to uncover the total debt. This includes all types of borrowing, financial obligations, and outstanding invoice payments.
  3. Find total assets: Identify the total assets – the most valuable possessions of the company’s financial empire. This includes all of the company’s assets, including money, investments, properties, and equipment. Consider it like adding up all the treasures within the chest.
  4. Calculate the ratio: Having total debt and assets available now is the moment to engage in financial magic. Divide the total debt by the total assets; voila, you have the debt-to-total assets ratio. Here is the debt-to-total assets ratio formula:

Debt-to-Total Assets Ratio= Total Assets/Total Debt

  1. Interpret the ratio: What does this ratio reveal? A ratio greater than 1 indicates that the debt exceeds assets – a perilous position. Conversely, a ratio less than 1 represents a condition of financial welfare where debt is proportioned to assets. It’s like deciphering the clues in a cryptic message – every number tells a story.

Example:

Suppose a company has total debt of $500,000 and total assets of $1,000,000.

Debt-to-Total Assets Ratio= $500,000/ $1,000,000 =0.5

Hence, the debt-to-assets ratio is 50%, implying that the business has half its assets financed by borrowed money.

How to Perform Debt-to-Total Assets Ratio Analysis?

Data analysis can be like finding a needle in a haystack – challenging but oh-so-rewarding when you strike gold. Picture yourself sorting through financial information to analyze the enigmatic debt-to-total assets ratio. It’s similar to finding one specific needle in a pile of needles.

Here’s where data visualization comes into play. It makes complex numbers and trends leap off the screen and into your understanding.

But let’s face it. Excel, while reliable, can sometimes feel like a clunky old car trying to keep up with a fast-paced race. This is where ChartExpo steps in, offering a sleek, intuitive solution to Excel’s data visualization limitations. Say goodbye to squinting at rows and columns and hello to dynamic, insightful visuals.

Let’s learn how to install ChartExpo in Excel.

  1. Open your Excel application.
  2. Open the worksheet and click the “Insert” menu.
  3. You’ll see the “My Apps” option.
  4. In the Office Add-ins window, click “Store” and search for ChartExpo on my Apps Store.
  5. Click the “Add” button to install ChartExpo in your Excel.

ChartExpo charts are available both in Google Sheets and Microsoft Excel. Please use the following CTAs to install the tool of your choice and create beautiful visualizations with a few clicks in your favorite tool.

Example

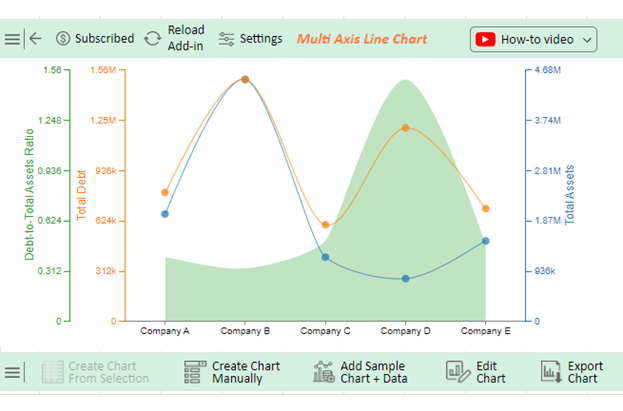
Let’s say you want to analyze the debt-to-total sales ratio data below.

Company Total Debt Total Assets Debt-to-Total Assets Ratio
Company A 800000 2000000 0.4
Company B 1500000 4500000 0.33
Company C 600000 1200000 0.5
Company D 1200000 800000 1.5
Company E 700000 1500000 0.47

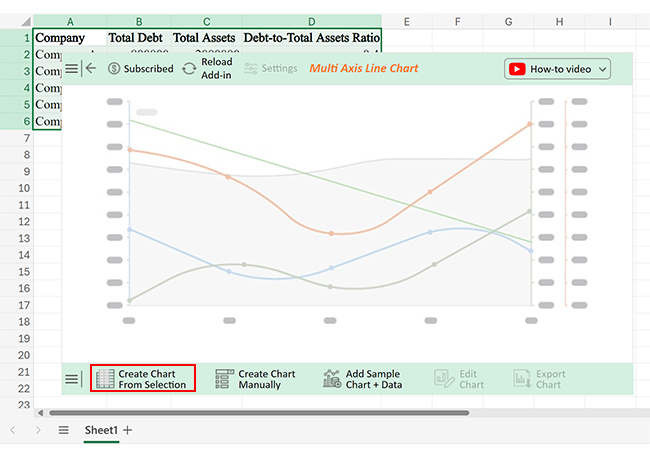
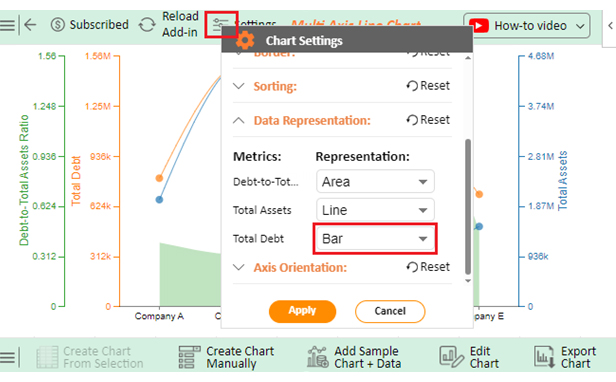
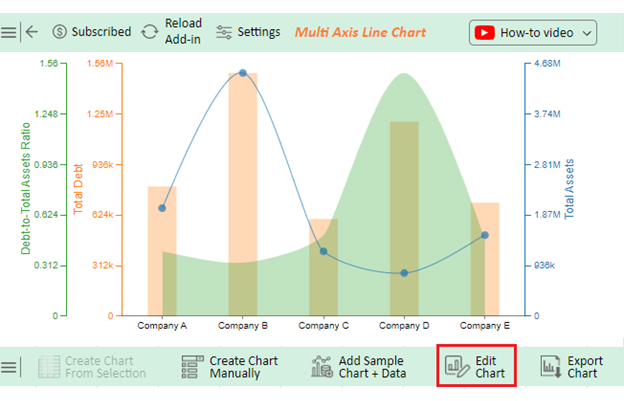
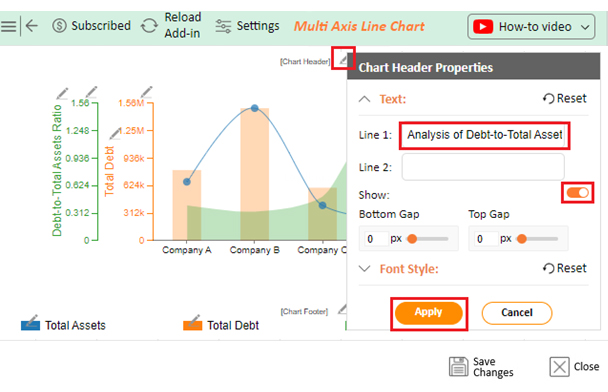
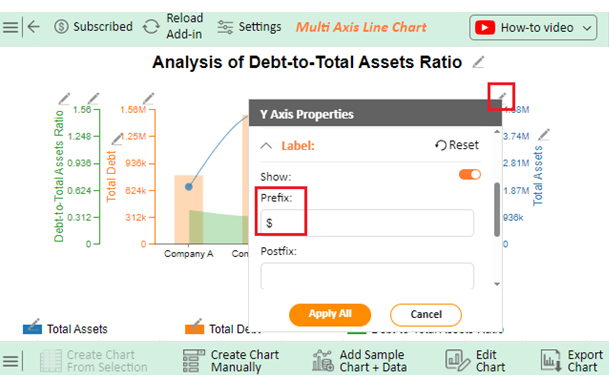
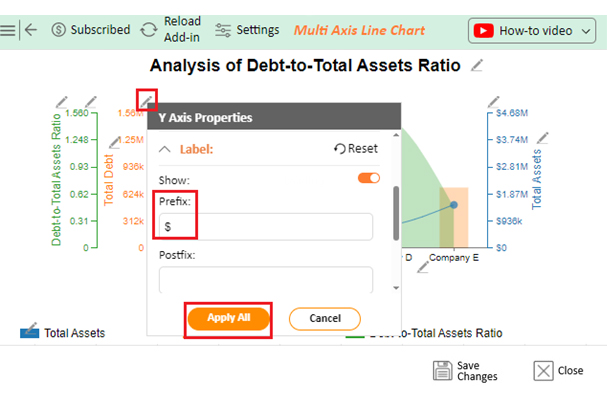
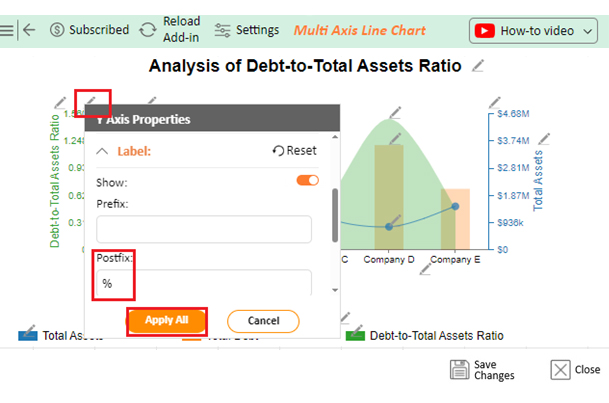
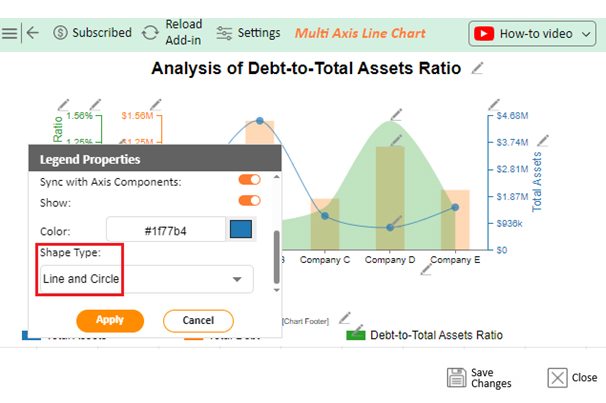
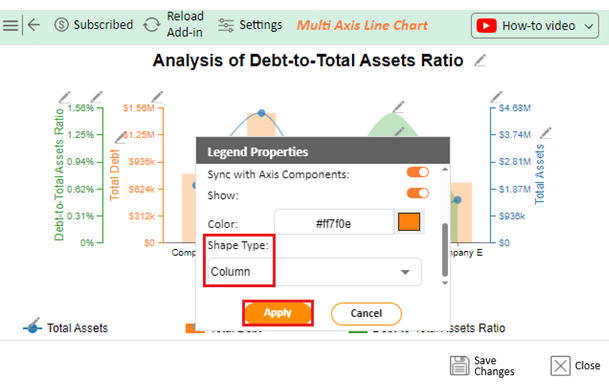
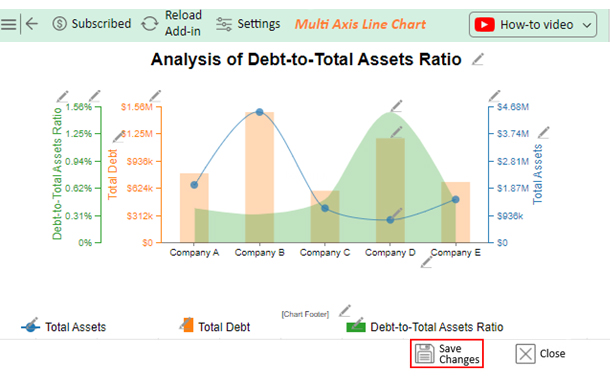
Follow these steps to create a visualization of this data in Excel using ChartExpo and glean insights.

  • To get started with ChartExpo, install ChartExpo in Excel.
  • Now Click on My Apps from the INSERT menu.
insert chartexpo in excel
  • Choose ChartExpo from My Apps, then click Insert.
open chartexpo in excel
  • Once it loads, scroll through the charts list to locate and choose the “Multi-Axis Line Chart”.
search multi axis line chart in excel
  • Click the “Create Chart From Selection” button after selecting the data from the sheet, as shown.
Create Chart From Selection for Doing Debt-to-Total Assets Ratio Analysis
  • ChartExpo will generate the visualization below for you.
Initial Visual for Doing Debt-to-Total Assets Ratio Analysis
  • Click on Settings and change the “Data Representation” of Profit Markup into Bar as follows.
Change Data Representation for Doing Debt-to-Total Assets Ratio Analysis
  • If you want to add anything to the chart, click the Edit Chart button:
Edit Chart for Doing Debt-to-Total Assets Ratio Analysis
  • Click the pencil icon next to the Chart Header to change the title.
  • It will open the properties dialog. Under the Text section, you can add a heading in Line 1 and enable Show.
  • Give the appropriate title of your chart and click the Apply button.
Add Title for Doing Debt-to-Total Assets Ratio Analysis
  • Add a dollar sign with Total Assets values:
Add Prefix for Total Assests for Doing Debt-to-Total Assets Ratio Analysis
  • Add a dollar sign with Total Debt values:
Add Prefix for Total Debt for Doing Debt-to-Total Assets Ratio Analysis
  • Change the precision value of the Debt-to-Total Asset ratio to zero and add the dollar sign:
Change Percision Value for Doing Debt-to-Total Assets Ratio Analysis
  • Change the Legend shape of Total Assets to Line and Circle and click the Apply button.
Change Legends of Total Assests Add Prefix for Doing Debt-to-Total Assets Ratio Analysis
  • Change the Legend shape of Total Debt into a Column and click the Apply button.
Apply Legends of Total Debt Add Prefix for Doing Debt-to-Total Assets Ratio Analysis
  • Click the Save Changes button to persist the changes made to the chart.
Save Changes for Doing Debt-to-Total Assets Ratio Analysis
  • Your final Multi Axis Line Chart will look like the one below.
Final Debt-to-Total Assets Ratio Analysis

Insights

  • Company D boasts the highest Debt-to-Total Assets ratio, standing at 1.5, which signals potential financial risk.
  • Company B exhibits a relatively modest ratio of 0.33, implying a more favorable equilibrium between debt and assets.
  • Company C showcases a ratio of 0.5, suggesting a substantial portion of assets are financed through debt.
  • Companies A and E maintain ratios ranging from 0.4 to 0.47, indicating moderate levels of debt relative to their assets.

What are the Limitations of the Debt-to-Total Assets Ratio?

The debt-to-total assets ratio is a trusty tool in the financial analysis arsenal. But like any tool, it comes with its fair share of limitations.

  • Doesn’t consider debt maturity: This ratio does not take into account when a company’s debts mature. Short-term debts and long-duration ones are like comparing apples and oranges – entirely different beats. Overlooking this difference may skew the conclusions of a company’s financial health.
  • Ignores debt servicing ability: This ratio overlooks a company’s ability to service its debt. That is whether it can pay the interest and principal when due. What use is the knowledge about debts if uncertainty looms about their settlement?
  • Excludes off-balance sheet liabilities: Off-balance sheet liabilities are debts that lurk just beyond the reach of traditional financial statements. Like ghosts haunting a castle, these liabilities can wreak havoc on a company’s finances. Yet, they remain invisible to the debt-to-total assets ratio. Ignoring them is like pretending the ghosts aren’t there.
  • Ignores asset quality: Not all assets are created equal, my friend. Some are as sturdy as a castle wall, while others are as fragile as spun sugar. Yet this ratio treats them all the same, ignoring nuances in asset quality. What good is knowing the total assets if you don’t know their true worth?
  • Not comparable across industries: The debt-to-total assets ratio isn’t always apples to apples when comparing companies across different industries. What works for one may not work for another.
  • Subject to manipulation: This ratio is not immune to such trickery. Companies can play with the numerator or denominator to paint a rosier (or gloomier) picture of their financial health.
  • Static Measure: The ratio, much like freezing a moment in time, only captures the momentary financial condition of the company. It doesn’t capture the dynamic nature of business operations or changes in the economic landscape. What’s true today may not hold tomorrow.

FAQs

What is a good debt-to-asset ratio?

A good debt-to-asset ratio is typically below 0.5. This implies that the debt and the assets of the company are at stable levels. Ratios closer to 0 indicate less financial risk, while higher ratios may signal potential debt burden management challenges.

How do you interpret the debt ratio?

The debt ratio indicates the proportion of a company’s assets financed by debt. A lower ratio suggests less reliance on borrowing, signifying financial stability. Higher ratios may indicate higher risk due to increased debt obligations.

Is it better to have a higher debt-to-asset ratio?

Having a higher debt-to-asset ratio can be risky. While it may signal leverage to fuel growth, it also increases financial vulnerability. Striking a balance is key; excessively high ratios may hinder financial flexibility and increase the risk of default.

Wrap Up

Performing debt-to-total assets ratio analysis is essential for gaining insights into a company’s financial standing. To initiate this analysis, first acquire the financial statements containing information on total debt and total assets. These statements are the foundation for calculating the ratio, which involves dividing total debt by total assets.

Interpreting the resulting ratio is pivotal. Typically, ratios below 0.5 indicate a healthy balance between debt and assets, signaling financial stability. Conversely, higher ratios may raise red flags, suggesting increased financial risk due to heavier reliance on debt financing. It is imperative to delve deeper into the context surrounding the ratio. Consider factors like debt maturity, debt servicing ability, and asset quality.

Despite its utility, the debt-to-total assets ratio has its limitations. Its static nature means it offers only a snapshot of a company’s financial situation at a given point in time. Furthermore, it may overlook off-balance sheet liabilities, which can significantly impact a company’s financial obligations. These limitations highlight the importance of exercising caution. Complement ratio analysis with a comprehensive understanding of the company’s financial landscape.

Engaging in comparative analysis can provide valuable insights. Benchmarking the ratio against industry peers offers a gauge for evaluating a company’s performance relative to its competitors. Additionally, monitoring trends over time enables you to track financial leverage and risk changes. This offers a more comprehensive view of the company’s trajectory.

How much did you enjoy this article?

ExcelAd1
Start Free Trial!
134784

Related articles

next previous
Data Analytics31 min read

Data Analysis Without Nonsense: Fix the Right Problem, Fast

Data analysis can mislead when metrics look right but outcomes fail. Learn how to spot red flags, fix failures, and make better decisions. Read on!

Data Analytics29 min read

Variance Analysis Isn’t a Math Problem, It’s a Trust Problem

Variance analysis helps identify what went wrong, who owns it, and what to do next. Use it to drive decisions, not just reports. Learn more!

Data Analytics10 min read

Supplier Comparison Template: Download It Now

A supplier comparison template streamlines vendor evaluation by comparing cost and quality. Click here to learn its benefits and how to analyze them.

Data Analytics32 min read

Ecommerce Analytics: How to Fix What It Often Gets Wrong

Ecommerce analytics often lead to mixed signals and costly misreads. Fix attribution gaps, align teams, and act on the right data. Get started now!

Data Analytics30 min read

When Sales Funnel Breaks: Failures, Fixes, & Funnel Debt

Is your sales funnel hiding costly gaps? Learn how pipeline stalls, false metrics, and handoff chaos could be draining revenue. Get started now!

ChartExpo logo

Turn Data into Visual
Stories

CHARTEXPO

  • Home
  • Gallery
  • Videos
  • Services
  • Pricing
  • Contact us
  • FAQs
  • Privacy policy
  • Terms of Service
  • Sitemap

TOOLS

  • ChartExpo for Google Sheets
  • ChartExpo for Microsoft Excel
  • Power BI Custom Visuals by ChartExpo
  • Word Cloud

CATEGORIES

  • Bar Charts
  • Circle Graphs
  • Column Charts
  • Combo Charts
  • Comparison Charts
  • Line Graphs
  • PPC Charts
  • Sentiment Analysis Charts
  • Survey Charts

TOP CHARTS

  • Sankey Diagram
  • Likert Scale Chart
  • Comparison Bar Chart
  • Pareto Chart
  • Funnel Chart
  • Gauge Chart
  • Radar Chart
  • Radial Bar Chart
  • Sunburst Chart
  • see more
  • Scatter Plot Chart
  • CSAT Survey Bar Chart
  • CSAT Survey Chart
  • Dot Plot Chart
  • Double Bar Graph
  • Matrix Chart
  • Multi Axis Line Chart
  • Overlapping Bar Chart
  • Control Chart
  • Slope Chart
  • Clustered Bar Chart
  • Clustered Column Chart
  • Box and Whisker Plot
  • Tornado Chart
  • Waterfall Chart
  • Word Cloud
  • see less

RESOURCES

  • Blog
  • Resources
  • YouTube
SIGN UP FOR UPDATES

We wouldn't dream of spamming you or selling your info.

© 2025 ChartExpo, all rights reserved.