Categories
Financial statements analysis entails looking into a business’s financial records. It is essential for decision-making and performance evaluation.


Let’s look at a case study to illustrate how mastering how to analyze financial statements can be helpful.
Assume you’re the CEO of a software company. You want to analyze the company’s financial performance over the past years to help you with strategic planning. You examine the financial statements, including the balance sheet, income statement, and cash flow statement.
Your analysis reveals that profits and revenue have increased over the past three years. Also, the company has decreased its debt load and increased its cash balance.
Your company is flourishing, as the statements show. It has healthy cash reserves as well. Thus, it is in a solid position to undertake new ventures and grow its existing activities.
These insights will help you make sound strategic decisions.
Now, let’s discuss how to analyze financial statements in Excel.
Definition: A financial statement is a detailed report that provides an overview of a company’s financial performance and position. It typically includes three main components: the balance sheet, which shows assets, liabilities, and equity; the income statement, which details revenues and expenses; and the cash flow statement, which tracks cash inflows and outflows.
Overview of Profitability
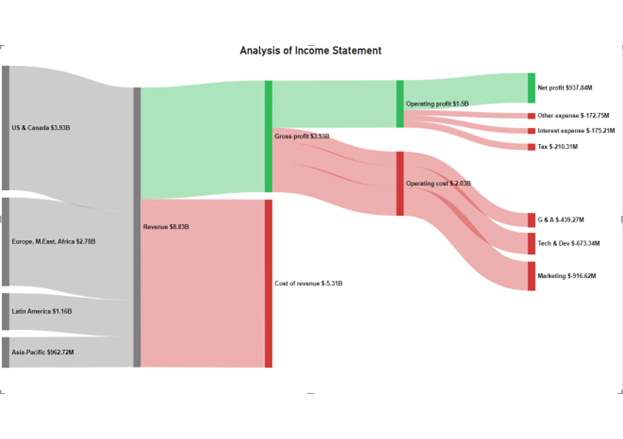
Displays the company’s revenues, expenses, and net profit or loss over a specified period, providing insights into its operational performance.
Snapshot of Financial Position
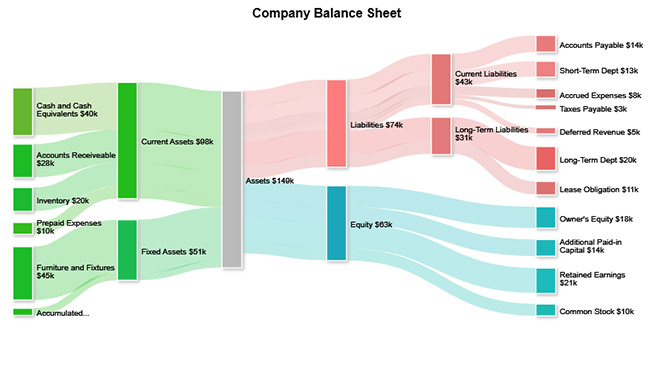
Presents a detailed view of the company’s assets, liabilities, and shareholders’ equity as of a particular date, revealing its financial stability and structure.
Cash Movement Summary
Illustrates the cash inflows and outflows from operating, investing, and financing activities, showing how cash is generated and used during a specific period.
Equity Evolution Report
Details the changes in equity accounts, including retained earnings and capital contributions, over a reporting period, reflecting how equity evolves with business activities.
Definition: Financial statement analysis entails examining a business’s financial information to evaluate its performance. Analyzing the qualitative and quantitative facets of its financial status is part of the process. This aids in assessing the company’s position, prospects, and potential risks.
Financial statement analysis typically involves the following steps:
Performance evaluation is a critical aspect of financial statement analysis. It allows investors, lenders, and other financial stakeholders to assess a company’s financial health. By utilizing tools such as Excel or Power BI for income statements, stakeholders can better evaluate the company’s ability to generate profits and make wise investment decisions.
Financial statement analysis is crucial for well-informed strategic decision-making. It assists decision-makers in making sense of the data, enabling them to evaluate the overall performance and financial health of the business, including key metrics like return on investment capital. This insight helps in making critical decisions to aid the business in boosting earnings and reducing risks.
Financial statement analysis spots opportunities by examining a company’s financial records. Then compare them to industry averages or other companies in the same industry. This comparison assists in identifying areas that are performing better or worse than expected.
Risk management identifies, assesses, and controls various financial risks. Financial statement analysis helps you better understand and mitigate the financial risks the changing economic environment poses.
Financial statement analysis allows you to communicate financial insights to stakeholders. Consequently, it presents investors and other stakeholders with relevant information. This also helps to promote transparency and accountability inside the organization.
Compares financial data across multiple periods to identify trends and growth patterns. It helps track changes in line items like revenue or expenses over time.
Breaks down each item in a financial statement as a percentage of a base figure (e.g., total assets or revenue). This helps assess the relative size and proportion of financial elements within a single period.
Uses key financial ratios (like profitability, liquidity, and solvency ratios) to evaluate a company’s performance, financial health, and operational efficiency.
Involves comparing a company’s financial statements with those of other companies or industry benchmarks to assess competitiveness and identify strengths or weaknesses.
Click Here if you want to know: How to Prepare a Financial Statement
Compares financial data over multiple periods to identify trends and growth patterns.
Expresses each item in a financial statement as a percentage of a base figure (like sales or total assets), making it easier to compare across companies or periods.
Uses key financial ratios (like liquidity, profitability, and solvency ratios) to assess a company’s performance and financial health.
Examines patterns in financial metrics over time to forecast future performance and detect early warning signs.
We’ve covered the fundamentals of financial statement analysis. Now, let’s explore how to analyze financial statements in Excel.
This is where ChartExpo for Excel comes in.
Why ChartExpo?
ChartExpo is a powerful tool for financial statement analysis. It allows both beginners and experienced users to turn data into clear financial charts with an intuitive interface.
You can visualize your financial data by creating insightful charts and graphs. This facilitates the spotting of trends, performance evaluation, and discovery of areas for growth and improvement.
Also, you can easily communicate your findings with stakeholders. You can use its customization options to simplify the gleaning of insights.
Furthermore, you don’t have to worry about the cost when using ChartExpo. It has a free 7-day trial, after which you can subscribe to its pocket-friendly plans.
How to Install ChartExpo in Excel?
ChartExpo charts and graphs are available both in Google Sheets and Microsoft Excel. Please use the following CTA’s to install the tool of your choice and create beautiful visualizations in a few clicks in your favorite tool.
You can use a Sankey diagram in Excel to analyze a financial statement visually, showing how income, expenses, and profits flow across different accounts.
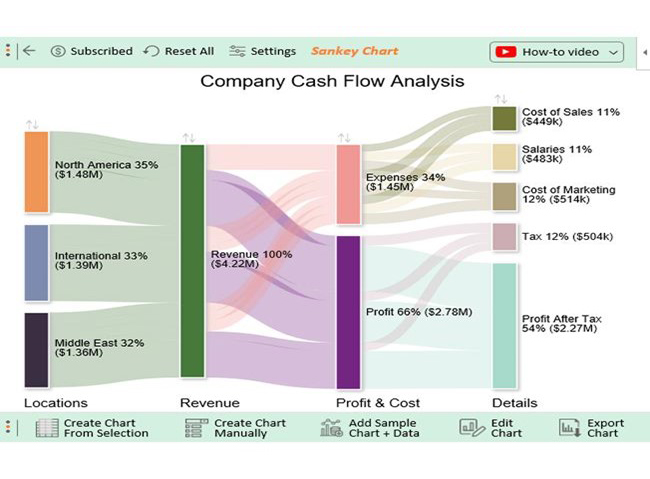
| Locations | Revenue | Profit & Cost | Details | Amount |
| North America | Revenue | Expenses | Cost of Sales | 109310 |
| North America | Revenue | Expenses | Salaries | 28278 |
| North America | Revenue | Expenses | Cost of Marketing | 76772 |
| North America | Revenue | Profit | Tax | 147231 |
| North America | Revenue | Profit | Profit After Tax | 713117 |
| Asia | Revenue | Expenses | Cost of Sales | 122371 |
| Asia | Revenue | Expenses | Salaries | 127010 |
| Asia | Revenue | Expenses | Cost of Marketing | 72919 |
| Asia | Revenue | Profit | Tax | 161953 |
| Asia | Revenue | Profit | Profit After Tax | 692948 |
| Middle East | Revenue | Expenses | Cost of Sales | 153080 |
| Middle East | Revenue | Expenses | Salaries | 93339 |
| Middle East | Revenue | Expenses | Cost of Marketing | 182517 |
| Middle East | Revenue | Profit | Tax | 78101 |
| Middle East | Revenue | Profit | Profit After Tax | 453762 |
| Middle East | Revenue | Expenses | Maintenance |
Follow through as I show you how to analyze the data with the Sankey Chart.


Example:
A company notices its net profit margin dropped from 15% to 10% year over year. Upon analysis, it finds a rise in operating expenses due to increased marketing costs. This insight helps it control future budgets and improve profitability.
Example:
An analyst calculates a retail firm’s current ratio and finds it below 1.0, indicating potential short-term liquidity issues. This triggers a deeper review of accounts payable and inventory turnover.
Example:
A startup shows positive net income but negative cash flow from operations. Analysis reveals that most revenue is tied up in unpaid invoices, highlighting a need for improved receivables management.
Example:
An investor sees that a company’s retained earnings have significantly grown over three years without dividend payouts. This suggests reinvestment into the business, signaling a strong long-term growth strategy.
Empowers stakeholders to make strategic business, investment, and operational decisions based on clear financial insights.
Reveals the company’s profitability, liquidity, and solvency, providing a comprehensive view of its overall financial condition.
Helps monitor trends over time, compare past performance, and identify areas that need financial or operational improvement.
Enhances trust and credibility by providing transparent financial information, supporting funding and partnership opportunities.
Solution:
Standardize accounting methods or adjust financial data for consistency when comparing across companies or time periods.
Solution:
Always compare financials with industry averages and historical performance to gain meaningful insights.
Solution:
Dig deeper into footnotes and use cash flow analysis and financial ratios to detect anomalies or unusual transactions.
Solution:
Adjust for inflation and currency fluctuations where necessary, especially in multinational or long-term comparisons.
Solution:
Combine numerical analysis with qualitative factors such as management quality, market position, and economic conditions for a holistic view.
Ensure your financial data is accurate, complete, and well-structured before beginning any analysis. Use consistent formats and verify data sources.
Apply ratios like current ratio, debt-to-equity, and return on equity to gain quick insights into liquidity, leverage, and profitability.
Analyze data across different timeframes and against industry standards to spot trends, fluctuations, or outliers.
Leverage charts, graphs, and dashboards in Excel or BI tools to transform raw data into intuitive visual insights.
Don’t get lost in every number—prioritize KPIs and metrics aligned with your business goals or financial objectives.
Excel helps in financial statement analysis by allowing users to organize data, perform calculations, create financial models, and visualize trends through charts and pivot tables. It streamlines ratio analysis, comparisons, and forecasting with built-in formulas and functions.
The three main types of financial analysis include;
Here are five ways to analyze your financial statements:
Financial statement analysis lets you get a ‘bird’s-eye view of your business’s financial health and performance. It reveals trends, areas for improvement, and potential risks. Therefore, it is crucial to learn how to analyze financial statements.
Financial statement analysis takes into account the three main financial statements:
These statements show how well a company is managing its financial affairs.
There are three main types of financial statement analysis:
You should be able to deliver a coherent story about your business. You need reliable, simple-to-understand visualizations to craft the best story. The good news is that you can analyze and visualize your company’s financial statements with ChartExpo for Excel.
You can create insightful charts and graphs. These will help you spot trends, evaluate performance, and discover areas for growth and improvement.
How much did you enjoy this article?


Calculate accounts receivable turnover ratio to measure credit collection speed, improve cash flow, and strengthen your financial strategy. Read on!

Change Management KPIs are the key to tracking adoption, performance, and ROI during transitions. Find out which metrics matter. Read on!

Data collection methods and techniques determine the quality of every insight you act on. Explore key approaches for gathering reliable data. Read on!


