• Home
  • Tools dropdown img
    • Spreadsheet Charts

      • ChartExpo for Google Sheets
      • ChartExpo for Microsoft Excel
    • Power BI Charts

      • Power BI Custom Visuals by ChartExpo
    • Word Cloud

  • Charts dropdown img
    • Chart Category

      • Bar Charts
      • Circle Graphs
      • Column Charts
      • Combo Charts
      • Comparison Charts
      • Line Graphs
      • PPC Charts
      • Sentiment Analysis Charts
      • Survey Charts
    • Chart Type

      • Box and Whisker Plot
      • Clustered Bar Chart
      • Clustered Column Chart
      • Comparison Bar Chart
      • Control Chart
      • CSAT Survey Bar Chart
      • CSAT Survey Chart
      • Dot Plot Chart
      • Double Bar Graph
      • Funnel Chart
      • Gauge Chart
      • Likert Scale Chart
      • Matrix Chart
      • Multi Axis Line Chart
      • Overlapping Bar Chart
      • Pareto Chart
      • Radar Chart
      • Radial Bar Chart
      • Sankey Diagram
      • Scatter Plot Chart
      • Slope Chart
      • Sunburst Chart
      • Tornado Chart
      • Waterfall Chart
      • Word Cloud
    • Google Sheets
      Microsoft Excel
  • Services
  • Pricing
  • Contact us
  • Blog
  • Support dropdown img
      • Gallery
      • Videos
      • Contact us
      • FAQs
      • Resources
    • Please feel free to contact us

      atsupport@chartexpo.com

Categories
All Data Visualizations Data Analytics Surveys
Add-ons/
  • Google Sheets
  • Microsoft Excel
  • Power BI
All Data Visualizations Data Analytics Surveys
Add-ons
  • Google Sheets
  • Microsoft Excel
  • Power BI

We use cookies

This website uses cookies to provide better user experience and user's session management.
By continuing visiting this website you consent the use of these cookies.

Ok

ChartExpo Survey


Home > Blog > Data Analytics

How to Prepare Financial Statement for Valuable Insights?

How to prepare financial statements is a critical skill for individuals involved in financial management and accounting.

This process involves the systematic compilation and organization of a company’s financial information to create comprehensive documents that reflect its economic status.

How to Prepare Financial Statement

You see, a well-prepared financial statement is like a treasure map. It points you to where the gold is and where the traps are.

But how to prepare a financial statement?, you ask?

It’s all about juggling numbers and letters with a little bit of patience and the right tools.

It’s not rocket science, but it requires some finesse and know-how.

First, gather all your financial data – from revenue and expenses to assets and liabilities. Then, analyze these numbers with a sharp eye for trends and anomalies.

Now, craft a masterpiece telling the financial story – the balance sheet, income statement, and cash flow statement. Don’t forget to add a dash of transparency and disclosure for that extra flair.

Lastly, review, revise, and refine until your financial statement sparkles like a diamond in the rough.

In this guide, we’ll unravel the mysteries of financial statements. And equip you with the knowledge and skills to tackle them like a seasoned pro. We’ll cover everything from balancing the books to deciphering complex accounting principles.

Table of Contents:

  1. Why is It Important to Prepare Financial Statements?
  2. How to Prepare a Financial Statement?
  3. Common Mistakes to Avoid When Making Financial Statements
  4. Wrap Up

But first…

Why is It Important to Prepare Financial Statements?

How to prepare a financial statement? Is not merely a regulatory requirement but a business’s strategic imperative. It fosters trust and informs decision-making, contributing to a company’s success and sustainability.

How?

  • Transparency

Financial statements provide transparency by clearly and accurately depicting a company’s financial health. This openness fosters trust among stakeholders, including investors, employees, and customers.

  • Decision-Making

Stakeholders, including management, use financial statements to make informed decisions. Whether it’s strategic planning, resource allocation, or investment choices, these statements provide critical data for decision-making.

  • Accountability

Financial statements hold companies accountable for their financial performance. They present a detailed record of transactions and activities, helping your business demonstrate responsibility and integrity.

  • Investor Confidence

Investors rely on financial statements to assess a company’s potential for return on investment. Transparent and well-prepared financial statements enhance investor confidence and attract potential shareholders.

  • Creditworthiness

Lenders and creditors use financial statements to assess the creditworthiness of a company. A solid financial position and positive performance indicators increase the likelihood of obtaining credit or loans.

  • Risk Assessment

Financial statements aid in risk assessment by highlighting areas of financial vulnerability. This enables you to address potential challenges and implement risk mitigation strategies proactively.

  • Performance Evaluation

Companies use financial statements to evaluate performance against internal and external benchmarks, including debt-to-total assets ratio analysis. This assessment guides efforts to improve efficiency, productivity, and financial health.

  • Legal and Regulatory Compliance

Financial statements ensure adherence to accounting standards and regulations, preventing legal complications.

  • Taxation

Tax authorities use financial statements to assess a company’s tax liability. Accurate financial reporting helps you comply with tax regulations and avoid legal issues related to taxation.

  • Benchmarking

Financial statements enable benchmarking against industry standards and competitors. This comparative analysis helps you identify areas for improvement and stay competitive in the market.

How to Prepare a Financial Statement?

How to make financial statements?

Follow these steps;

  1. Collect relevant financial data and ensure accuracy and completeness in compiling records.
  2. Categorize financial transactions into appropriate accounts. Group revenues, expenses, assets, liabilities, and equity to prepare for the statement creation process.
  3. Use the organized data to create the 3-statement financial model, which includes the Income Statement, Balance Sheet, and Cash Flow Statement. Ensure each statement accurately reflects the financial position and performance of the company.
  4. Analyze key financial ratios such as liquidity, profitability, and solvency. Calculate metrics like the current and debt-to-equity ratios to gain insights into the company’s financial health.
  5. Compare current financial statements with previous periods or industry benchmarks. This comparative analysis helps identify trends, assess performance changes, and inform decisions about the company’s financial strategy.

Data visualization is the secret to insightful, effortless analysis of financial statements. It turns boring spreadsheets into appealing, easy-to-understand visuals.

But when it comes to Excel, sometimes the magic stalls. Sure, it’s excellent for numbers. But it can feel like a huddle when you want to visualize those numbers.

That’s where ChartExpo comes in.

ChartExpo can turn your financial data into a captivating story that even your most number-phobic colleagues will understand.

How?

We’ll get to that. First, let’s look at the benefits of using ChartExpo.

Benefits of Using ChartExpo

  • ChartExpo flaunts a visual feast catering to your data’s every whim, simplifying analysis and presentation.
  • ChartExpo’s user-friendly interface transforms data visualization creation into a code-free joyride.
  • Unleash your creativity with ChartExpo’s customizable options and paint your charts with personalized strokes.
  • ChartExpo is the economic maestro, offering a free 7-day trial and a pocket-friendly $10 monthly plan. It’s like having a visual symphony at the cost of a coffee.

How to Install ChartExpo in Excel?

  1. Open your Excel application.
  2. Open the worksheet and click the “Insert” menu.
  3. You’ll see the “My Apps” option.
  4. In the office Add-ins window, click “Store” and search for ChartExpo on my Apps Store.
  5. Click the “Add” button to install ChartExpo in your Excel.

ChartExpo charts are available both in Google Sheets and Microsoft Excel. Please use the following CTA’s to install the tool of your choice and create beautiful visualizations in a few clicks in your favorite tool.

Example

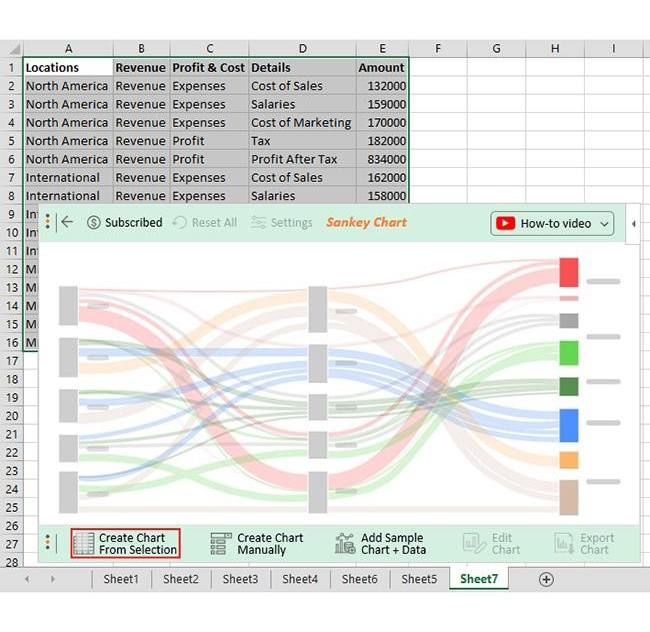
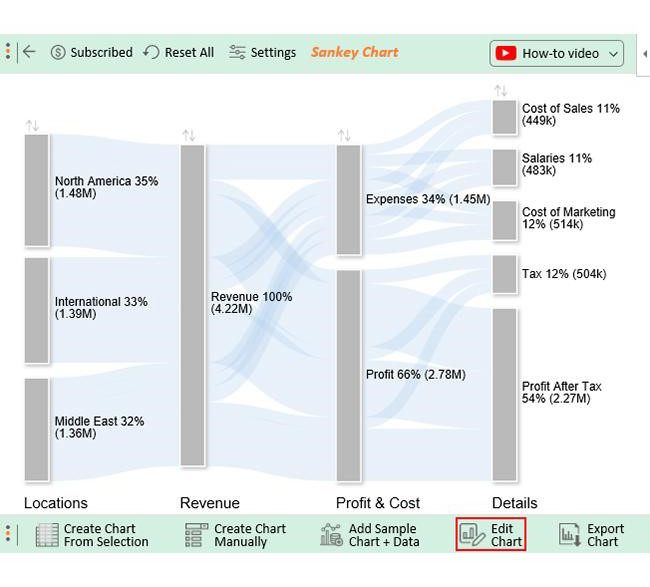
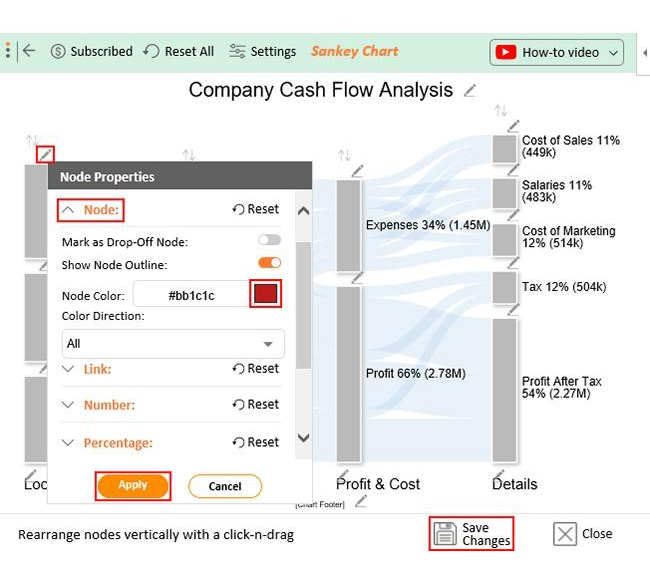
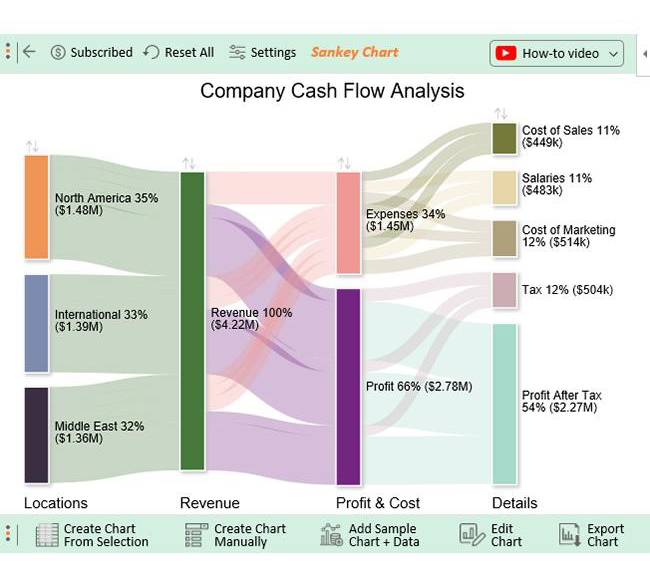
Now, let’s create a cash flow diagram using the sample cash flow data below with ChartExpo.

Locations Revenue Profit & Cost Details Amount
North America Revenue Expenses Cost of Sales 132000
North America Revenue Expenses Salaries 159000
North America Revenue Expenses Cost of Marketing 170000
North America Revenue Profit Tax 182000
North America Revenue Profit Profit After Tax 834000
International Revenue Expenses Cost of Sales 162000
International Revenue Expenses Salaries 158000
International Revenue Expenses Cost of Marketing 145000
International Revenue Profit Tax 171000
International Revenue Profit Profit After Tax 753000
Middle East Revenue Expenses Cost of Sales 155000
Middle East Revenue Expenses Salaries 166000
Middle East Revenue Expenses Cost of Marketing 199000
Middle East Revenue Profit Tax 151000
Middle East Revenue Profit Profit After Tax 685000
  • To get started with ChartExpo, install ChartExpo in Excel.
  • Now Click on My Apps from the INSERT menu.
insert chartexpo in excel
  • Choose ChartExpo from My Apps, then click Insert.
open chartexpo in excel
  • Once it loads, choose the “Sankey Chart” from the charts list.
search sankey chart in excel
  • Click the “Create Chart From Selection” button after selecting the data from the sheet, as shown.
Create Chart From Selection ce473
  • ChartExpo will generate the visualization below for you.
How to Prepare Financial Statement Template
  • If you want to have the chart’s title, click Edit Chart, as shown in the above image.
  • Click the pencil icon next to the Chart Header to change the title.
  • It will open the properties dialog. Under the Text section, you can add a heading in Line 1 and enable Show.
  • Give the appropriate title of your chart and click the Apply button.
Apply Tittle on Chart ce473
  • Let’s add the Prefix (e.g., $ sign) to the chart’s numeric values.
  • Click the highlighted pencil icon. Expand the “Symbols” properties to add the Prefix value (e.g., $ sign).
Apply Prefix on Chart ce473
  • Let’s give colors to the nodes. Click the pencil icon at the top of the nodes and go to “Node“. Select the color and click the “Apply” button to save all changes.
  • Click the “Save Changes” button to persist the changes.
Apply Nodes on Chart ce473
  • Your final cash flow Sankey Chart will appear as below.
Final How to Prepare Financial Statement

Insights

  • In Level 1 (Locations), North America takes the revenue crown with $1.48M, constituting 35%. Middle East trails with the least contribution at $1.36M, making up 32%.
  • At Level 2 (Revenue), the company’s total revenue is $4.22M.
  • At Level 3 (Profit & Cost), out of the $4.22M revenue, $1.45M went into expenses, leaving the company with a profit of $2.78M.
  • Moving further to Level 4 (Details), within the $2.78M profit, Taxes and Profits claimed $504K and $2.27M, respectively.
  • Breaking down expenses into three nodes, Cost of Sales clocked in at $449K, Salaries at $483K, and Cost of Marketing at $514K.

What are the Common Mistakes to Avoid When Making Financial Statements?

How to Prepare a Financial Statement? To ensure accurate and reliable financial statements. Avoiding these common mistakes requires diligence, attention to detail, and a commitment to maintaining financial reporting integrity.

  • Failure to reconcile: Neglecting to reconcile accounts can lead to discrepancies between financial statements and actual financial records. Regular reconciliation ensures accuracy.
  • Data entry errors: Simple yet significant, data entry errors can distort financial figures. Therefore, reviewing data entry for accuracy is crucial to avoid misinformation.
  • Overlooking accruals and deferrals: Ignoring accruals and deferrals can misrepresent financial positions. Proper accounting for these ensures accurate financial reporting.
  • Improper classification: Misclassifying items on financial statements can distort the true financial picture. Therefore, careful classification is essential for meaningful analysis.
  • Ignoring contingent liabilities: Overlooking contingent liabilities can impact financial health. Thus, identifying and disclosing these potential obligations is vital for transparency.
  • Inconsistent accounting policies: Inconsistency in applying accounting policies can lead to confusion. Maintaining uniformity ensures reliable financial reporting.
  • Neglecting footnotes and disclosures: Footnotes and disclosures provide context to financial statements. Neglecting them can leave stakeholders uninformed about crucial details.
  • Inaccurate depreciation and amortization: Incorrectly calculating depreciation and amortization distorts asset values. Precision in these calculations is essential for accurate financial statements.
  • Failure to recognize impairments: Ignoring impairments can overstate asset values. Recognizing impairments ensures accurate financial reporting.
  • Ignoring going concern assumption: Failing to assess a company’s ability to continue operations may lead to misjudgments. Therefore, recognizing the going concern assumption is crucial for accurate financial statements.
  • Inadequate documentation: Insufficient documentation hampers transparency. Thorough documentation supports the integrity of financial statements.
  • Not reconciling bank statements: Discrepancies between bank statements and financial records can arise if not reconciled regularly. Regular reconciliation ensures accuracy.
  • Misjudging revenue recognition: Misjudging when to recognize revenue can distort financial performance. Therefore, adhering to appropriate revenue recognition criteria is vital.
  • Omission of related parties transactions: Overlooking transactions with related parties can lead to conflicts of interest. Disclosing such transactions ensures transparency.
  • Lack of internal controls: Inadequate internal controls can lead to errors and fraud. Implementing robust controls ensures the integrity of financial statements.
  • Ignoring tax implications: Neglecting tax implications can lead to financial surprises. Therefore, considering tax consequences is crucial for accurate financial reporting.
  • Relying solely on accounting software: Over-reliance on accounting software without manual oversight can lead to errors. Regular manual checks complement software accuracy.

FAQs

What is a financial statement?

A financial statement is a comprehensive report summarizing a company’s financial transactions and status. It comprises the income statement, balance sheet, and cash flow statement. Thus, it provides a snapshot of the company’s financial health, aiding in informed decision-making and analysis.

What are the steps to prepare financial statements?

How to prepare financial statements;

  1. Gather relevant data.
  2. Organize transactions.
  3. Create the income statement, balance sheet, and cash flow statement.
  4. Perform ratio analysis.
  5. Conduct comparative assessments.

These steps ensure a comprehensive understanding of a company’s financial landscape.

What is an example of a financial statement?

Here are some examples of financial statements;

  • An income statement displaying revenues and expenses.
  • A balance sheet presenting assets, liabilities, and equity.
  • A cash flow statement delineates cash inflows and outflows.

Wrap Up

How to prepare financial statements is a multifaceted process that forms the bedrock of effective financial management. Preparing a financial statement is a meticulous journey that demands attention to detail and financial finesse.

Firstly, gathering accurate data is the cornerstone – ensuring all transactions, income, and expenses are accounted for. Organizing this data into the three components of financial statements sets the stage for a clear financial narrative. The balance sheet, income statement, and cash flow statement act as the script, narrating the financial narrative.

Secondly, precision in calculations is paramount. The figures’ accuracy directly impacts the financial statement’s reliability, influencing stakeholders’ decisions and perceptions. Additionally, adherence to accounting standards and regulations enhances the statement’s credibility.

Furthermore, incorporating data visualization tools elevates the financial statement’s impact. Charts and graphs not only make complex data more digestible. They also add a layer of visual appeal, aiding in effective communication. ChartExpo, the maestro of data visualization, turns financial statements into a visual, insightful masterpiece.

Conclusively, it’s not just about financial statements; it’s about orchestrating a symphony that resonates in the financial cosmos. With ChartExpo, you’ll captivate audiences and empower decision-makers with insights that transcend the ordinary.

How much did you enjoy this article?

PBIAd1
Start Free Trial!
131286

Related articles

next previous
Data Analytics12 min read

Business Intelligence in Healthcare Industry: A Visual Approach

Business Intelligence in the healthcare industry improves patient care and streamlines operations. Learn how BI works and benefits healthcare providers.

Data Analytics10 min read

Analytics in Telecom Industry for Better Insights

Analytics in the telecom industry optimizes networks, enhances customer experience, and detect fraud. Learn its key benefits, challenges, and use cases.

Data Analytics7 min read

Financial Forecasting for Startups: A Complete Guide

This guide dives deep into financial forecasting for startups. You'll also discover elements of a financial projection for a startup, and tips for creating one.

Data Analytics32 min read

Data Reporting: Making Your Reports Irresistible

Data reporting turns numbers into insights that guide decisions. Learn how to simplify complex data and make confident choices. Read on for key strategies!

Data Analytics10 min read

Employee Performance KPIs: Insights That Drive Action

Employee performance KPIs track productivity and success. Learn the key metrics, measurement methods, and analysis techniques to boost performance.

ChartExpo logo

Turn Data into Visual
Stories

CHARTEXPO

  • Home
  • Gallery
  • Videos
  • Services
  • Pricing
  • Contact us
  • FAQs
  • Privacy policy
  • Terms of Service
  • Sitemap

TOOLS

  • ChartExpo for Google Sheets
  • ChartExpo for Microsoft Excel
  • Power BI Custom Visuals by ChartExpo
  • Word Cloud

CATEGORIES

  • Bar Charts
  • Circle Graphs
  • Column Charts
  • Combo Charts
  • Comparison Charts
  • Line Graphs
  • PPC Charts
  • Sentiment Analysis Charts
  • Survey Charts

TOP CHARTS

  • Sankey Diagram
  • Likert Scale Chart
  • Comparison Bar Chart
  • Pareto Chart
  • Funnel Chart
  • Gauge Chart
  • Radar Chart
  • Radial Bar Chart
  • Sunburst Chart
  • see more
  • Scatter Plot Chart
  • CSAT Survey Bar Chart
  • CSAT Survey Chart
  • Dot Plot Chart
  • Double Bar Graph
  • Matrix Chart
  • Multi Axis Line Chart
  • Overlapping Bar Chart
  • Control Chart
  • Slope Chart
  • Clustered Bar Chart
  • Clustered Column Chart
  • Box and Whisker Plot
  • Tornado Chart
  • Waterfall Chart
  • Word Cloud
  • see less

RESOURCES

  • Blog
  • Resources
  • YouTube
SIGN UP FOR UPDATES

We wouldn't dream of spamming you or selling your info.

© 2025 ChartExpo, all rights reserved.