• Home
  • Tools dropdown img
    • Spreadsheet Charts

      • ChartExpo for Google Sheets
      • ChartExpo for Microsoft Excel
    • Power BI Charts

      • Power BI Custom Visuals by ChartExpo
    • Word Cloud

  • Charts dropdown img
    • Chart Category

      • Bar Charts
      • Circle Graphs
      • Column Charts
      • Combo Charts
      • Comparison Charts
      • Line Graphs
      • PPC Charts
      • Sentiment Analysis Charts
      • Survey Charts
    • Chart Type

      • Box and Whisker Plot
      • Clustered Bar Chart
      • Clustered Column Chart
      • Comparison Bar Chart
      • Control Chart
      • CSAT Survey Bar Chart
      • CSAT Survey Chart
      • Dot Plot Chart
      • Double Bar Graph
      • Funnel Chart
      • Gauge Chart
      • Likert Scale Chart
      • Matrix Chart
      • Multi Axis Line Chart
      • Overlapping Bar Chart
      • Pareto Chart
      • Radar Chart
      • Radial Bar Chart
      • Sankey Diagram
      • Scatter Plot Chart
      • Slope Chart
      • Sunburst Chart
      • Tornado Chart
      • Waterfall Chart
      • Word Cloud
    • Google Sheets
      Microsoft Excel
  • Services
  • Pricing
  • Contact us
  • Blog
  • Support dropdown img
      • Gallery
      • Videos
      • Contact us
      • FAQs
      • Resources
    • Please feel free to contact us

      atsupport@chartexpo.com

Categories
All Data Visualizations Data Analytics Surveys
Add-ons/
  • Google Sheets
  • Microsoft Excel
  • Power BI
All Data Visualizations Data Analytics Surveys
Add-ons
  • Google Sheets
  • Microsoft Excel
  • Power BI

We use cookies

This website uses cookies to provide better user experience and user's session management.
By continuing visiting this website you consent the use of these cookies.

Ok

ChartExpo Survey


Home > Blog > Data Analytics

What is Solvency Ratio: Key Insights

What is solvency ratio, and why does it matter?

What is Solvency Ratio

It goes like this: Picture a high-flying company with soaring revenues. It starts missing payments because it’s running out of cash. Conversely, another company keeps a good financial state and is ready to tide over business stagnation, notwithstanding moderate profits. This contrast illustrates the importance of the solvency ratio as an essential measure of a company’s financial health.

The solvency ratio is a key tool for investors and creditors. It represents a company’s long-term debt-paying ability. You calculate it by dividing a firm’s net income by its liabilities. A positive solvency ratio is generally good, but as it trends lower, the company may lose its financial footing.

The bottom line: Nearly 82% of businesses collapse due to cash flow problems. The solvency ratio predicts default risk and can alert you before a breakdown in financial performance.

In today’s competitive business environment, it is necessary to understand the solvency ratio. As global insolvency rates increase, companies must actively oversee their financial well-being.

This post discusses the details of the solvency ratio. We will examine actual instances and valuable perspectives on how this measurement is calculated and analyzed.

Come and join us. Let’s explore the complexities of this metric and what it means for companies and investors.

Table of Contents:

  1. What is the Solvency Ratio?
  2. What Does the Solvency Ratio Mean?
  3. What Does a Solvency Ratio Measure?
  4. Why is it Important to Measure Solvency?
  5. How Many Types of Solvency Ratio?
  6. What is the Difference between Solvency Ratio vs. Liquidity Ratio?
  7. How to Calculate Solvency Ratios?
  8. How to Examine Solvency Ratio?
  9. What are the Limitations of Solvency Ratios?
  10. Wrap Up

First…

What is the Solvency Ratio?

Definition: A solvency ratio measures a company’s ability to meet its long-term debts and financial obligations. It assesses whether a company has enough assets to cover its liabilities. High solvency ratios indicate strong financial health. They show that the company can sustain operations in the long term.

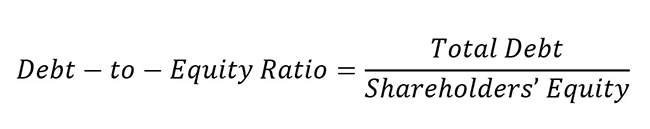
Common solvency ratios include the debt-to-equity ratio and the interest coverage ratio:

  • The debt-to-equity ratio compares total liabilities to shareholders’ equity. A lower ratio suggests a more financially stable company.
  • The interest coverage ratio measures the ability to pay interest on outstanding debt. Higher values indicate better financial stability.

Solvency ratios are crucial for investors and creditors. They provide insights into a company’s financial structure and risk levels. Companies with strong solvency ratios are less likely to face financial distress. They can secure financing more easily.

In summary, solvency ratios are key indicators of a company’s long-term financial viability.

What Does the Solvency Ratio Mean?

Definition: The solvency ratio is a financial metric that evaluates a company’s ability to meet long-term debt and financial obligations. It indicates whether a company possesses sufficient assets to cover its liabilities over the long term. This ratio is crucial for assessing a company’s financial stability and long-term viability.

High solvency ratios suggest that the company is financially healthy and capable of sustaining operations and growth.

In contrast, low solvency ratios may indicate potential financial distress and a higher risk of insolvency.

Solvency ratios are vital for investors, creditors, and analysts when making decisions about lending and investing. Or when evaluating a company’s financial health.

What Does a Solvency Ratio Measure?

A solvency ratio assesses a company’s capacity to fulfill its long-term debt commitments. It shows how much of a company’s assets are funded by equity compared to debt. This gives an understanding of its financial strength and capacity to handle financial obstacles. A stronger solvency ratio indicates a more stable financial stance. It means more assets than liabilities – a lower chance of default.

Why is it Important to Measure Solvency?

Measuring solvency is essential for understanding a company’s financial health and stability. Solvency ratios provide valuable insights into whether a company can meet its long-term obligations and remain operational over time. Here are key reasons why it is important to measure solvency:

  • Financial health assessment: Solvency ratios tell you whether the company is in the correct financial condition. How? They give an idea of the company’s ability to pay for its long-term liabilities with its total assets.
  • Risk evaluation: By analyzing solvency ratios, stakeholders can assess the risk of financial distress or bankruptcy. Companies with low solvency ratios are considered higher risk. This can impact decisions related to lending, investing, or business partnerships.
  • Strategic planning and decision-making: Providing a solvency analysis allows you to plan and make informed decisions. You can recognize financial strengths and weaknesses and drive investment decisions that lead to growth, restructuring plans, etc.
  • Compliance with regulations: Some sectors and regulatory entities mandate that companies uphold certain levels of financial stability. Consistently monitoring solvency ensures adherence to these guidelines, preventing potential legal and financial consequences.
  • Investor confidence: Investors use solvency ratios to assess a company’s long-term sustainability. High solvency ratios increase investor trust, which helps companies attract and retain more investment effortlessly.
  • Creditor protection: Creditors use solvency ratios to evaluate the probability of loan reimbursement. Businesses with strong financial positions are seen as less risky, leading to better loan terms and conditions.

How Many Types of Solvency Ratio?

Several types of solvency ratios offer a different perspective on a company’s financial health. Key types include:

  1. Interest Coverage Ratio

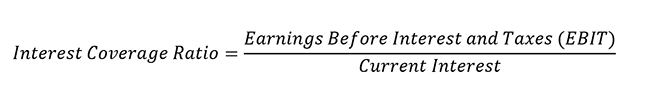
This ratio evaluates how well a company can cover the interest payments on its current debt. The calculation divides earnings before interest and taxes (EBIT) by the interest expense. A greater interest coverage ratio shows the company can readily fulfill its interest payments, indicating strong financial health.

  1. Debt-to-Asset Ratio

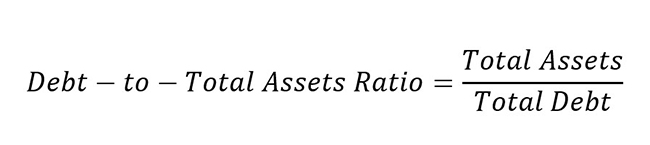
This ratio measures the company’s total debt to its total assets, and it plays a crucial role in debt-to-total assets ratio analysis. The calculation involves total liabilities being divided by total assets. A lower debt-to-asset ratio indicates that the company depends less on debt to fund its operations, which suggests improved financial stability.

  1. Equity Ratio

The equity ratio evaluates the percentage of a company’s overall assets funded by shareholders’ equity. Shareholders’ equity is divided by total assets to calculate it. A higher equity ratio reflects a greater proportion of equity funding in a company’s assets, decreasing dependence on borrowing.

  1. Debt-to-Equity Ratio

This proportion measures a company’s total liabilities to its shareholders’ equity. Total debt is divided by shareholders’ equity to calculate it. A low debt-to-equity ratio indicates a more balanced mix of debt and equity, resulting in diminished financial risk.

What is the Difference between Solvency Ratio vs. Liquidity Ratio?

Solvency and liquidity ratios are key financial metrics used to evaluate a company’s financial stability. Below is a table summarizing the key differences between the solvency ratio vs. liquidity ratio.

Aspect Solvency Ratio Liquidity Ratio
Definition Measures a company’s ability to meet long-term obligations. Measures a company’s ability to meet short-term obligations.
Time Horizon Long-term financial health and sustainability. Short-term financial stability and operational efficiency.
Key Ratios
  • Debt-to-Equity Ratio
  • Interest Coverage Ratio
  • Debt-to-Asset Ratio
  • Equity Ratio
  • Current Ratio
  • Quick Ratio
  • Cash Ratio
Focus Overall financial stability and leverage. Immediate ability to pay off short-term debts.
Typical Users
  • Long-term investors
  • Creditors
  • Financial analysts
  • Short-term creditors
  • Suppliers
  • Operational managers
Financial Health Indicator Indicates the ability to sustain operations and grow over the long term. Indicates the capacity to handle immediate cash flow needs.

How to Calculate Solvency Ratios?

Solvency ratios are key indicators of a company’s financial stability and ability to meet long-term obligations. Calculating these ratios involves a few straightforward steps. Here’s a guide on how to calculate solvency ratios effectively.

  1. Determine the metric you’re measuring: Decide which solvency ratio you need to calculate. Common solvency ratios include the Debt-to-Equity Ratio, Interest Coverage Ratio, Debt-to-Asset Ratio, and Equity Ratio. Each ratio provides different insights into the company’s financial health.
  2. Gather necessary financial data: Collect the relevant financial information from the company’s balance sheet and income statement. Key data points include:
    • Total debt
    • Total assets
    • Shareholders’ equity
    • Earnings before interest and taxes (EBIT)
    • Interest expenses
  1. Apply the appropriate formula: Use the specific solvency ratio formula you are calculating:
    • Debt-to-Equity Ratio:
Debt-to-Equity Ratio Formula After Learning What is Solvency Ratio
    • Interest Coverage Ratio:
Interest Coverage Ratio Formula After Learning What is Solvency Ratio
    • Debt-to-Asset Ratio:
Debt-to-Asset Ratio Formula After Learning What is Solvency Ratio
    • Equity Ratio:
Equtiy Ratio Formula After Learning What is Solvency Ratio

How to Examine Solvency Ratio?

Data analysis can feel like untangling headphone wires – confusing and prone to knots. But don’t worry; data visualization acts as the decoder ring, revealing patterns and anomalies hidden within the numbers.

Yet, relying solely on Excel for this visual journey is akin to using a flip phone in a smartphone era. It just doesn’t measure up.

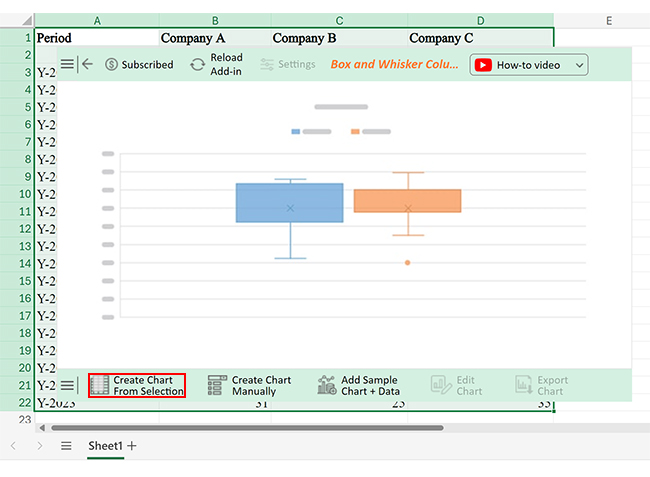
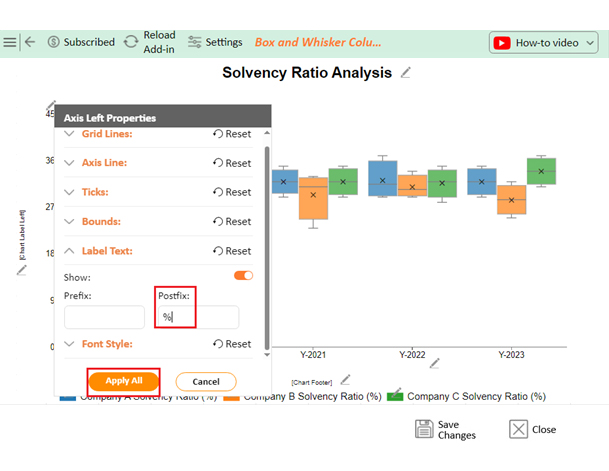
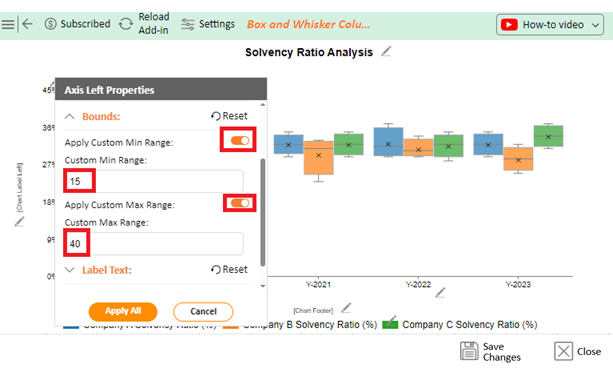
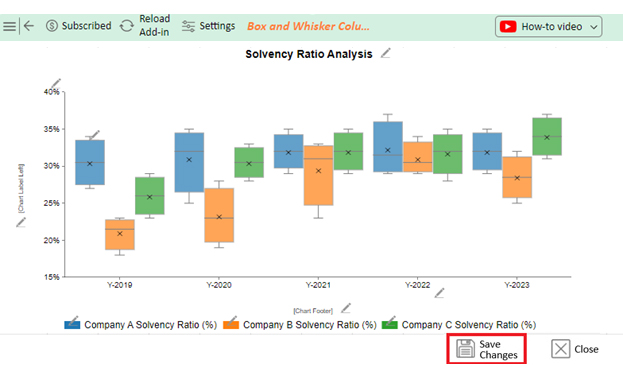
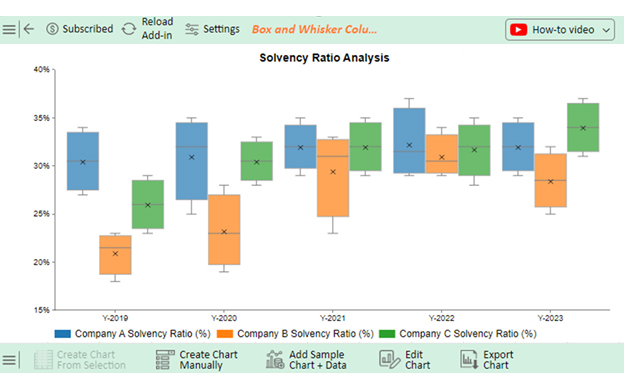
This is where ChartExpo comes in handy. Its data visualization options illuminate the path to more precise financial insights like a Box and Whisker chart.

Let’s learn how to install ChartExpo in Excel.

  1. Open your Excel application.
  2. Open the worksheet and click the “Insert” menu.
  3. You’ll see the “My Apps” option.
  4. In the Office Add-ins window, click “Store” and search for ChartExpo on my Apps Store.
  5. Click the “Add” button to install ChartExpo in your Excel.

ChartExpo charts are available both in Google Sheets and Microsoft Excel. Please use the following CTAs to install the tool of your choice and create beautiful visualizations with a few clicks in your favorite tool.

Example

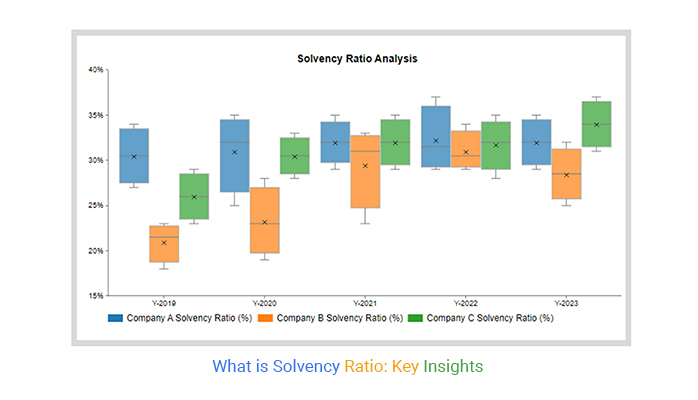
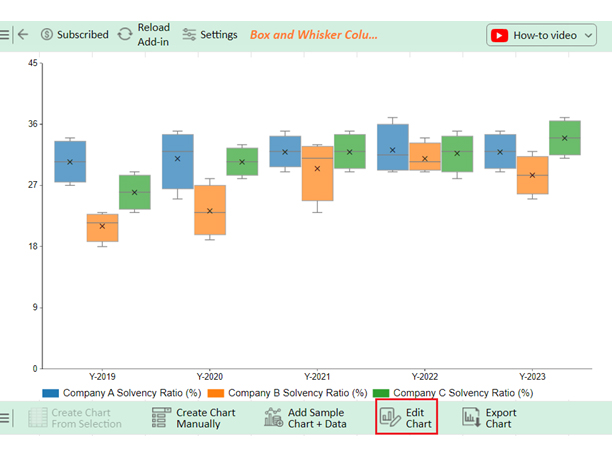
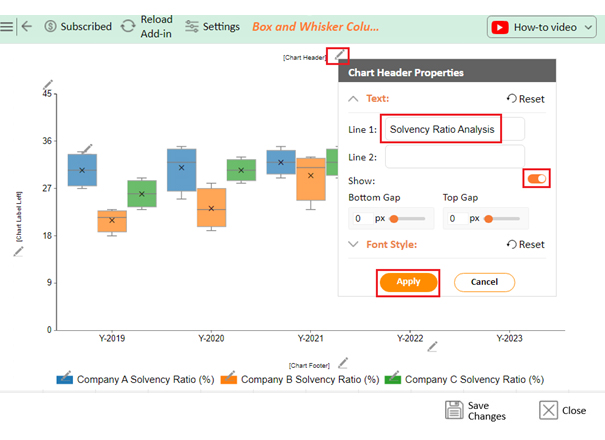
Let’s analyze the solvency ratio sample data below using ChartExpo.

Period Company A

Solvency Ratio (%)

Company B

Solvency Ratio (%)

Company C

Solvency Ratio (%)

Y-2019 34 18 23
Y-2019 32 23 25
Y-2019 29 21 27
Y-2019 27 22 29
Y-2020 33 19 28
Y-2020 35 22 30
Y-2020 25 24 31
Y-2020 31 28 33
Y-2021 32 23 31
Y-2021 29 30 29
Y-2021 32 32 35
Y-2021 35 33 33
Y-2022 30 29 35
Y-2022 33 34 32
Y-2022 37 31 28
Y-2022 29 30 32
Y-2023 29 32 37
Y-2023 33 29 33
Y-2023 35 28 31
Y-2023 31 25 35
  • To get started with ChartExpo, install ChartExpo in Excel.
  • Now Click on My Apps from the INSERT menu.
insert chartexpo in excel
  • Choose ChartExpo from My Apps, then click Insert.
open chartexpo in excel
  • Once it loads, scroll through the charts list to locate and choose the “Box and Whisker Column Chart”.
search box and whisker bar chart in excel
  • Click the “Create Chart From Selection” button after selecting the data from the sheet, as shown.
Click Create Chart From Selection After Learning What is Solvency Ratio
  • ChartExpo will generate the visualization below for you.
Edit Chart After Learning What is Solvency Ratio
  • If you want to add anything to the chart, click the Edit Chart button:
  • Click the pencil icon next to the Chart Header to change the title.
  • It will open the properties dialog. Under the Text section, you can add a heading in Line 1 and enable Show.
  • Give the appropriate title of your chart and click the Apply button.
Chart Chart Header After Learning What is Solvency Ratio
  • Add percentage sign with values as follows:
Add Postfix After Learning What is Solvency Ratio
  • Apply the property Bounds lower and upper limit for x-axis labels and adjust the scale.
Apply Upper and Lower Limit After Learning What is Solvency Ratio
  • Click the Save Changes button to persist the changes made to the chart.
Save Changes After Learning What is Solvency Ratio
  • Your final Box and Whisker Column Chart will look like the one below.
Final What is Solvency Ratio

Insights

  • The solvency ratios of Companies A, B, and C varied throughout the years.
  • Company A generally demonstrated greater solvency levels compared to B and C.
  • Although all three companies saw fluctuations, a thorough examination is required to identify the factors impacting their financial stability and performance trends in the long run.

What are the Limitations of Solvency Ratios?

Like any financial metric, solvency ratios have limitations that can affect reliability and interpretation. Understanding these limitations is crucial for a comprehensive financial analysis. Here are the imitations of solvency ratios.

  • Historical data: Solvency ratios are based on historical financial data. They reflect past performance and may not accurately predict future financial stability.
  • Accounting policies: How assets are valued, depreciation techniques, and inventory accounting may differ. This makes it harder to compare ratios between companies.
  • Non-financial aspects: Solvency ratios do not account for management quality, market situation, competition, and regulatory changes. These components can have a significant influence on a business’s financial situation.
  • Asset valuation: The value of assets indicated on the balance sheet may not necessarily correspond to their current market price. Assets’ cash flows are usually mispriced. This can affect solvency ratios and mislead us about how close we are to a systemic crisis.
  • Debt structure: Solvency ratios do not differentiate between types of debt. Both immediate and long-term debts are treated similarly, even though one is more detrimental. The combination of secured and unsecured debt is also not taken into consideration.
  • Economic cycles: Economic downturns and upturns can impact solvency ratios. In times of economic decline, the value of assets and profits may decrease, negatively affecting solvency ratios. Conversely, ratios could improve during economic growth, possibly giving a false sense of financial well-being.
  • Liquidity ignored: Solvency ratios prioritize long-term financial well-being while overlooking short-term liquidity. A company could possess robust solvency ratios but encounter liquidity problems that could put its immediate activities at risk.
  • Static view: Solvency ratios provide a snapshot of financial health at a specific point in time. They do not capture changes over time or trends in a company’s financial performance. These nuances can be crucial for understanding long-term viability.

FAQs

What is a good solvency percentage?

A good solvency percentage typically ranges between 20% and 25%. This indicates a company has a healthy balance between debt and equity. It suggests strong financial stability and the ability to meet long-term obligations.

What is the most common solvency ratio?

The most common solvency ratio is the debt-to-equity ratio. It compares a company’s total debt to shareholders’ equity. This ratio helps assess financial leverage and risk by indicating how much debt is used to finance operations.

What is the highest solvency ratio?

The highest solvency ratio is often considered the interest coverage ratio. It measures how easily a company can pay interest on its debt. A higher ratio indicates better financial health, showing the company can comfortably cover its interest expenses.

Wrap Up

The solvency ratio is a crucial metric that measures a company’s ability to meet long-term obligations. It reveals financial stability and overall health. Comparing total debt to equity or assets helps see the company’s reliance on debt and capacity to handle financial challenges.

A high solvency ratio shows a solid financial position, with enough assets to cover long-term liabilities. This reduces the risk of financial distress, boosting confidence among investors and creditors. It makes the company more attractive for investment and loans.

A low solvency ratio raises concerns about the company’s financial health and ability to meet obligations. It suggests higher risk and potential trouble in paying debts or sustaining operations. Such companies may struggle to secure financing or attract investment.

Interpreting solvency ratios requires considering industry norms, economic conditions, and company specifics. A “good” solvency ratio varies across industries and over time. Regular monitoring and analysis are essential for understanding a company’s financial health and identifying areas for improvement.

Overall, the solvency ratio is vital for financial analysis and decision-making. It helps stakeholders assess long-term viability, manage risk, and make informed investment or lending choices.

How much did you enjoy this article?

PBIAd1
Start Free Trial!
136157

Related articles

next previous
Data Analytics29 min read

Data Analytics: Metrics, Mayhem, and Misunderstandings

Data analytics helps teams align strategy, spot failures, and act fast, but only if insights drive action. Ready to make it count? Get started now!

Data Analytics31 min read

Data Analysis Without Nonsense: Fix the Right Problem, Fast

Data analysis can mislead when metrics look right but outcomes fail. Learn how to spot red flags, fix failures, and make better decisions. Read on!

Data Analytics29 min read

Variance Analysis Isn’t a Math Problem, It’s a Trust Problem

Variance analysis helps identify what went wrong, who owns it, and what to do next. Use it to drive decisions, not just reports. Learn more!

Data Analytics10 min read

Supplier Comparison Template: Download It Now

A supplier comparison template streamlines vendor evaluation by comparing cost and quality. Click here to learn its benefits and how to analyze them.

Data Analytics32 min read

Ecommerce Analytics: How to Fix What It Often Gets Wrong

Ecommerce analytics often lead to mixed signals and costly misreads. Fix attribution gaps, align teams, and act on the right data. Get started now!

ChartExpo logo

Turn Data into Visual
Stories

CHARTEXPO

  • Home
  • Gallery
  • Videos
  • Services
  • Pricing
  • Contact us
  • FAQs
  • Privacy policy
  • Terms of Service
  • Sitemap

TOOLS

  • ChartExpo for Google Sheets
  • ChartExpo for Microsoft Excel
  • Power BI Custom Visuals by ChartExpo
  • Word Cloud

CATEGORIES

  • Bar Charts
  • Circle Graphs
  • Column Charts
  • Combo Charts
  • Comparison Charts
  • Line Graphs
  • PPC Charts
  • Sentiment Analysis Charts
  • Survey Charts

TOP CHARTS

  • Sankey Diagram
  • Likert Scale Chart
  • Comparison Bar Chart
  • Pareto Chart
  • Funnel Chart
  • Gauge Chart
  • Radar Chart
  • Radial Bar Chart
  • Sunburst Chart
  • see more
  • Scatter Plot Chart
  • CSAT Survey Bar Chart
  • CSAT Survey Chart
  • Dot Plot Chart
  • Double Bar Graph
  • Matrix Chart
  • Multi Axis Line Chart
  • Overlapping Bar Chart
  • Control Chart
  • Slope Chart
  • Clustered Bar Chart
  • Clustered Column Chart
  • Box and Whisker Plot
  • Tornado Chart
  • Waterfall Chart
  • Word Cloud
  • see less

RESOURCES

  • Blog
  • Resources
  • YouTube
SIGN UP FOR UPDATES

We wouldn't dream of spamming you or selling your info.

© 2025 ChartExpo, all rights reserved.