• Home
  • Tools dropdown img
    • Spreadsheet Charts

      • ChartExpo for Google Sheets
      • ChartExpo for Microsoft Excel
    • Power BI Charts

      • Power BI Custom Visuals by ChartExpo
    • Word Cloud

  • Charts dropdown img
    • Chart Category

      • Bar Charts
      • Circle Graphs
      • Column Charts
      • Combo Charts
      • Comparison Charts
      • Line Graphs
      • PPC Charts
      • Sentiment Analysis Charts
      • Survey Charts
    • Chart Type

      • Box and Whisker Plot
      • Clustered Bar Chart
      • Clustered Column Chart
      • Comparison Bar Chart
      • Control Chart
      • CSAT Survey Bar Chart
      • CSAT Survey Chart
      • Dot Plot Chart
      • Double Bar Graph
      • Funnel Chart
      • Gauge Chart
      • Likert Scale Chart
      • Matrix Chart
      • Multi Axis Line Chart
      • Overlapping Bar Chart
      • Pareto Chart
      • Radar Chart
      • Radial Bar Chart
      • Sankey Diagram
      • Scatter Plot Chart
      • Slope Chart
      • Sunburst Chart
      • Tornado Chart
      • Waterfall Chart
      • Word Cloud
    • Google Sheets
      Microsoft Excel
  • Services
  • Pricing
  • Contact us
  • Blog
  • Support dropdown img
      • Gallery
      • Videos
      • Contact us
      • FAQs
      • Resources
    • Please feel free to contact us

      atsupport@chartexpo.com

Categories
All Data Visualizations Data Analytics Surveys
Add-ons/
  • Google Sheets
  • Microsoft Excel
  • Power BI
All Data Visualizations Data Analytics Surveys
Add-ons
  • Google Sheets
  • Microsoft Excel
  • Power BI

We use cookies

This website uses cookies to provide better user experience and user's session management.
By continuing visiting this website you consent the use of these cookies.

Ok

ChartExpo Survey


Home > Blog > Microsoft Excel

How to Calculate Operating Cash Flow for Visual Clarity?

How to calculate operating cash flow? If you’re running a business, that’s a question you can’t afford to overlook. Why? Cash flow is the heartbeat of any company.

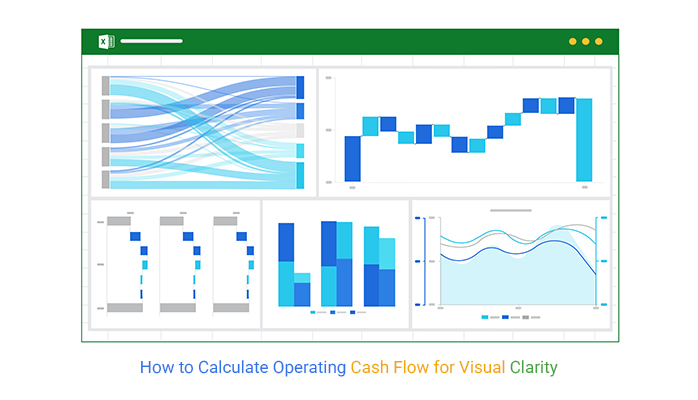
Understanding how to calculate operating cash flow gives a clear view of how money moves through daily operations. Financial charts and graphs help identify trends and potential issues more easily.

How to Calculate Operating Cash Flow

Operating cash flow shows whether a company generates enough cash to cover expenses. This matters to investors, lenders, and business owners. Strong cash flow helps a company grow, invest, and survive downturns.

The formula isn’t complicated. Start with net income, then adjust for non-cash expenses and changes in working capital. Using an income statement template in Excel simplifies this process and ensures accuracy. Depreciation, accounts receivable, and inventory levels all play a role. Get it right, and you’ll clearly understand financial health.

Many focus too much on profit and ignore cash flow. Profit doesn’t pay the bills—cash flow does. A month-to-month comparison Excel chart helps track changes in cash flow over time. Knowing how to calculate operating cash flow helps avoid nasty surprises. Strategies like reducing receivable days or controlling expenses can help if cash flow is weak.

Operating cash flow tells you whether a business is thriving or struggling. It’s a simple but powerful tool. Therefore, calculating it could mean the difference between success and failure.

Let me show you how to get it done.

First…

Table of Contents:

  1. What is an Operating Cash Flow?
  2. Why is Operating Cash Flow Important?
  3. How to Calculate Operating Cash Flow?
  4. How to Perform Operating Cash Flow Analysis in Excel?
  5. Benefits of Using an Operating Cash Flow Template
  6. FAQs
  7. Wrap Up

What is an Operating Cash Flow?

Definition: Operating cash flow is the cash a business generates from its core activities. It shows how much money comes in from sales and how much goes out for expenses. This number excludes investments and financing activities.

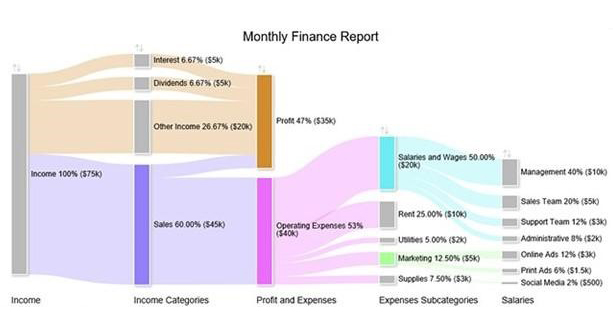
A favorable operating cash flow means the company earns enough to cover costs, while a negative signals trouble. Using a monthly financial report template in Excel helps track these cash movements with clarity. This, in turn, helps investors and owners assess financial health.

Strong cash flow supports growth, debt payments, and expansion. Tracking it ensures a business stays financially stable.

Efficient Methods to Create a Multi Axis Line Chart in Power BI for Calculating Operating Cash Flow

Efficient Methods to Create a Multi Axis Line Chart in Google Sheets for Calculating Operating Cash Flow

Efficient Methods to Create a Multi Axis Line Chart in Microsoft Excel for Calculating Operating Cash Flow

Why is Operating Cash Flow Important?

Cash keeps a business alive. Operating cash flow (OCF) is a key metric in business analytics. It shows if a company can survive on its core activities. Here’s why it’s crucial:

  • Maintains business operations: Businesses need cash to pay employees, suppliers, and rent. Without a steady inflow, daily operations can quickly grind to a halt.
  • Measures financial health: High OCF means a company generates real cash, not just accounting profits. It shows whether the business can survive without relying on external funding.
  • Supports growth and investments: Expanding requires money for new products, equipment, or market entry. Strong OCF allows businesses to invest without taking on excessive debt.
  • Acts as an early warning system: If OCF starts dropping, it signals trouble before profits decline. Catching issues helps to adjust and avoid financial distress.

How to Calculate Operating Cash Flow?

A business can survive without profit for a while, but it’s game over without cash. Multivariate analysis helps uncover key cash flow patterns. That’s why knowing how to calculate operating cash flow is essential. It tells you if your company provides enough money to keep running.

Indirect Method for Calculating OCF

The indirect method starts with net income from the income statement. Then, adjustments are made for non-cash expenses and changes in working capital.

Here’s the formula:

Operating Cash Flow = Net Income + Non-Cash Expenses + Changes in Working Capital

  • Non-cash expenses include depreciation, amortization, and stock-based compensation.
  • Working capital changes involve accounts receivable, inventory, and accounts payable.

Direct Method for Calculating OCF

The direct method looks at actual cash inflows and outflows. Instead of starting with net income, it tracks customer cash and payments made to suppliers and employees.

The formula is:

Operating Cash Flow = Total Revenue – Operating Expenses 

How to Perform Operating Cash Flow Analysis in Excel?

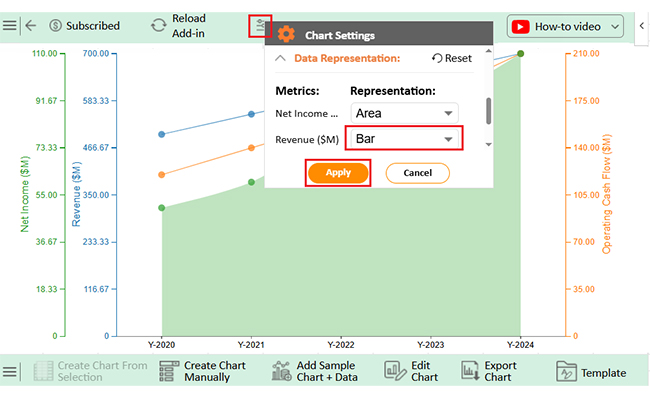
Crunching numbers is one thing, but making sense of them is another. Operating cash flow (OCF) is key to understanding a company’s financial health. While Excel helps with calculations, its charts often fall flat.

Exploratory data analysis helps uncover patterns in cash flow, making financial trends easier to interpret. Clear visuals simplify data analysis, but Excel’s built-in tools can be clunky.

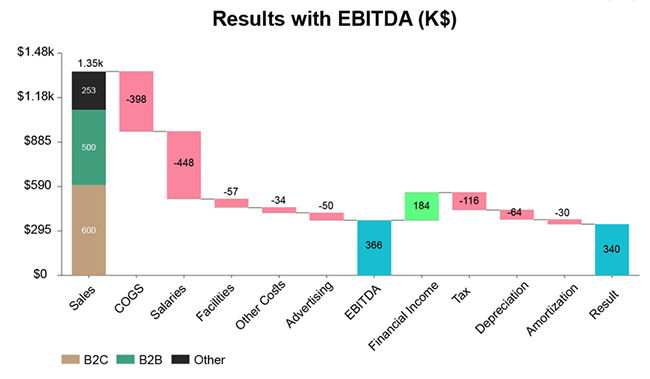
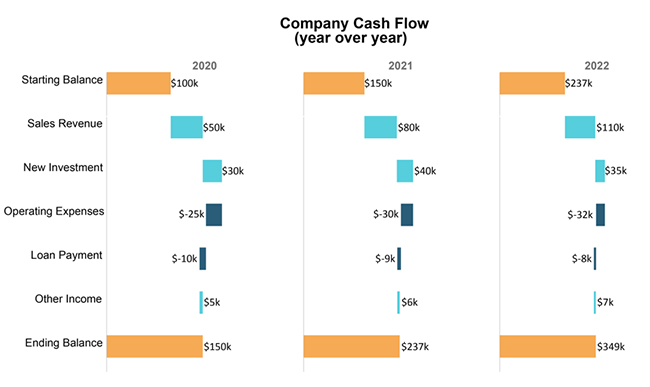
That’s where ChartExpo comes in. It transforms dull spreadsheets into insightful, appealing, easy-to-read visualizations.

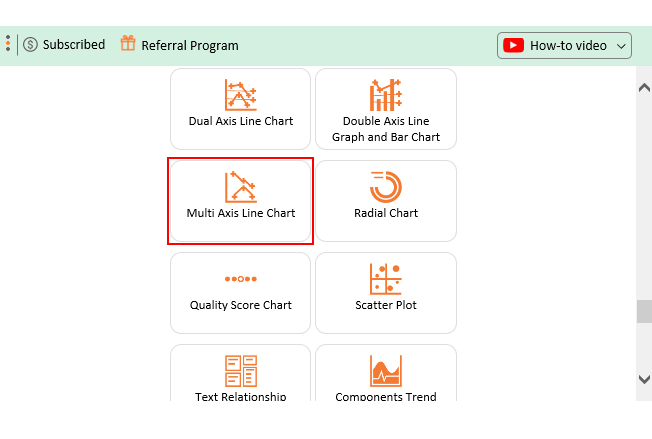
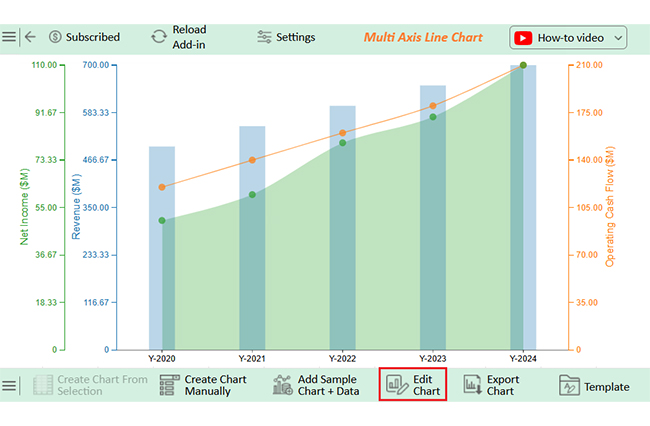
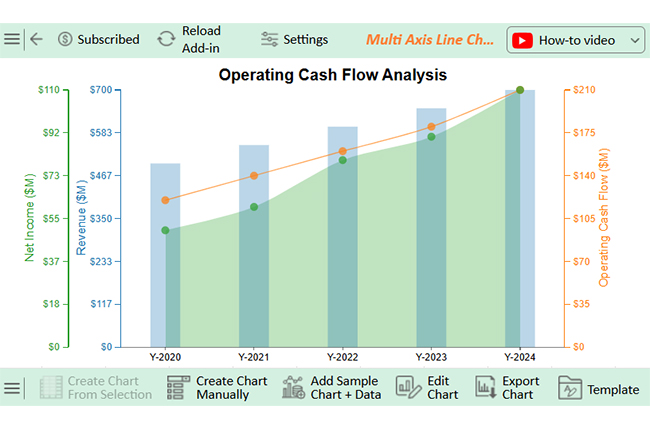
The charts below were created in Excel using ChartExpo:

Multi-Axis Line Chart

How to Calculate Operating Cash Flow

Sankey Chart

How to Calculate Operating Cash Flow

Clustered Stacked Bar Chart

How to Calculate Operating Cash Flow

Stacked Waterfall Chart

How to Calculate Operating Cash Flow

Horizontal Waterfall Chart

How to Calculate Operating Cash Flow

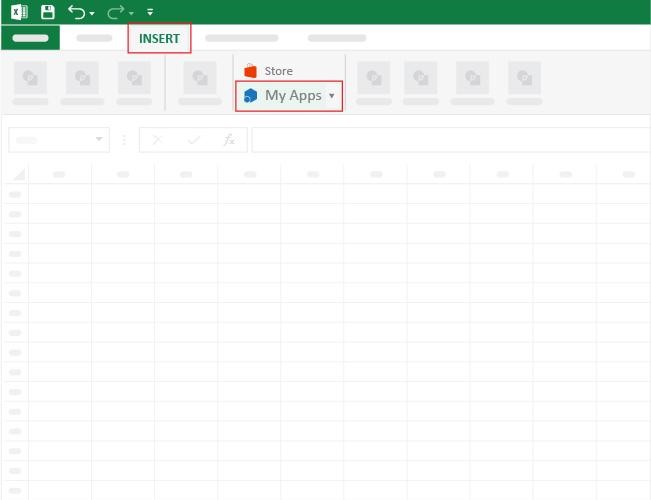
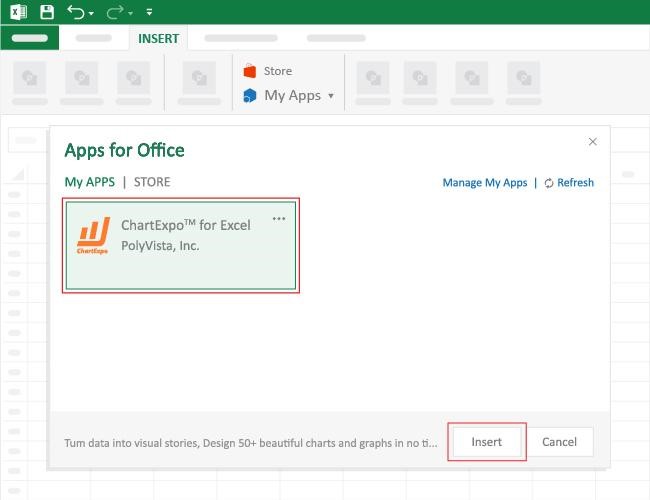
How to Install ChartExpo in Excel?

  1. Open your Excel application.
  2. Open the worksheet and click the “Insert” menu.
  3. You’ll see the “My Apps” option.
  4. In the Office Add-ins window, click “Store” and search for ChartExpo on my Apps Store.
  5. Click the “Add” button to install ChartExpo in your Excel.

ChartExpo charts are available both in Google Sheets and Microsoft Excel. Please use the following CTAs to install the tool of your choice and create beautiful visualizations with a few clicks in your favorite tool.

Example

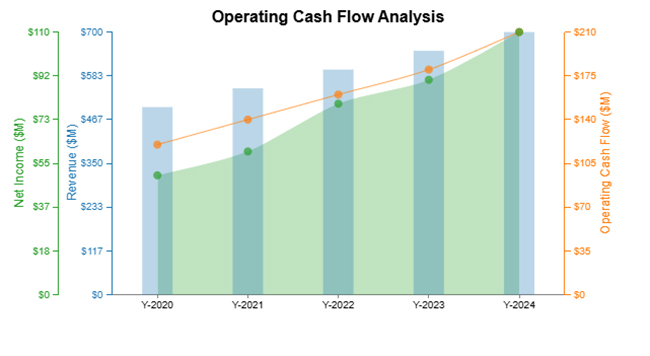
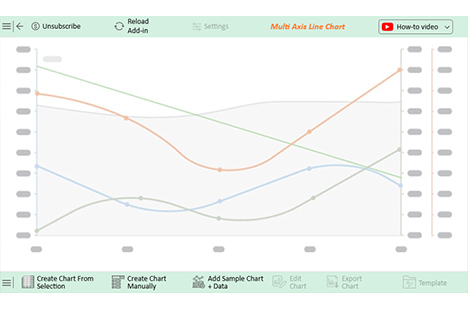
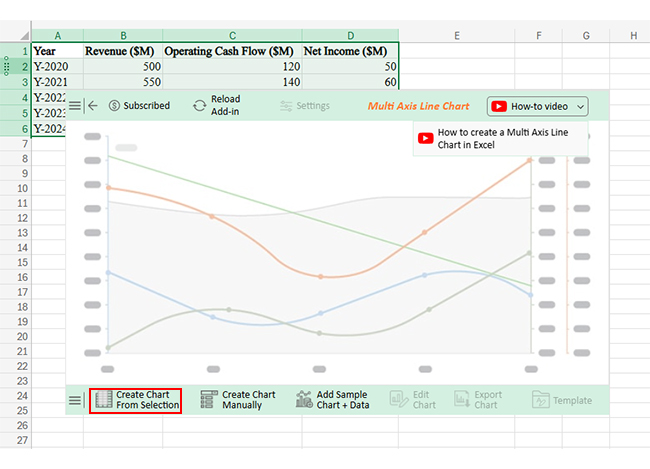
Let’s analyze this sample data in Excel using ChartExpo.
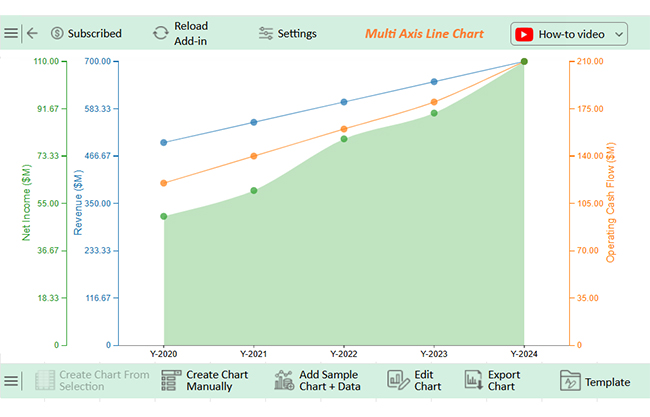
Year Revenue ($M) Operating Cash Flow ($M) Net Income ($M)
Y-2020 500 120 50
Y-2021 550 140 60
Y-2022 600 160 80
Y-2023 650 180 90
Y-2024 700 210 110
  • To get started with ChartExpo, install ChartExpo in Excel.
  • Now Click on My Apps from the INSERT.
How to Calculate Operating Cash Flow
  • Choose ChartExpo from My Apps, then click Insert.
How to Calculate Operating Cash Flow
  • Once it loads, scroll through the charts list to locate and choose the “Multi Axis Line Chart”.
How to Calculate Operating Cash Flow
  • You will see a Multi Axis Line Chart on the screen.
How to Calculate Operating Cash Flow
  • Click the “Create Chart From Selection” button after selecting the data from the sheet, as shown.
How to Calculate Operating Cash Flow
  • ChartExpo will create a Multi Axis Line Chart with respect to the given data:
How to Calculate Operating Cash Flow
  • Change Data presentation as follows;
How to Calculate Operating Cash Flow
  • If you want to add anything to the chart, click the Edit Chart button:
How to Calculate Operating Cash Flow
  • Click the pencil icon next to the Chart Header to change the title.
  • It will open the properties dialog. Under the Text section, you can add a heading in Line 1 and enable Show.
  • Give the appropriate title of your chart and click the Apply button.
How to Calculate Operating Cash Flow
  • You can add the dollar sign with all values and change the precision value to zero as follows:
  • Click the “Save Changes” button to persist the changes made to the chart.
How to Calculate Operating Cash Flow
  • Your final Multi Axis Line Chart will appear as below.
How to Calculate Operating Cash Flow

Insights

  • There was consistent revenue, operating cash flow, and net income growth over five years.
  • Operating cash flow and net income grew faster than revenue.
  • This data indicates stronger financial health and efficient cash generation.

Benefits of Using an Operating Cash Flow Template

Managing cash flow doesn’t have to be a headache. An operating cash flow template cuts through the information overload, simplifies tracking, saves time, and improves accuracy. Here’s why it’s a game-changer:

  • Time-saving: Calculating cash flow using manual formulas takes time and effort. This template automates the process, allowing businesses to focus on growth.
  • Accuracy and consistency: Errors in cash flow statements can lead to costly mistakes. A structured template ensures data is recorded correctly every time.
  • Improved financial analysis: Understanding cash trends is key to economic success. This template helps identify patterns, making it easier to spot risks and opportunities.
  • Customization: Every business has unique financial needs. You can adjust the template to track specific cash flow categories and reporting preferences.
  • Enhanced decision-making: Making smart financial decisions requires precise data. A template provides an organized view of cash movement, helping leaders plan effectively.
  • Facilitates communication: Financial discussions are easier with clear data. OCF information design keeps teams and investors informed.
  • Supports budgeting and forecasting: A clear cash flow history helps predict future financial needs. Therefore, businesses can plan budgets with confidence and avoid cash shortages.
  • Cost-effective solution: Expensive software isn’t always necessary for tracking cash flow. A simple, well-structured template provides valuable insights without extra costs.

FAQs

How to calculate operating cash flow with tax rate?

To calculate operating cash flow:

  1. Start with net income: Obtain net income from the income statement.
  2. Adjust for non-cash expenses: Add depreciation and amortization.
  3. Adjust for working capital changes: Add/subtract current assets/liabilities changes.
  4. Tax impact: Use the formula:

Operating Cash Flow=EBIT×(1−Tax Rate)+Depreciation−Change in Working Capital

What is the operating cash flow ratio example?

The Operating Cash Flow Ratio measures liquidity.

Formula:

Operating Cash Flow Ratio=Operating Cash Flow/Current Liabilities

Example:

  • Operating Cash Flow = $50,000
  • Current Liabilities = $25,000
  • Ratio = 0 (indicates strong liquidity)

Is net income the same as operating cash flow?

No, net income and operating cash flow are different.

  • Net income: Profit after expenses, taxes, and depreciation.
  • Operating cash flow: Actual cash from operations.
  • Key difference: Operating cash flow adjusts for non-cash expenses and working capital changes.

Wrap Up

Calculating operating cash flow is essential for any business. It shows whether a company has enough cash to cover daily expenses. Without strong cash flow, even profitable companies can struggle.

Both the indirect and direct methods provide valuable insights. The indirect method adjusts net income, while the direct method tracks cash inflows and outflows. A cash flow diagram in Excel helps visualize these movements, making analysis easier. Knowing both methods helps in making informed financial decisions.

A favorable operating cash flow means a business is financially stable. It allows for growth, debt repayment, and investment in new opportunities. A negative cash flow signals potential trouble and the need for adjustments. Using a monthly cash flow template in Excel simplifies tracking and ensures consistency.

Using a cash flow template makes calculations easier. It saves time, improves accuracy, and ensures consistency so businesses can track their financial health without unnecessary stress. An expense report template in Excel also helps categorize costs, giving a clearer view of spending patterns.

Cash flow analysis also helps with budgeting and forecasting. It prepares companies for future financial needs, and strong cash management leads to long-term success.

Every business must track cash flow. Learning how to calculate operating cash flow boosts clarity, reduces risk, and improves decisions.

Do not hesitate.

Start calculating operating cash flow today and install ChartExpo for better visuals and improved financial insights.

How much did you enjoy this article?

ExcelAd1
Start Free Trial!
149024

Related articles

next previous
Microsoft Excel10 min read

Grant Tracking Spreadsheet: Insights Made Easy

A Grant Tracker Spreadsheet helps track funding, deadlines, and expenses in Excel. Learn to use grant tracking templates, analyze data, and stay organized.

Microsoft Excel10 min read

What is Excel Software Used for: A Complete Guide

What is Excel software used for? It organizes, analyzes, and manages data. Explore its workplace applications, benefits, and top tips for efficiency and more.

Microsoft Excel12 min read

Artificial Intelligence in Excel for Clear Insights

Discover how AI elevates Excel, from automation to advanced data analysis. This blog covers benefits, limitations, and examples to enhance your productivity.

Microsoft Excel8 min read

Excel Task Tracker Template for Smarter Task Insights

Task tracker template in Excel organizes tasks, tracks deadlines, and boosts efficiency. Learn its benefits, and explore expert tips to simplify task management.

Microsoft Excel10 min read

Invoice Tracker Template in Excel for Better Insights

An invoice tracker Excel template helps track invoices, due dates, and payments. Learn how to use this template for better financial management.

ChartExpo logo

Turn Data into Visual
Stories

CHARTEXPO

  • Home
  • Gallery
  • Videos
  • Services
  • Pricing
  • Contact us
  • FAQs
  • Privacy policy
  • Terms of Service
  • Sitemap

TOOLS

  • ChartExpo for Google Sheets
  • ChartExpo for Microsoft Excel
  • Power BI Custom Visuals by ChartExpo
  • Word Cloud

CATEGORIES

  • Bar Charts
  • Circle Graphs
  • Column Charts
  • Combo Charts
  • Comparison Charts
  • Line Graphs
  • PPC Charts
  • Sentiment Analysis Charts
  • Survey Charts

TOP CHARTS

  • Sankey Diagram
  • Likert Scale Chart
  • Comparison Bar Chart
  • Pareto Chart
  • Funnel Chart
  • Gauge Chart
  • Radar Chart
  • Radial Bar Chart
  • Sunburst Chart
  • see more
  • Scatter Plot Chart
  • CSAT Survey Bar Chart
  • CSAT Survey Chart
  • Dot Plot Chart
  • Double Bar Graph
  • Matrix Chart
  • Multi Axis Line Chart
  • Overlapping Bar Chart
  • Control Chart
  • Slope Chart
  • Clustered Bar Chart
  • Clustered Column Chart
  • Box and Whisker Plot
  • Tornado Chart
  • Waterfall Chart
  • Word Cloud
  • see less

RESOURCES

  • Blog
  • Resources
  • YouTube
SIGN UP FOR UPDATES

We wouldn't dream of spamming you or selling your info.

© 2025 ChartExpo, all rights reserved.