• Home
  • Tools dropdown img
    • Spreadsheet Charts

      • ChartExpo for Google Sheets
      • ChartExpo for Microsoft Excel
    • Power BI Charts

      • Power BI Custom Visuals by ChartExpo
    • Word Cloud

  • Charts dropdown img
    • Chart Category

      • Bar Charts
      • Circle Graphs
      • Column Charts
      • Combo Charts
      • Comparison Charts
      • Line Graphs
      • PPC Charts
      • Sentiment Analysis Charts
      • Survey Charts
    • Chart Type

      • Box and Whisker Plot
      • Clustered Bar Chart
      • Clustered Column Chart
      • Comparison Bar Chart
      • Control Chart
      • CSAT Survey Bar Chart
      • CSAT Survey Chart
      • Dot Plot Chart
      • Double Bar Graph
      • Funnel Chart
      • Gauge Chart
      • Likert Scale Chart
      • Matrix Chart
      • Multi Axis Line Chart
      • Overlapping Bar Chart
      • Pareto Chart
      • Radar Chart
      • Radial Bar Chart
      • Sankey Diagram
      • Scatter Plot Chart
      • Slope Chart
      • Sunburst Chart
      • Tornado Chart
      • Waterfall Chart
      • Word Cloud
    • Google Sheets
      Microsoft Excel
  • Services
  • Pricing
  • Contact us
  • Blog
  • Support dropdown img
      • Gallery
      • Videos
      • Contact us
      • FAQs
      • Resources
    • Please feel free to contact us

      atsupport@chartexpo.com

Categories
All Data Visualizations Data Analytics Surveys
Add-ons/
  • Google Sheets
  • Microsoft Excel
  • Power BI
All Data Visualizations Data Analytics Surveys
Add-ons
  • Google Sheets
  • Microsoft Excel
  • Power BI

We use cookies

This website uses cookies to provide better user experience and user's session management.
By continuing visiting this website you consent the use of these cookies.

Ok

ChartExpo Survey


Home > Blog > Microsoft Excel

How to Calculate Gross Monthly Income? Elevate Insights

Curious about how to calculate gross monthly income? Did you know that the average American spends around 90,000 hours at work during their lifetime? That’s a staggering amount of time dedicated to the pursuit of that elusive thing we call money.

How to Calculate Gross Monthly Income

And speaking of money, have you ever wondered how to calculate gross monthly income?

You’re in luck because I’m here to spill the beans.

We’ll show you how to calculate gross monthly income and use the insights to your advantage.

Don’t worry if numbers make your head spin faster than a game of twister. We’ll make it as painless and as enjoyable as possible.

It’s not just about the money. Calculating your gross monthly income empowers you to make wise financial decisions.

Want to budget like a boss? Dreaming of that new car? Planning for retirement? Knowing your gross monthly income will help you make your journey to financial success less bumpy.

So, let’s learn how to calculate monthly gross income. It’s time to take control of your financial destiny and let those numbers do the talking!

Table of Contents:

  1. What is Gross Monthly Income?
  2. Why Calculate Gross Monthly Income?
  3. How to Calculate Gross Monthly Income?
  4. Types of Tools Used for Calculating Gross Monthly Income
  5. How to Examine Gross Monthly Income?
  6. Wrap Up

What is Gross Monthly Income?

Definition: Gross monthly income is the total earnings an individual receives before deductions such as taxes and other withholdings. It encompasses all sources of income, including wages, bonuses, and additional forms of compensation.

Gross monthly income reflects the agreed-upon salary or hourly pay rate for employees. Self-employed individuals consider their total business revenue as gross income.

How to calculate gross monthly income is fundamental for individuals and businesses in managing finances. Gross monthly income serves as a starting point for financial calculations, providing insight into your earning capacity.

This crucial metric is essential for budgeting, loan eligibility assessments, and evaluating overall financial health. Understanding ‘how to calculate gross monthly income’ is fundamental for making informed financial decisions that align with your long-term financial goals examples.

Why Calculate Gross Monthly Income?

You know what they say: money makes the world go round. Learning how to calculate gross monthly income and manage your monthly budget in Excel is like taking a spin on the financial Ferris wheel.

Why?

  • Budgeting

Understanding gross monthly income is fundamental for budgeting purposes. It provides a comprehensive view of the total earnings before deductions, allowing you to allocate funds effectively.

This insight is crucial for managing day-to-day expenses, planning for savings, and informed decision-making about discretionary spending.

  • Financial planning

Gross monthly income is pivotal in financial planning. It serves as a cornerstone for setting goals, projecting future earnings, and determining the feasibility of financial objectives. This is instrumental in creating a comprehensive financial plan that aligns with long-term aspirations.

  • Loan approval

Lenders often assess gross monthly income when evaluating loan applications. It is a key factor in determining the borrower’s ability to repay the loan. A higher gross income can positively impact loan approval and potentially secure better terms.

  • Tax Planning

Gross income forms the basis for calculating taxable income. You need to consider your gross earnings to determine your tax liability. This understanding is crucial for implementing effective tax strategies and optimizing tax liabilities.

  • Negotiations and Contracts

In negotiations and contract discussions, knowledge of gross monthly income is essential. It helps to negotiate favorable terms, whether it’s in employment contracts, business agreements, or other financial arrangements.

  • Salary Evaluation

You can use your gross income to evaluate the competitiveness of your salary within the industry/job market. By leveraging self-service analytics, you can benchmark your compensation against industry standards, assess overall compensation, and negotiate fair remuneration packages.

  • Government Assistance Eligibility

Certain government assistance programs consider gross income when determining eligibility. Therefore, understanding gross income is essential when seeking assistance or benefits. It directly influences qualification criteria for various government support initiatives.

  • Benchmarking

For businesses, gross income serves as a critical benchmark for performance evaluation. It facilitates comparisons of financial results over time and against industry standards. This data is valuable for assessing the company’s financial health, identifying improvement areas, and staying competitive.

How to Calculate Gross Monthly Income?

These steps outline the most effective way to determine how to calculate gross monthly income for both salaried and hourly employees:

  • Find Your Salary or Wages:

Determine your total salary if you are a salaried employee. This figure is usually stated in your employment contract or paycheck. If you are paid hourly, gather information on the number of hours worked in a given pay period.

  • Divide Your Salary or Multiply Your Hourly Wages:

For Salaried Employees: Divide your annual salary by 12 to get your gross monthly income. For example, if your annual salary is $60,000, your gross monthly income would be $60,000 / 12 = $5,000.

For Hourly Employees: Multiply your hourly wage by the number of hours worked per week. Then, multiply the result by the number of weeks in a month. For instance, if you earn $20 per hour and work 40 hours per week, your gross monthly income would be;

$20 x 40 hours x 4 weeks = $3,200.

Types of Tools Used for Calculating Gross Monthly Income

Curious about how to calculate gross monthly income? Here are the various tools you can use to calculate your monthly gross income. The right tool depends on individual preferences, needs, and technical proficiency.

  • Calculator apps: You can use basic calculator apps on smartphones or computers for straightforward calculations. Manually input your salary or hourly wage and perform the necessary calculations to determine your gross monthly income.
  • Excel or Google Sheets: Spreadsheets like Excel or Google Sheets provide a more dynamic platform for creating personalized calculators and income statement templates in Excel. You can set up formulas to automate calculations, allowing for easy adjustments and scenario planning.
  • Online gross income calculators: Various online platforms offer dedicated gross income calculators. These user-friendly tools typically require input of salary details or hourly wages. They generate instant results, making it convenient for individuals without advanced spreadsheet skills.
  • Payroll software: Organizations often use payroll software to calculate and manage employee compensation. For individuals, payroll calculators within such software can provide an accurate breakdown of gross monthly income.
  • Financial apps: Mobile applications designed for financial management may include features for calculating gross monthly income. These apps can offer additional functionalities like expense tracking, budgeting, and financial planning.
  • HR software: Human resources (HR) software often includes payroll and compensation management modules for businesses. These tools automate employee gross income calculation and help organizations maintain accurate financial records.
  • Tax software: Tax preparation software often includes features for estimating gross income. You can input various income sources, then the software calculates the gross income figure. This is crucial for accurate tax filing and planning.
  • Personal finance websites: Several personal finance websites provide online calculators and tools to help you assess your gross monthly income. These resources are accessible to anyone with an internet connection and are often accompanied by additional financial planning advice.

How to Examine Gross Monthly Income?

Data analysis is no cakewalk. The complex web of numbers, patterns, and correlations can spin your head. And amidst this intricate quest, data visualization emerges as a powerful ally.

But alas, Excel, the spreadsheet juggernaut, often falls short when it comes to visually representing data. That’s where ChartExpo swoops in like a superhero in a cape, ready to save the day. It makes data analysis as easy as pie.

Let’s learn how to Install ChartExpo in Excel.

  1. Open your Excel application.
  2. Open the worksheet and click the “Insert” menu.
  3. You’ll see the “My Apps” option.
  4. In the office Add-ins window, click “Store” and search for ChartExpo on my Apps Store.
  5. Click the “Add” button to install ChartExpo in your Excel.

ChartExpo charts are available both in Google Sheets and Microsoft Excel. Please use the following CTAs to install the tool of your choice and create beautiful visualizations with a few clicks in your favorite tool.

Gross Monthly Income Example

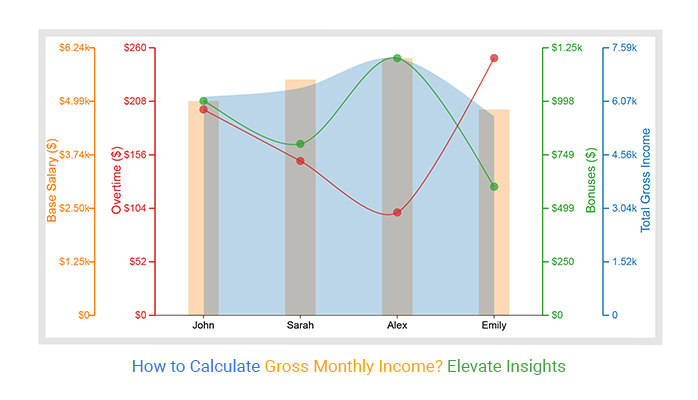
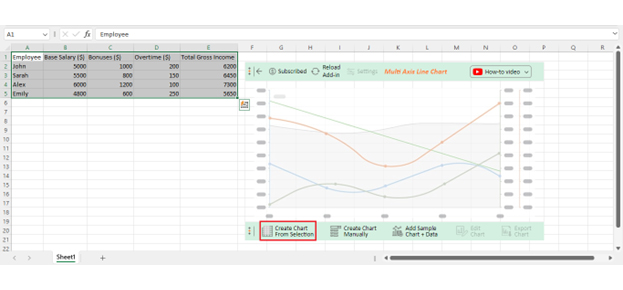
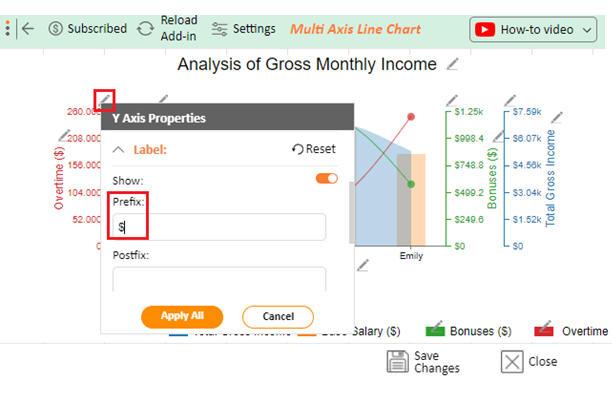
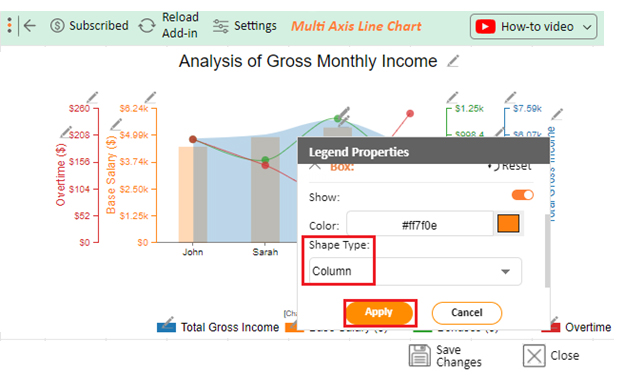
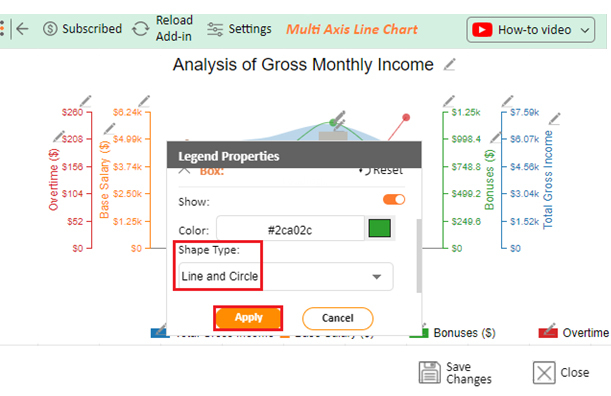
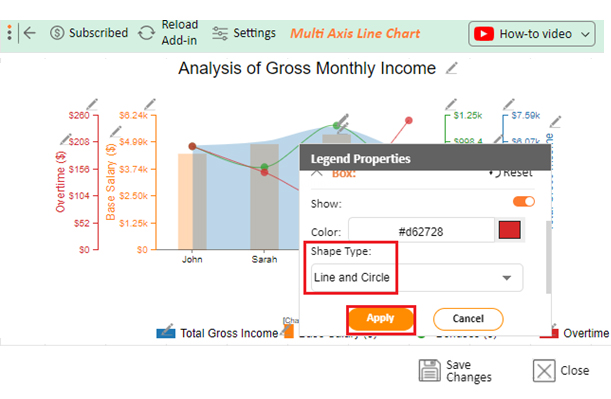
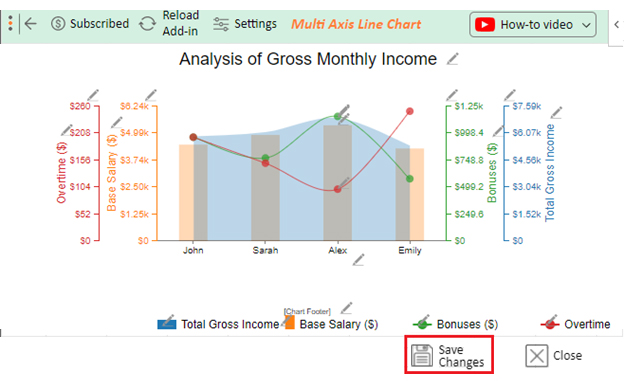
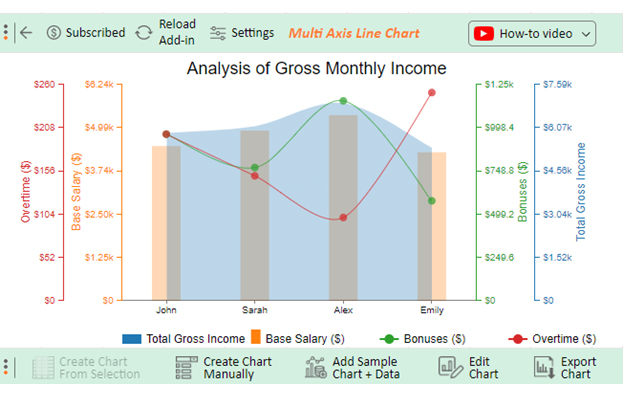
The tabular data below displays employees’ gross monthly income, including base salary, bonuses, and overtime.

Employee Base Salary ($) Bonuses ($) Overtime ($) Total Gross Income
John 5000 1000 200 6200
Sarah 5500 800 150 6450
Alex 6000 1200 100 7300
Emily 4800 600 250 5650

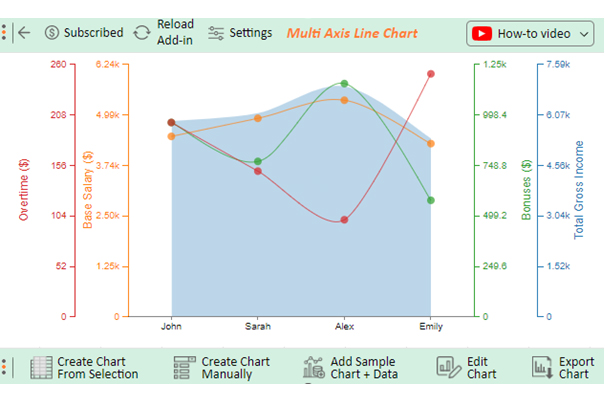
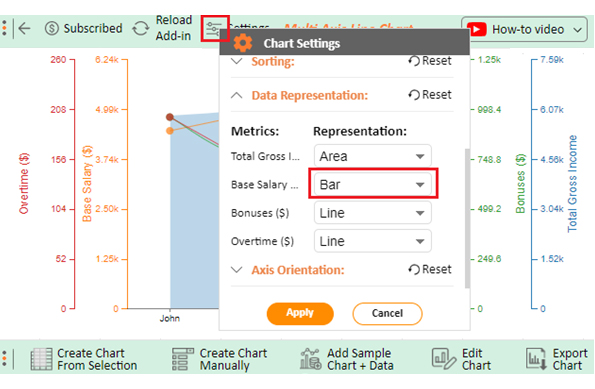
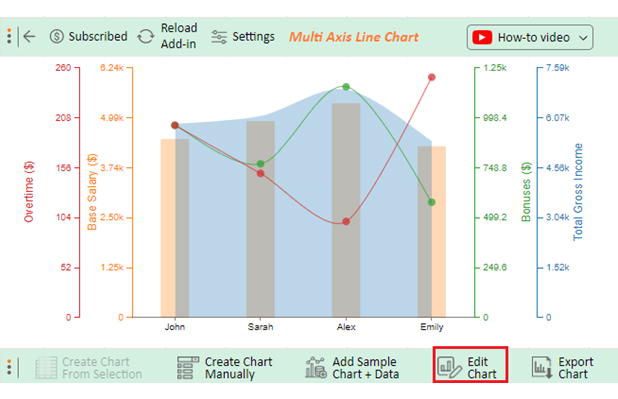
Follow the steps below to visualize this data in Excel with ChartExpo and glean valuable insights.

  • To get started with ChartExpo, install ChartExpo in Excel.
  • Now Click on My Apps from the INSERT menu.
insert chartexpo in excel
  • Choose ChartExpo from My Apps, then click Insert.
open chartexpo in excel
  • Once it loads, scroll through the charts list to locate and choose the “Multi-Axis Line Chart”.
search multi axis line chart in excel
  • Click the “Create Chart From Selection” button after selecting the data from the sheet, as shown.
Create Chart From Selection ce501
  • ChartExpo will generate the visualization below for you.
How to Calculate Gross Monthly Income Template
  • Click on Settings and change the “Data Representation” of Base Salary into Bar.
Data Representation ce501
  • If you want to add anything to the chart, click the Edit Chart button:
Edit Chart ce501
  • Click the pencil icon next to the Chart Header to change the title.
  • It will open the properties dialog. Under the Text section, you can add a heading in Line 1 and enable Show.
  • Give the appropriate title of your chart and click the Apply button.
Apply Tittle on Chart ce501
  • Change the precision value of Bonuses as well as Total Gross Income to zero and add the dollar sign:
Change the precision value of Bonuses
  • Change the precision value of Base Salary to zero and add the dollar sign:
Change the precision value of Base Salary
  • Change the precision value of Overtime to zero and add the dollar sign:
Change the precision value of Overtime
  • Change the Legend shape of “Base Salary” to Column and click the “Apply” button.
Change Legend Shape of Base Salary
  • Change the Legend shape of “Bonuses” into a Line and Circle and click the “Apply” button.
Change Legend Shape of Bonuses
  • Change the Legend shape of “Overtime” into a Line and Circle and click the “Apply” button.
Change Legend Shape of Overtime
  • Click the “Save Changes” button to persist the changes made to the chart.
Save All Changes ce501
  • Your final Multi Axis Line Chart will look like the one below.
Final How to Calculate Gross Monthly Income

Insights

  • Alex boasts the highest overall gross income, totaling $7300, primarily influenced by a $1200 bonus.
  • Emily’s earnings are influenced by overtime, whereas Sarah enjoys a well-rounded distribution of salary, bonus, and overtime.
  • John has a notable income, marked by a significant $1000 bonus.

FAQs

What is an example of a gross income?

An example of gross income is an individual earning $60,000 annually. To calculate their monthly gross income, you divide $60,000 by 12, resulting in $5,000. This figure represents earnings before deductions, providing a comprehensive view of total compensation.

Why is knowing your gross income important?

Knowing your gross income is crucial for budgeting, loan eligibility, and tax planning. It provides a comprehensive view of earnings before deduction. Thus, it serves as the starting point for financial decisions and shaping overall financial strategies.

Why use gross income instead of net?

Using gross income instead of net provides a clearer picture of overall earnings before deductions. Gross income serves as a foundational metric for financial planning and decision-making. It’s crucial for budgeting, loan applications, and negotiating salaries.

Wrap Up

Understanding how to calculate gross monthly income is fundamental for financial planning and decision-making. This knowledge is pivotal for budgeting and is crucial in loan approval processes, tax planning, and negotiations. It provides a baseline for assessing financial health and making informed decisions.

The use of tools like payroll software in organizations simplifies the process. Furthermore, financial apps and personal finance websites offer accessible options for individuals. Whatever tool you use, the goal is to understand the financial landscape before considering taxes and other deductions.

Leveraging ChartExpo to calculate gross monthly income adds a dynamic dimension to financial analysis. It transforms raw data into actionable insights, making the process more engaging and accessible. You can visualize salary distributions, bonuses, and overtime impacts on a comprehensive interface.

Conclusively, learning how to calculate gross monthly income is not merely a mechanical task but a strategic move in financial literacy. It empowers you to evaluate your earning capacity, negotiate fair compensation, and make informed financial decisions. Therefore, mastering it is a cornerstone of financial literacy and effective financial planning.

How much did you enjoy this article?

ExcelAd2
Start Free Trial!
132649

Related articles

next previous
Microsoft Excel13 min read

Excel for Teachers for Insightful Preparation

Excel for teachers simplifies grading, tracks attendance, and organizes data. Find its key features, expert tips, and how ChartExpo enhances data visualization.

Microsoft Excel14 min read

How to Make a Cash Flow Diagram in Excel?

Learn how to make a Cash Flow Diagram in Excel. It will help you learn to visualize and analyze inflows and outflows of your business cash flow.

Microsoft Excel11 min read

Succession Planning Template for Long-Term Success

Succession Planning Templates help businesses prepare for leadership changes. Learn to create, analyze, and use them for seamless transitions and growth.

Microsoft Excel10 min read

Grant Tracking Spreadsheet: Insights Made Easy

A Grant Tracker Spreadsheet helps track funding, deadlines, and expenses in Excel. Learn to use grant tracking templates, analyze data, and stay organized.

Microsoft Excel10 min read

What is Excel Software Used for: A Complete Guide

What is Excel software used for? It organizes, analyzes, and manages data. Explore its workplace applications, benefits, and top tips for efficiency and more.

ChartExpo logo

Turn Data into Visual
Stories

CHARTEXPO

  • Home
  • Gallery
  • Videos
  • Services
  • Pricing
  • Contact us
  • FAQs
  • Privacy policy
  • Terms of Service
  • Sitemap

TOOLS

  • ChartExpo for Google Sheets
  • ChartExpo for Microsoft Excel
  • Power BI Custom Visuals by ChartExpo
  • Word Cloud

CATEGORIES

  • Bar Charts
  • Circle Graphs
  • Column Charts
  • Combo Charts
  • Comparison Charts
  • Line Graphs
  • PPC Charts
  • Sentiment Analysis Charts
  • Survey Charts

TOP CHARTS

  • Sankey Diagram
  • Likert Scale Chart
  • Comparison Bar Chart
  • Pareto Chart
  • Funnel Chart
  • Gauge Chart
  • Radar Chart
  • Radial Bar Chart
  • Sunburst Chart
  • see more
  • Scatter Plot Chart
  • CSAT Survey Bar Chart
  • CSAT Survey Chart
  • Dot Plot Chart
  • Double Bar Graph
  • Matrix Chart
  • Multi Axis Line Chart
  • Overlapping Bar Chart
  • Control Chart
  • Slope Chart
  • Clustered Bar Chart
  • Clustered Column Chart
  • Box and Whisker Plot
  • Tornado Chart
  • Waterfall Chart
  • Word Cloud
  • see less

RESOURCES

  • Blog
  • Resources
  • YouTube
SIGN UP FOR UPDATES

We wouldn't dream of spamming you or selling your info.

© 2025 ChartExpo, all rights reserved.