Categories
The month nears its end, and it’s time to assess your spending habits after clearing your bills. Delving into the realm of monthly budget examples seems imperative as you scrutinize your financial landscape.


In its simplest form, a monthly budget is a roadmap for your finances. This tool can help you take control of your money rather than letting it control you. It’s a way of assigning every dollar a purpose. This ensures you’re making the most of your income and avoiding the pitfalls of overspending and financial stress.
Throughout history, budgeting has been integral to effective financial management. From ancient Rome to modern times, people have relied on budgeting to maintain financial stability.
According to the Federal Reserve, nearly 40% of American adults would struggle to cover an unexpected $400 expense. This statistic reveals a concerning reality: the need to create a monthly budget.
In this blog post, we will delve into the fundamental principles of “monthly budget examples” to understand their real-world impact. By exploring these examples, we aim to empower you to take charge of your financial well-being and make strategic choices.
Definition: A monthly budget is a financial plan outlining your monthly income and expenses. It helps you track how much money comes in, where it goes, and how much you can save. By organizing your spending, a monthly budget gives you better control over your finances and supports smarter financial decisions.
Here are some reasons why creating a monthly budget is fundamental.
Here are some examples of a monthly budget:
For instance, if you possess financial data and aim to observe the flow of money.
Suppose you have a dataset of detailed breakdowns of income sources and expenditure categories, providing valuable insights into financial management.
| Income | Budget | Categories | Spending | Amount |
| Salary | Total Income | Federal Taxes | 7126 | |
| Salary | Total Income | State Taxes | 1247 | |
| Salary | Total Income | Local Taxes | 945 | |
| Social Security | Total Income | Spending | Housing | 13497 |
| Dividends | Total Income | Spending | Utilities | 2290 |
| Dividends | Total Income | Spending | Vehicle | 4826 |
| Property | Total Income | Spending | Gas | 2254 |
| Other Income | Total Income | Spending | Food | 1754 |
| Other Income | Total Income | Spending | Eating Out | 495 |
| Salary | Total Income | Spending | Household | 5161 |
| Salary | Total Income | Spending | Insurance | 3260 |
| Salary | Total Income | Spending | Alcohol | 592 |
| Salary | Total Income | Spending | Clothing | 3133 |
| Salary | Total Income | Spending | Entertainment | 414 |
| Salary | Total Income | Spending | Phone | 1587 |
| Salary | Total Income | Saving | 7541 |
Here is a Sankey diagram for the following company financial data of relevant items.

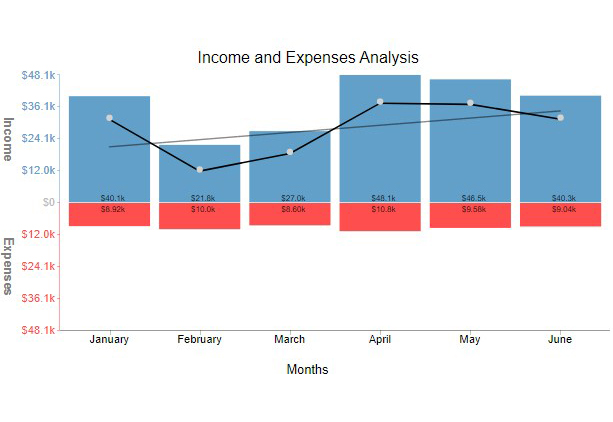
Suppose you have financial data at your disposal and seek to understand the dynamics of income and expenses over several months.
| Months | Income | Expenses |
| January | 40134 | 8919 |
| February | 21757 | 10038 |
| March | 26950 | 8595 |
| April | 48140 | 10793 |
| May | 46486 | 9584 |
| June | 40333 | 9042 |
You can see an example monthly budget that how revenue, expenses, or net income changes have impacted the business.
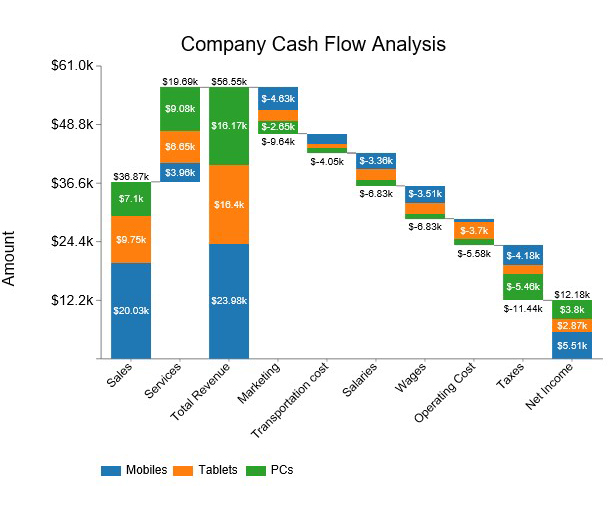
Suppose you possess financial data and aim to dissect the intricate flow of finances within a business operation, especially in the context of performance-based budgeting. The provided dataset offers a comprehensive breakdown of revenue, expenses, and net income across different product categories, including Mobiles, Tablets, and PCs, over a specific period.
| Stacks | Bridges | Amount |
| Sales | Mobiles | 20025 |
| Sales | Tablets | 9746 |
| Sales | PCs | 7095 |
| Service | Mobiles | 9077 |
| Service | Tablets | 6650 |
| Service | PCs | 3959 |
| Total Revenue | Mobiles | 29102 |
| Total Revenue | Tablets | 16400 |
| Total Revenue | PCs | 11100 |
| Cost of Goods Sold | Mobiles | -4630 |
| Cost of Goods Sold | Tablets | -2360 |
| Cost of Goods Sold | PCs | -2650 |
| Marketing | Mobiles | -2150 |
| Marketing | Tablets | -935 |
| Marketing | PCs | -965 |
| Salaries | Mobiles | -3360 |
| Salaries | Tablets | -2340 |
| Salaries | PCs | -1130 |
| Wages | Mobiles | -3510 |
| Wages | Tablets | -2390 |
| Wages | PCs | -930 |
| Operating Cost | Mobiles | -5460 |
| Operating Cost | Tablets | -3700 |
| Operating Cost | PCs | -1240 |
| Taxes | Mobiles | -4180 |
| Taxes | Tablets | -1800 |
| Taxes | PCs | -640 |
| Net Income | Mobiles | 2750 |
| Net Income | Tablets | 3160 |
| Net Income | PCs | 5980 |
The visualization of an example monthly budget looks as follows:
A monthly budget calculator is a practical tool that helps you stay on top of your income and expenses. Instead of guessing where your money goes each month, the calculator organizes your finances into clear categories like housing, food, transportation, savings, and entertainment.
By using one, you can:
Start by writing down all sources of income, such as salary, freelance work, or side hustles. This gives you a clear picture of how much money you have to work with each month.
Record both fixed costs (like rent, bills, and loan payments) and variable expenses (such as groceries, fuel, and entertainment). Tracking helps you see exactly where your money goes.
Divide expenses into groups like essentials, discretionary spending, and savings. This makes it easier to prioritize needs over wants.
Assign a specific amount for each category based on your income. Make sure your essentials and savings are covered before optional spending.
Compare your total expenses with your income. If you’re overspending, reduce costs in certain categories or trim unnecessary items.
Set aside a specific portion of your income for savings and an emergency fund. Consider it a mandatory expense to strengthen your financial safety net.
Review your budget weekly or monthly. Update it for changes in income or expenses, and adjust limits to stay on track.
Managing money effectively starts with a solid monthly budget. The right monthly budget app can make budgeting simple, clear, and even a little enjoyable. Instead of struggling with an endless monthly budget spreadsheet and numbers, a good budget tool helps you track income, expenses, and savings in a way that’s easy to understand.
While Excel is often the go-to for managing budgets, creating charts and graphs in it can feel bland and time-consuming. That’s where ChartExpo comes in. ChartExpo is an Excel add-in designed to transform your data into insightful visualizations. For a monthly budget, this means you can instantly see where your money is going, how much you’re saving, and which categories are eating up your income.
Unlike traditional Excel charts, ChartExpo gives you clear, interactive visuals that make budgeting in Excel more engaging. Whether you want to track household expenses, business costs, or savings goals, this tool helps you turn raw numbers into a monthly budget graph.
So, if you’re looking for the best monthly budget tool, ChartExpo is an excellent choice to simplify financial tracking and create clear financial charts for smarter money decisions.
I’ll show you how.
Let’s learn how to install ChartExpo in Excel.
ChartExpo monthly budget graphs are available both in Google Sheets and Microsoft Excel. Please use the following CTAs to install the tool of your choice and create beautiful visualizations with a few clicks in your favorite tool.
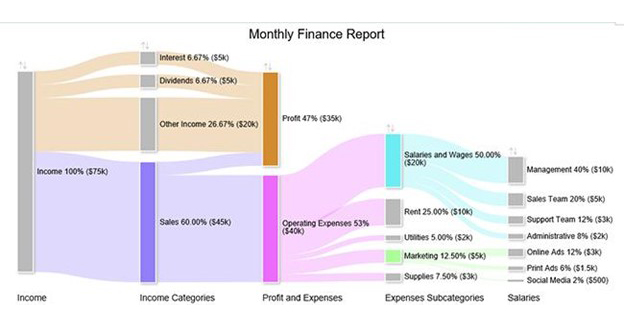
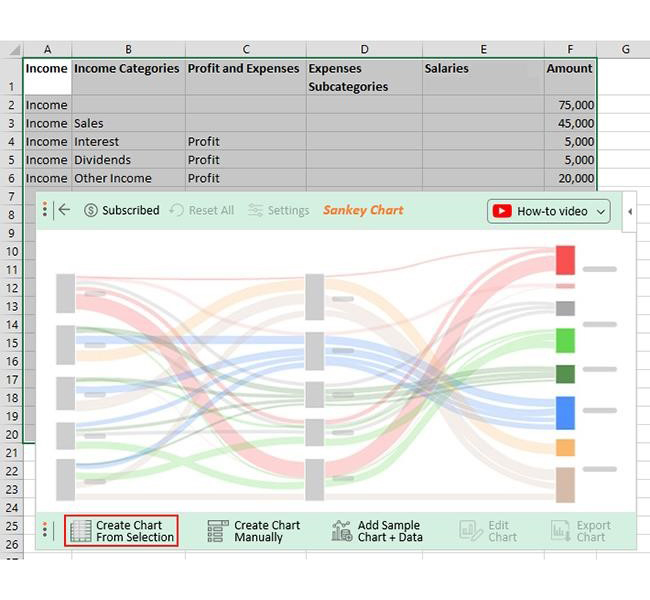
The table below contains sample monthly budget data on income and expenses, ready to visualize using a Sankey chart in Excel.
| Income | Income Categories | Profit and Expenses | Expenses Subcategories | Salaries | Amount |
| Income | 75,000 | ||||
| Income | Sales | 45,000 | |||
| Income | Interest | Profit | 5,000 | ||
| Income | Dividends | Profit | 5,000 | ||
| Income | Other Income | Profit | 20,000 | ||
| Sales | Profit | 5,000 | |||
| Sales | Operating Expenses | 40,000 | |||
| Operating Expenses | Salaries and Wages | 20,000 | |||
| Salaries and Wages | Management | 10,000 | |||
| Salaries and Wages | Sales Team | 5,000 | |||
| Salaries and Wages | Support Team | 3,000 | |||
| Salaries and Wages | Administrative | 2,000 | |||
| Operating Expenses | Rent | 10,000 | |||
| Operating Expenses | Utilities | 2,000 | |||
| Operating Expenses | Marketing | 5,000 | |||
| Marketing | Online Ads | 3,000 | |||
| Marketing | Print Ads | 1,500 | |||
| Marketing | Social Media | 500 | |||
| Operating Expenses | Supplies | 3,000 |
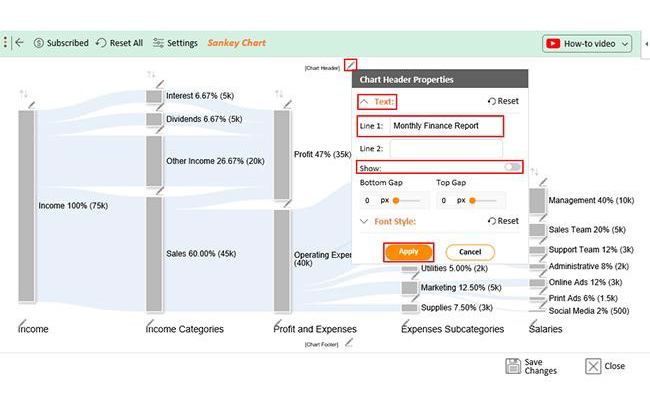
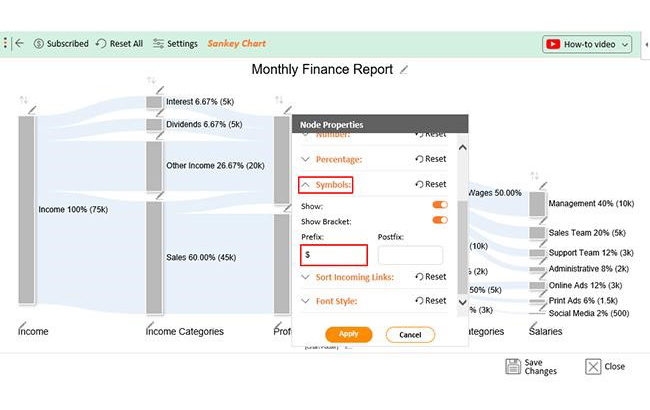
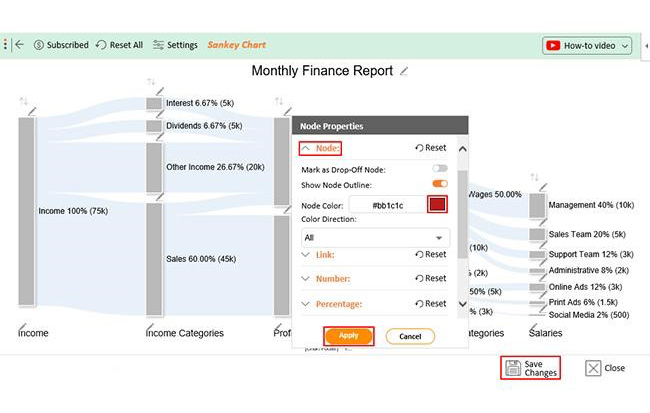
Let’s visualize this data so that everyone can understand. Follow these steps to create a visualization in Excel with ChartExpo.


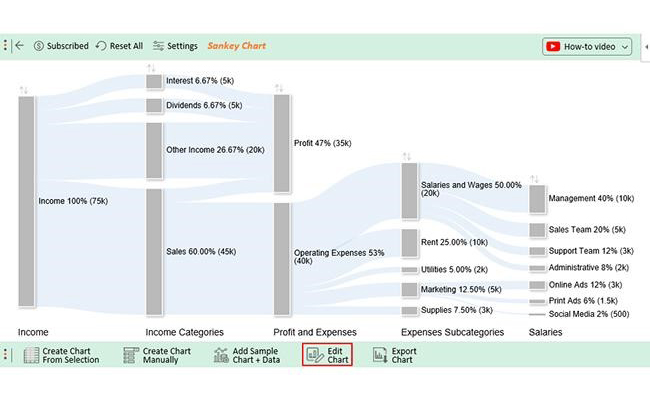
Income Composition
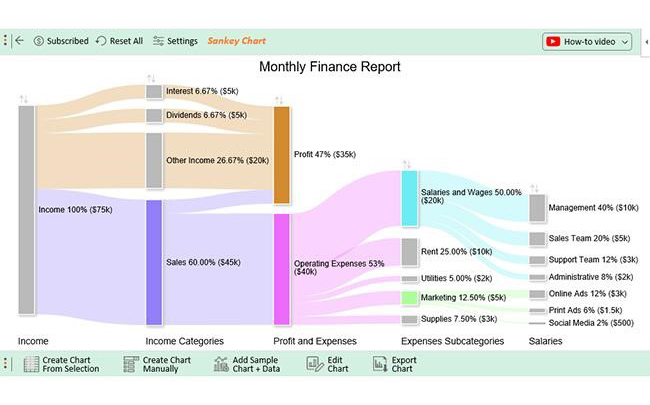
The monthly income totals $75,000, predominantly sourced from $45,000 in sales. Additionally, $5,000 comes from interest and dividends, with an extra $20,000 originating from other income streams. This breakdown offers clarity on the primary contributors to the overall monthly income.
Expense Breakdown
Total expenses reach $40,000, primarily allocated to operating expenses. Salaries and wages form the largest chunk, totaling $20,000. The rest covers rent, utilities, marketing, and supplies within the operating expenses.
Detailed Salary Allocation
The data offers a detailed salary breakdown. The “Management” category incurs the highest expense at $10,000, followed by “Sales Team” at $5,000, “Support Team” at $3,000, and “Administrative” at $2,000. This breakdown provides valuable insights into labor cost distribution among different roles.
Marketing Expenses
The $5,000 marketing expenses are divided into three subcategories: $3,000 for online ads, $1,500 for print ads, and $500 for social media.
Profit Contribution
The Sankey Diagram visually illustrates financial flow, highlighting a $35,000 profit ($75,000 income minus $40,000 expenses). Main contributors include $5,000 from sales and $20,000 from other income.
A monthly budget planner gives you a clear picture of your income and expenses. It helps you stay on track, avoid overspending, and ensure every dollar has a purpose.
By setting spending limits, you can consistently put money aside for savings or an emergency fund. Over time, this builds financial security and helps you reach long-term goals.
When your finances are organized, money stops being a source of constant worry. A budget planner removes uncertainty and gives you peace of mind knowing exactly where you stand.
With all your expenses and priorities in front of you, it’s easier to make informed choices. A budget planner helps you focus on needs first, while still leaving room for wants when possible.
Record your monthly earnings and spending. This helps you see where your money goes and identify areas to cut back.
Allocate specific amounts for essentials like rent, food, and bills. Sticking to these limits keeps you from overspending.
Treat savings as a non-negotiable expense. Building an emergency fund and savings first ensures financial stability.
At the end of each month, check your budget. Adjust categories or goals based on your actual spending and income changes.
A realistic monthly budget aligns income with expenses, covering necessities like housing, utilities, and groceries. It allocates funds for savings, debt repayment, and discretionary spending. Flexibility is key, allowing adjustments based on changing circumstances and financial goals.
A comprehensive monthly budget includes;
Regular reviews and adjustments ensure financial alignment with goals.
A typical monthly budget encompasses the following;
It strikes a balance between needs and wants, fostering financial stability and goal achievement.
Learning how to create monthly budget examples is fundamental for financial responsibility and success. It serves as a compass, guiding you to clearly understand your financial landscape. A monthly budget instills financial awareness by meticulously outlining income and categorizing expenses, allowing for informed decision-making.
With “monthly budget examples,” expense management transforms into a strategic endeavor as you pinpoint optimization areas and prioritize spending in alignment with needs and goals. Goal setting takes center stage, with the budget helping to allocate funds for specific financial objectives. Be it saving for a vacation, building an emergency fund, or paying off debts.
Moreover, a monthly budget example facilitates effective debt management. It provides a structured approach to repayments, preventing the accrual of interest. Also, it acts as a contingency plan for unexpected emergencies, ensuring financial resilience in unforeseen circumstances.
The beauty of a monthly budget lies in its adaptability and iterative nature. Regular reviews and adjustments allow flexibility in response to changing circumstances, evolving priorities, or unforeseen expenses.
In essence, creating a monthly budget is not just a financial exercise. It is a transformative process that empowers you to take control of your financial destiny. It fosters discipline, strategic thinking, and a proactive approach to financial well-being. Ultimately, it leads to stability, security, and the achievement of financial aspirations.
Do not hesitate.
Embrace the concept of a monthly budget with ChartExpo today. With ChartExpo, the journey toward financial goals becomes a dynamic and insightful exploration of financial well-being.
Some More Related Articles:
How much did you enjoy this article?


Calculate accounts receivable turnover ratio to measure credit collection speed, improve cash flow, and strengthen your financial strategy. Read on!

Change Management KPIs are the key to tracking adoption, performance, and ROI during transitions. Find out which metrics matter. Read on!

Data collection methods and techniques determine the quality of every insight you act on. Explore key approaches for gathering reliable data. Read on!


