• Home
  • Tools dropdown img
    • Spreadsheet Charts

      • ChartExpo for Google Sheets
      • ChartExpo for Microsoft Excel
    • Power BI Charts

      • Power BI Custom Visuals by ChartExpo
    • Word Cloud

  • Charts dropdown img
    • Chart Category

      • Bar Charts
      • Circle Graphs
      • Column Charts
      • Combo Charts
      • Comparison Charts
      • Line Graphs
      • PPC Charts
      • Sentiment Analysis Charts
      • Survey Charts
    • Chart Type

      • Box and Whisker Plot
      • Clustered Bar Chart
      • Clustered Column Chart
      • Comparison Bar Chart
      • Control Chart
      • CSAT Survey Bar Chart
      • CSAT Survey Chart
      • Dot Plot Chart
      • Double Bar Graph
      • Funnel Chart
      • Gauge Chart
      • Likert Scale Chart
      • Matrix Chart
      • Multi Axis Line Chart
      • Overlapping Bar Chart
      • Pareto Chart
      • Radar Chart
      • Radial Bar Chart
      • Sankey Diagram
      • Scatter Plot Chart
      • Slope Chart
      • Sunburst Chart
      • Tornado Chart
      • Waterfall Chart
      • Word Cloud
    • Google Sheets
      Microsoft Excel
  • Services
  • Pricing
  • Contact us
  • Blog
  • Support dropdown img
      • Gallery
      • Videos
      • Contact us
      • FAQs
      • Resources
    • Please feel free to contact us

      atsupport@chartexpo.com

Categories
All Data Visualizations Data Analytics Surveys
Add-ons/
  • Google Sheets
  • Microsoft Excel
  • Power BI
All Data Visualizations Data Analytics Surveys
Add-ons
  • Google Sheets
  • Microsoft Excel
  • Power BI

We use cookies

This website uses cookies to provide better user experience and user's session management.
By continuing visiting this website you consent the use of these cookies.

Ok

ChartExpo Survey


Home > Blog > Power BI

Power BI Remove Duplicates for Improved Insights

Power BI remove duplicates is a revolutionary tool for analysts globally.

Picture this: you are sorting through vast amounts of data, looking for valuable insights. Suddenly, you encounter an obstacle – redundant entries are causing issues in your analysis.

Power BI Remove Duplicates

Frustrating, right? In data, clarity is king, and duplicates are the unruly jesters trying to overthrow the monarchy.

Businesses create 2.5 quintillion bytes of data every day. Given the enormous amount of data, duplication is not only possible but also unavoidable.

This is where Power BI steps in, wielding its remove duplicates feature like a knight in shining armor. It dives into the sea of data, emerging with only the unique, valuable pearls of information.

But why is removing duplicates so critical? Well, consider making decisions based on skewed data. It’s similar to mapping out a trip with repeated landmarks.

Wouldn’t you keep going around in circles? Power BI guarantees the precision of your data mapping, guiding you toward well-informed decisions and strategic insights.

However, wielding the Power BI Remove Duplicates feature isn’t just about pressing a button. It’s about understanding the nuances of your data. Know when a duplicate isn’t merely a copy but a valuable piece of a different puzzle.

In this blog post, we’ll explore the hows and whys of using Power BI to remove duplicates. Get ready to transform your data from a tangled web of repeats into a streamlined, insight-generating powerhouse.

Table of Contents:

  1. Understanding Power BI Remove Duplicate
  2. Why is it Important to Remove Duplicates in Power BI?
  3. How to Identify and Remove Duplicate Values in Power BI?
  4. What Advanced Techniques for Power BI Delete Duplicates?
  5. How to Evaluate Data without Duplication in Power BI?
  6. How to Visualize Your Data in Power BI?
  7. What are the Best Practices for Power BI to Remove Duplicate Rows?
  8. Wrap Up

First…

Understanding Power BI Remove Duplicate

Definition: Power BI’s “Remove Duplicate” function allows users to streamline data by eliminating duplicate records from datasets. This feature helps maintain data integrity and accuracy, ensuring analyses and visualizations are based on reliable information.

The “Remove Duplicate” function is handy when working with large datasets containing redundant or repeated information. It simplifies data manipulation and enhances the quality of insights derived from Power BI dashboards and reports.

Power BI’s “Remove Duplicate” capability helps optimize data workflows, leading to more accurate and impactful decision-making.

Why is it Important to Remove Duplicates in Power BI?

Removing duplicates in Power BI from datasets is essential for ensuring data accuracy and reliability. It enhances the effectiveness of analyses and visualizations. Here’s why it’s crucial to eliminate duplicates:

  • Data integrity: Removing duplicates helps maintain the integrity of datasets by ensuring that each record is unique. This prevents erroneous data from skewing analysis results and impacting decision-making. Integrating a Power BI connector can streamline this process, ensuring clean, accurate data for more reliable insights.
  • Accuracy of insights: Eliminating duplicate records ensures analyses and visualizations are based on accurate and representative data. By leveraging tools like the DAX format function, you can further refine your data, enhancing the reliability of insights derived from Power BI reports and dashboards.
  • Efficient resource utilization: Removing duplicates helps to optimize resource utilization, such as storage space and processing power. This streamlines data workflow and improves overall system performance.
  • Enhanced user experience: Removing duplicates improves the user experience by providing clean and organized datasets for analysis. Users can trust the data presented in Power BI reports, leading to greater confidence in decision-making.
  • Compliance and governance: Removing duplicates helps adhere to compliance requirements and governance standards. Organizations can mitigate erroneous or redundant information risks by ensuring data accuracy and integrity.

How to Identify and Remove Duplicate Values in Power BI?

Here are the methods on how to remove duplicates in Power BI.

  • Using the “Remove Duplicates” Function:

How to remove duplicates in Power BI is crucial for maintaining data precision. The following are the steps to make use of the “Remove Duplicates” feature:

  1. Navigate to the “Home” tab and select the “Transform Data” dropdown menu.
  2. Select “Data Transformation” from the choices available.
  3. A newly opened window/dialog box will display the table.
  4. Select the “Remove Rows” dropdown in the “Reduce Rows” section.
  5. Select the “Remove Duplicates” option.
  6. Power BI will eliminate any duplicate rows and retain only the distinct values.
Power BI Remove Duplicates in Toolbar
  • Using the “Group By” Function:

Using the Group By feature in Power BI can effectively detect and handle duplicates. Here are the steps to utilize this feature:

  1. Choose the specific column(s) with potential duplicates.
  2. Go to the “Modeling” tab and select the “New Table option.
  3. To make a new table grouped by the selected column(s), input the formula “=GROUPBY(‘Table Name’, ‘Column Name’)”.
  4. Add more aggregation functions like COUNT or SUM to pinpoint the duplicates.
  5. Use filters or generate visualizations to examine the duplicate entries.

What Advanced Techniques for Power BI Delete Duplicates?

While Power BI offers standard methods for deleting duplicates, advanced techniques provide more flexibility and precision in data cleansing. Here are some advanced techniques for deleting duplicates in Power BI:

  • Use advanced editor: Utilize the Advanced Editor feature in Power Query to write custom M code for more complex duplicate removal operations. This allows for greater control and customization over the duplicate removal process.
  • Custom key creation: Create custom keys using calculated columns or functions to identify duplicates based on specific criteria. This approach enables more granular control over duplicate identification and removal.
  • Combine queries: Merge multiple queries or tables using advanced merging techniques, such as inner or outer joins. This helps to identify and remove duplicates across different datasets effectively.
  • Conditional removal: Implement conditional logic to remove duplicates based on specific conditions or criteria. This technique allows for the selective removal of duplicates based on complex rules or business requirements.
  • Aggregate functions: Utilize aggregate functions, such as SUM, COUNT, or DISTINCTCOUNT, to aggregate data and identify duplicates based on summarized values. This approach is handy for datasets with aggregated or summarized data.
  • Fuzzy matching: Implement fuzzy matching algorithms to identify and remove duplicates based on similarity rather than exact matches. Fuzzy matching techniques consider spelling, formatting, or data discrepancies variations to identify potential duplicates more accurately.

How to Evaluate Data without Duplication in Power BI?

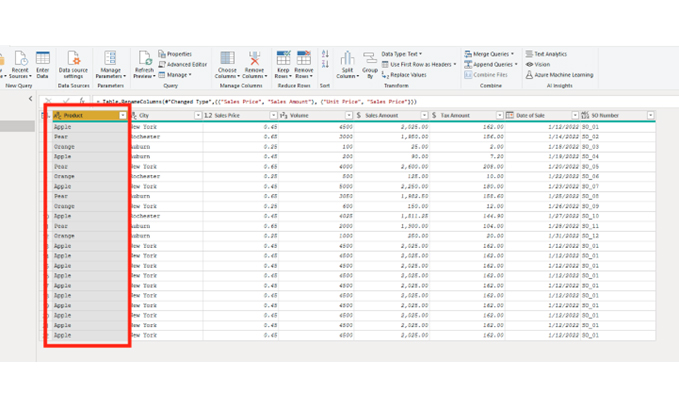
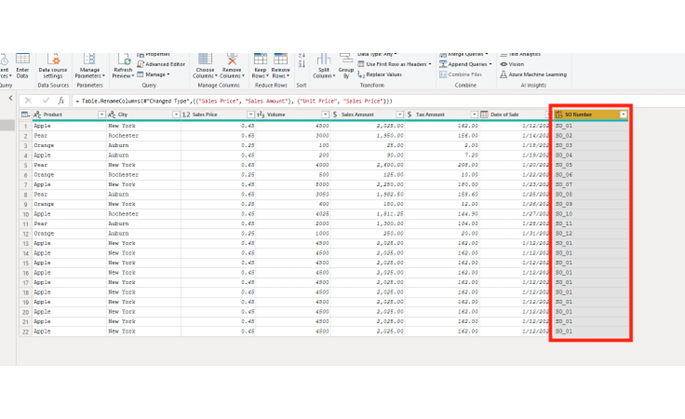
This dataset contains numerous products, some duplicated, but not all. In this demonstration, we are utilizing the product column instead of the SO Number, which should be used.

Select Column for Power BI Remove Duplicates

More than the intended amount was removed once the duplicates were eliminated from the product column. Most of the apples were removed except for the first one, even though we intended to keep them.

Select Product Column for Power BI Remove Duplicates

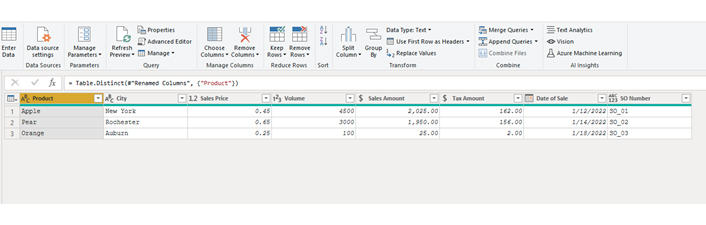
If we had eliminated the duplicates from the SO Number, we would have had 12 rows; however, by utilizing the product column, we have only three.

Walkthrough

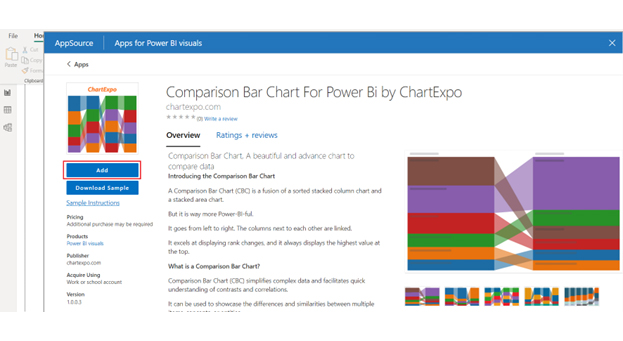
To illustrate this feature, we will provide a brief overview of how to locate and utilize the remove duplicates option.

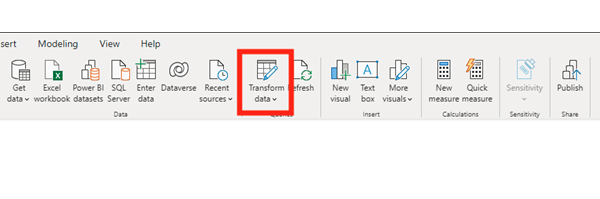
Once you have imported your data, navigate to the Power Query section.

Power Query Section for Power BI Remove Duplicates

Next, select the column from which you want to remove the duplicates. I selected the Sales Order Number.

Note: You will need to select a particular column to accomplish this. Similar to processing numbers, sales order numbers, product identification numbers, and customer account numbers. Refer to the Using a Specific Column section above to view how this appears.

Select SO Number for Power BI Remove Duplicates

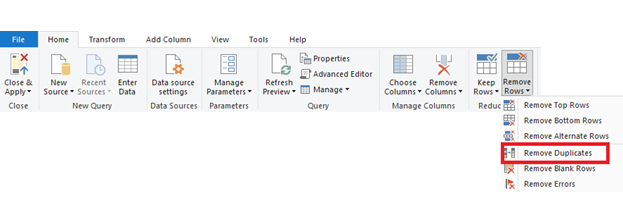
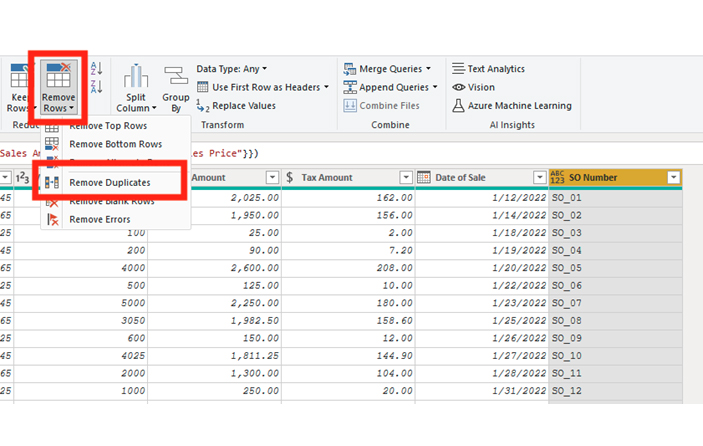
You can now choose the dropdown option to remove rows. Multiple methods can be used to delete rows, but currently, we will opt for the Remove Duplicates feature.

Select Remove Rows for Power BI Remove Duplicates

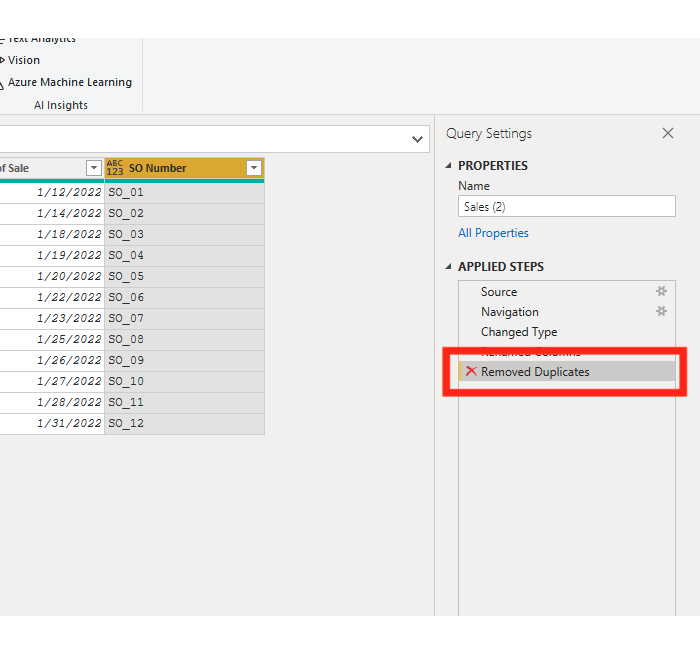
Once you select Remove Duplicates, your query should eliminate all duplicate entries from the chosen column. To eliminate this change, click on the ‘X’ in the list of actions taken in your search query.

Duplicate Entries Eliminated for Power BI Remove Duplicates

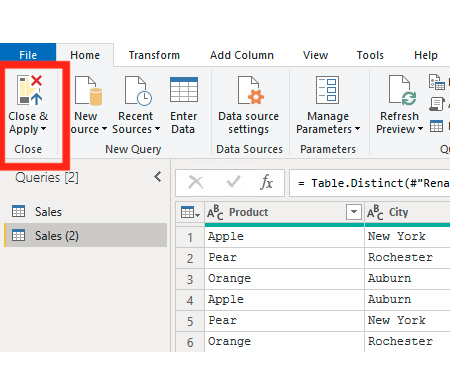
Click on Close and Apply in the upper left corner to complete the task.

Click Close and Apply for Power BI Remove Duplicates

How to Visualize Your Data in Power BI?

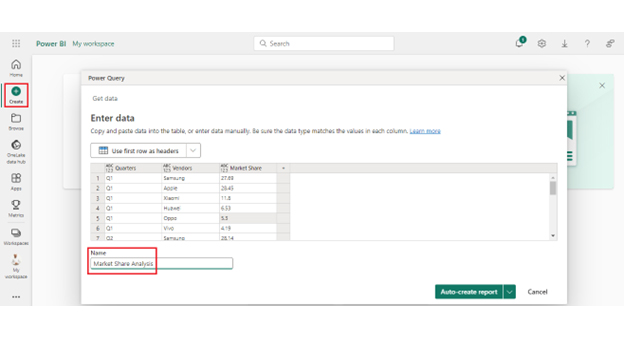
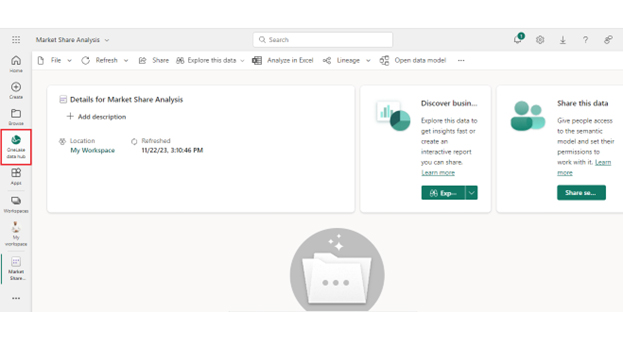
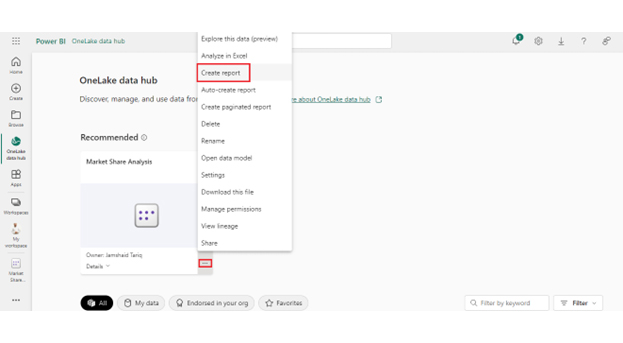
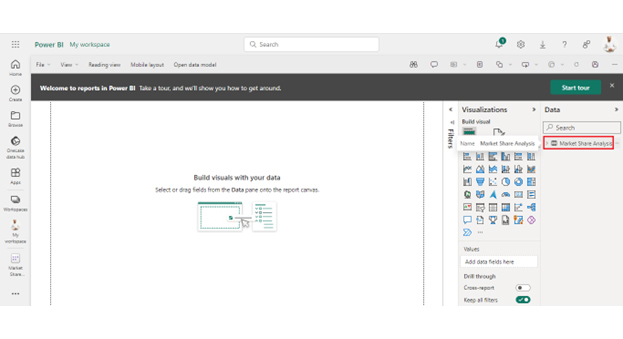
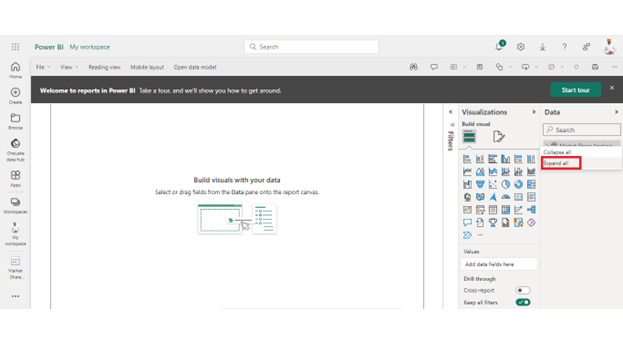
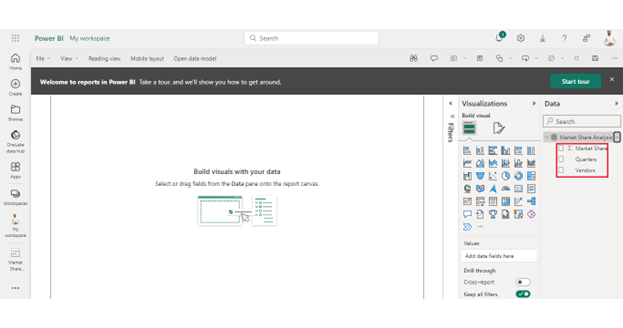
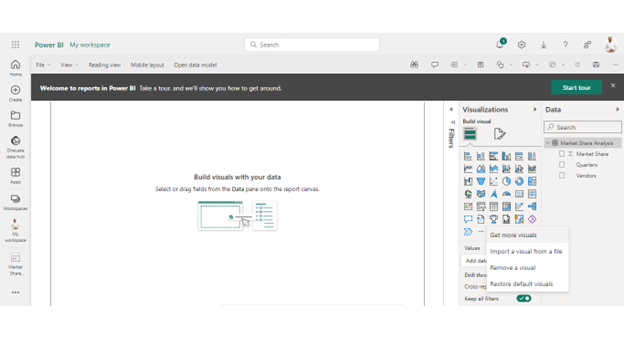
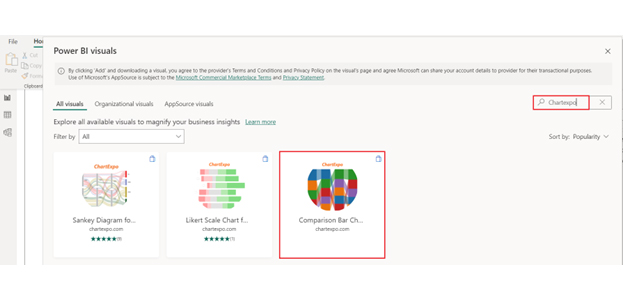
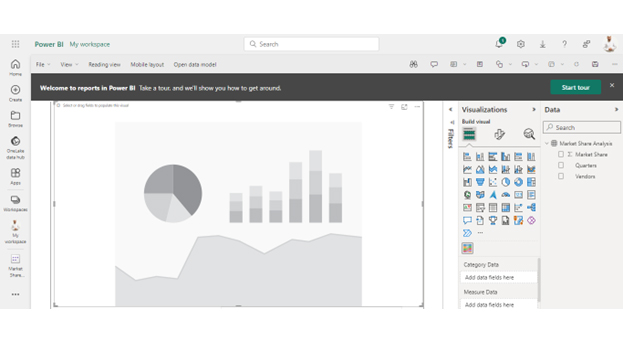
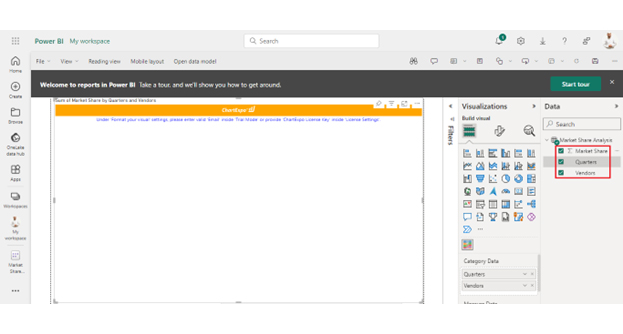
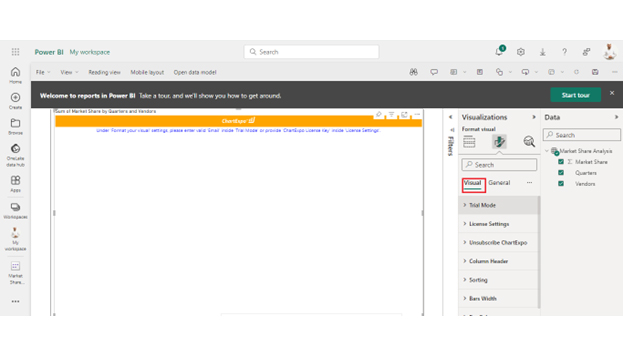
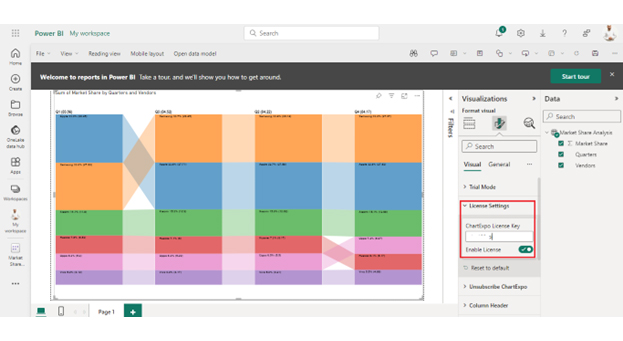
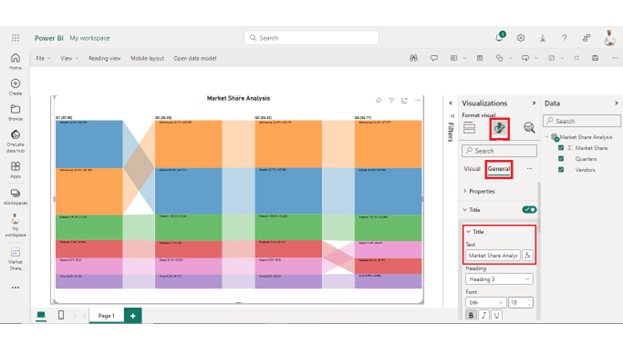
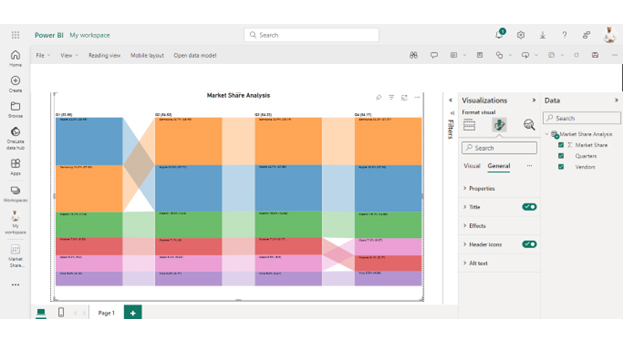
Follow these steps to visualize data in Power BI.

Stage 1: Logging in to Power BI

  • Log in to Power BI.
  • Enter your email address and click the “Submit” button.
Enter email to login to Power BI
  • You are redirected to your Microsoft account.
  • Enter your password and click “Sign in”.
Enter Password to login to Power BI
  • You can choose whether to stay signed in.
Click on stay signed in
  • Once done, the Power BI home screen will open.

Stage 2: Creating a Data Set and Selecting the Data Set to Use in Your Chart

  • Go to the left-side menu and click the “Create” button.
  • Select “Paste or manually enter data“.
select Paste or manually enter data in Power BI ce487
  • We’ll use the sample data below for this example.
Quarters Vendors Market Share
Q1 Samsung 27.69
Q1 Apple 28.45
Q1 Xiaomi 11.8
Q1 Huawei 6.53
Q1 Oppo 5.3
Q1 Vivo 4.19
Q2 Samsung 28.14
Q2 Apple 27.58
Q2 Xiaomi 12.62
Q2 Huawei 6.17
Q2 Oppo 5.5
Q2 Vivo 4.21
Q3 Samsung 28.45
Q3 Apple 27.71
Q3 Xiaomi 12.9
Q3 Huawei 6
Q3 Oppo 5.29
Q3 Vivo 4.17
Q4 Samsung 27.97
Q4 Apple 27.62
Q4 Xiaomi 12.68
Q4 Huawei 5.17
Q4 Oppo 6.07
Q4 Vivo 4.66
  • Paste the above data table in the Power Query Window.
  • Select the “Create a dataset only” option.
Click Create a Dataset Only After Power BI Remove Duplicates
  • On the left-side menu, click “Data Hub“.
  • Power BI populates the data set list. (If you have not created a data set, refer to the Error! Reference source not found section).
Click Data Hub After Power BI Remove Duplicates
  • Click on the “Create a report” dropdown.
Click Create a Report After Power BI Remove Duplicates
  • Click on Market Share Analysis:
Click for Market Share Analysis After Power BI Remove Duplicates
  • Click the “Expand All” button.
Click Exapand All After Power BI Remove Duplicates
  • You can see your chart metrics:
See Chart Metrics After Power BI Remove Duplicates
  • Click on “Get more visuals“.
Get More Visuals After Power BI Remove Duplicates
  • Search for ChartExpo and select the Comparison Bar Chart:
Select Comparison Bar Chart After Power BI Remove Duplicates
  • Click the “Add” button.
Click Add Button After Power BI Remove Duplicates
  • You can now see the Comparison Bar Chart in the visualizations list.
Comparison Bar Chart Icon After Power BI Remove Duplicates
  • Expand your chart space.
Expand Chart Space After Power BI Remove Duplicates
  • Select the metrics of your data:
Select Metrics After Power BI Remove Duplicates
  • Click the second icon of Format Visuals and click on Visual:
Second Incon Format Visuals After Power BI Remove Duplicates
  • In Visual, click License Settings, add the key, and enable the license.
  • After adding the key, you can see the comparison bar chart.
Add License Key of Chart After Power BI Remove Duplicates
  • Click the General tab to add the header text.
Click Add Header Text After Power BI Remove Duplicates
  • The final Comparison Bar Chart in Power BI will appear as below.
Final Power BI Remove Duplicates

Insights

  • Samsung and Apple are the two leading vendors in market share, with Samsung leading the way.
  • Huawei’s market share has been declining, while Xiaomi’s market share has been increasing.
  • Oppo and Vivo have maintained a consistent level of market share.
  • During the last quarter, there was a shift from Huawei to Oppo.

What are the Best Practices for Power BI to Remove Duplicate Rows?

Implementing best practices for removing duplicate rows in Power BI is crucial for maintaining data accuracy and ensuring reliable analyses. Here are key guidelines to follow:

  1. Understand your data: Before removing duplicates, thoroughly understand your dataset’s structure, including the columns and data types present. This understanding will guide your approach to identifying and eliminating duplicates effectively.
  2. Use Power Query Editor for data cleaning: Leverage Power Query Editor within Power BI to clean and prepare your data. This tool provides robust functionalities for data transformation, making it ideal for removing duplicate rows and other data-cleaning tasks.
  3. Remove duplicates appropriately: Based on your analysis objectives, identify the appropriate criteria for removing duplicates. Consider which columns or combination of columns should be used to determine duplicity. Then, ensure alignment with your data cleansing goals.
  4. Maintain data integrity: Prioritize data integrity throughout the duplicate removal process. Carefully review the impact of duplicate removal on the overall dataset to avoid unintended data loss. Also, ensure essential information is preserved.
  5. Handle large datasets efficiently: Optimize performance when working with large datasets by implementing efficient duplicate removal techniques. Utilize Power BI’s performance optimization features and consider partitioning or sampling data for more manageable processing.
  6. Test and validate: Test the duplicate removal process on a subset of data to validate its effectiveness. Verify that duplicates are correctly identified and removed without compromising data quality or introducing errors.
  7. Implement data quality checks: Establish data quality checks to continuously monitor and maintain data integrity after duplicate removal. Regularly audit datasets for potential duplicate issues and implement preventive measures to address them proactively.

FAQs

How do I remove duplicates from a DAX table?

To remove duplicates from a DAX table:

  • Use the DISTINCT function.
  • Apply it to the column(s) containing duplicates.
  • DISTINCT returns a new table with unique values.
  • Use it within CALCULATE or FILTER functions for context-specific removal.

What is the easiest way to remove duplicates?

The easiest way to remove duplicates is by using the Remove Duplicates feature:

  1. Open Power BI Desktop.
  2. Go to the Home tab.
  3. Click on “Remove Duplicates” in the “Manage Queries” group.
  4. Select the column(s) containing duplicates.
  5. Click OK to remove duplicates.

What is the function to remove duplicates in Power BI DAX?

The function to remove duplicates in Power BI DAX is DISTINCT. Use DISTINCT followed by the column name’ it returns a unique list of values. Apply it within the CALCULATE or FILTER functions as needed. It helps streamline data for analysis.

Wrap Up

Understanding Power BI’s Remove Duplicate function is crucial for data cleansing and analysis. It allows you to streamline datasets by eliminating redundant records and enhancing data accuracy and reliability for subsequent analyses.

Removing duplicates helps maintain data integrity by ensuring each record is unique. This is essential for producing accurate insights and visualizations in Power BI reports and dashboards.

Additionally, Power BI’s Remove Duplicate function simplifies data preparation processes. Efficient identification and removing duplicates can save time and effort when cleaning datasets. This streamlined approach enables faster data analysis and facilitates quicker decision-making.

Moreover, eliminating duplicates enhances the user experience by providing clean and organized data for analysis. You can trust the data presented in Power BI reports, leading to greater confidence in insights and conclusions.

In conclusion, Power BI’s Remove Duplicate function is a valuable data management and analysis tool. Removing redundant records enhances data accuracy, maintains integrity, and streamlines data preparation processes.

Do not hesitate.

Start using this function today to maximize the benefits of Power BI and derive actionable insights.

How much did you enjoy this article?

PBIAd2
Start Free Trial!
135844

Related articles

next previous
Power BI12 min read

How to Create Sankey Diagram in Microsoft Power BI?

Learn How to Create Sankey Diagram in Microsoft Power BI using Desktop & Web Service. What they are and how to use them effectively.

Power BI8 min read

Power BI Artificial Intelligence: Insights Using Visuals

Discover all there is to know about the Power BI artificial intelligence. You'll also discover how AI is used in Power BI, and how to use it for analysis and more.

Power BI9 min read

Budgeting in Healthcare: Use Visuals to Spot Budget Gaps

This guide helps you discover what budgeting in healthcare is. You'll also discover the factors that affect hospital budgets and types of budgeting in healthcare.

Power BI9 min read

Predictive Analytics in Power BI for Making Insightful Visuals

This guide shows you everything you need to know about Predictive Analytics in Power BI. It also shows you how it works, and how to interpret the results.

Power BI8 min read

Quarterly Business Review Template for Optimum Reports

Discover what the quarterly business review template is. This guide also shows you the best practices to consider when using the QBR template.

ChartExpo logo

Turn Data into Visual
Stories

CHARTEXPO

  • Home
  • Gallery
  • Videos
  • Services
  • Pricing
  • Contact us
  • FAQs
  • Privacy policy
  • Terms of Service
  • Sitemap

TOOLS

  • ChartExpo for Google Sheets
  • ChartExpo for Microsoft Excel
  • Power BI Custom Visuals by ChartExpo
  • Word Cloud

CATEGORIES

  • Bar Charts
  • Circle Graphs
  • Column Charts
  • Combo Charts
  • Comparison Charts
  • Line Graphs
  • PPC Charts
  • Sentiment Analysis Charts
  • Survey Charts

TOP CHARTS

  • Sankey Diagram
  • Likert Scale Chart
  • Comparison Bar Chart
  • Pareto Chart
  • Funnel Chart
  • Gauge Chart
  • Radar Chart
  • Radial Bar Chart
  • Sunburst Chart
  • see more
  • Scatter Plot Chart
  • CSAT Survey Bar Chart
  • CSAT Survey Chart
  • Dot Plot Chart
  • Double Bar Graph
  • Matrix Chart
  • Multi Axis Line Chart
  • Overlapping Bar Chart
  • Control Chart
  • Slope Chart
  • Clustered Bar Chart
  • Clustered Column Chart
  • Box and Whisker Plot
  • Tornado Chart
  • Waterfall Chart
  • Word Cloud
  • see less

RESOURCES

  • Blog
  • Resources
  • YouTube
SIGN UP FOR UPDATES

We wouldn't dream of spamming you or selling your info.

© 2025 ChartExpo, all rights reserved.