• Home
  • Tools dropdown img
    • Spreadsheet Charts

      • ChartExpo for Google Sheets
      • ChartExpo for Microsoft Excel
    • Power BI Charts

      • Power BI Custom Visuals by ChartExpo
    • Word Cloud

  • Charts dropdown img
    • Chart Category

      • Bar Charts
      • Circle Graphs
      • Column Charts
      • Combo Charts
      • Comparison Charts
      • Line Graphs
      • PPC Charts
      • Sentiment Analysis Charts
      • Survey Charts
    • Chart Type

      • Box and Whisker Plot
      • Clustered Bar Chart
      • Clustered Column Chart
      • Comparison Bar Chart
      • Control Chart
      • CSAT Survey Bar Chart
      • CSAT Survey Chart
      • Dot Plot Chart
      • Double Bar Graph
      • Funnel Chart
      • Gauge Chart
      • Likert Scale Chart
      • Matrix Chart
      • Multi Axis Line Chart
      • Overlapping Bar Chart
      • Pareto Chart
      • Radar Chart
      • Radial Bar Chart
      • Sankey Diagram
      • Scatter Plot Chart
      • Slope Chart
      • Sunburst Chart
      • Tornado Chart
      • Waterfall Chart
      • Word Cloud
    • Google Sheets
      Microsoft Excel
  • Services
  • Pricing
  • Contact us
  • Blog
  • Support dropdown img
      • Gallery
      • Videos
      • Contact us
      • FAQs
      • Resources
    • Please feel free to contact us

      atsupport@chartexpo.com

Categories
All Data Visualizations Data Analytics Surveys
Add-ons/
  • Google Sheets
  • Microsoft Excel
  • Power BI
All Data Visualizations Data Analytics Surveys
Add-ons
  • Google Sheets
  • Microsoft Excel
  • Power BI

We use cookies

This website uses cookies to provide better user experience and user's session management.
By continuing visiting this website you consent the use of these cookies.

Ok

ChartExpo Survey


Home > Blog > Data Analytics

No. of Days Between Two Dates: Calculator & Insights

Are you curious about the number of days between two dates and why it’s crucial?

Let’s assume you had a marketing campaign from May 15th to September 30th. Your manager asks you to calculate the exact number of days the campaign lasted. Also, you are to analyze how it affected the overall sales volume. Understanding the number of days between two dates becomes your secret weapon.

No of Days Between Two Dates

The No of days between two dates may seem insignificant at first glance. However, this small piece of information holds immense power in data analysis. It is not just a number; it is an insight. It’s about possibilities for making informed decisions and taking targeted actions.

Today, we’ll learn how to calculate the number of days difference between two dates using DAX DATEDIFF.

What is this DAX DATEDIFF? And what will learning about it give you? DAX DATEDIFF is a function in Power BI that calculates the duration between two dates in days. If you work with date-based data, this function will benefit you.

It doesn’t matter whether you are an intermediate or a beginner Power BI user. You will learn something that will significantly impact your data analysis skills.

So, buckle up and get ready to level up your date calculations with DAX DATEDIFF.

Table of Contents:

  1. What is No of Days Between Two Dates in DAX?
  2. Why is Calculating The Number of Days Between 2 Dates Important?
  3. What is the Purpose of the Day Counter Between Dates?
  4. How Many Days Between Dates?
  5. Formula to Calculate No of Days Between Dates
  6. Calculator: How to calculate No of Days Between two Dates?
    • Step 1: Locate the Calculator
    • Step 2: Enter the First Date
    • Step 3: Enter the Second Date
    • Step 4: Calculate the Difference
    • Step 5: View the Result
  7. Approximate Number of Days Calculators
  8. Function for Finding the Number of Days Between Two Dates In Power BI
  9. How Do You Count the Number of Days Between Two Dates in Power BI?
  10. Example Calculation For Number of Days Between Two Dates in Power BI
  11. Use Cases For Days Between Dates
  12. How to Visualize the Number of Days Between 2 Dates in Power BI?
  13. Challenges for Calculating the Number of Working Days Between Two Dates
  14. Tips for Calculating No Days Between Two Dates
  15. Advantages of  Finding Duration Between Two Dates
  16. Disadvantages of Calculating the Difference Between Two Dates
  17. No of Days Between Two Dates – FAQs
  18. Wrap Up

First…

What is No of Days Between Two Dates in DAX?

Definition: In DAX (Data Analysis Expressions), “Number of Days Between Two Dates” refers to a calculation that determines the total number of days between two specified dates.

This can be useful for analyzing the time difference between events, such as calculating the duration of a project or the age of a product. The formula typically uses the DATEDIFF() function to return the number of days between two date fields or constants.

To calculate the day’s difference between two dates, use the syntax:

DaysBetweenDates = DATEDIFF(‘Table'[StartDate], ‘Table'[EndDate], DAY)

Where:

  • ‘Table'[StartDate] is the column containing the start dates.
  • ‘Table'[EndDate] is the column containing the end dates.
  • DAY specifies that you want the result in days.

The function returns the number of days between the two dates as an integer value.

For example, DATEDIFF(‘2022-01-01’, ‘2022-01-10’, DAY) would return 9, as there are 9 days between January 1st and January 10th.

This calculation is useful in various scenarios, such as analyzing time durations or calculating data aging. Or when determining the length of intervals between events. DAX DATEDIFF will help you efficiently use Power Query days between two dates and other DAX-supported platforms.

Why is Calculating the Number of Days Between 2 Dates Important?

Calculating the number of days difference between two dates holds significant importance across various data analysis and reporting tasks. Here’s why it’s essential:

  • Time-based analysis: The ability to determine the duration between two dates enables time-based analysis. It allows you to analyze trends, patterns, and performance over specific periods. This analysis is crucial for identifying seasonality, trends, and cycles in data.
  • Date-based filtering and slicing: Calculating the days between dates enables date-based filtering and data slicing. You can filter out and analyze data only for a given number of days. This capability significantly improves data exploration and visualization.
  • Calculating durations: Understanding the duration between two dates is essential. Why? It has various applications, such as calculating project durations, lead times, or turnaround times. It helps measure performance, set benchmarks, and improve efficiency in processes and operations.
  • Forecasting and planning: Days between dates play a crucial role in forecasting and planning activities. It allows you to project future trends, anticipate resource needs, and develop strategic initiatives. Accurate date calculations are essential for developing realistic forecasts and effective planning strategies.
  • Data integration and transformation: Calculating durations between dates is essential in data integration and transformation processes. It facilitates Dataset harmonization, aligns data from different sources, and performs time-based aggregations. It also ensures data consistency and accuracy in analytical and reporting tasks.
  • Compliance and regulatory reporting: Many regulations and compliance requirements require reporting based on certain periods. Calculating the days between dates ensures that you meet all the report deadlines and regulatory and compliance requirements.

What is the Purpose of the Day Counter Between Dates?

The day counter between dates is used to calculate the exact number of days between two specified dates. It helps individuals and businesses manage time-sensitive tasks efficiently.

  • Project Planning

Helps in tracking deadlines, schedules, and time remaining for tasks. Ensures that projects stay on track and are completed within the planned timeframe. Additionally, it aids in resource allocation, task prioritization, and avoiding last-minute delays.

  • Age & Tenure Calculation

Determines age, work anniversaries, or the duration of employment. Useful for HR professionals to track employee milestones and benefits eligibility. Also helps in pension planning, retirement eligibility, and recognizing employee contributions over time.

  • Financial Calculations

Used in interest computations, loan durations, and billing cycles. Essential for banks, lenders, and businesses managing payments and financial obligations. It ensures accurate financial forecasting, repayment tracking, and penalty avoidance for overdue payments.

  • Event Management

Counts down the days to an event, meeting, or milestone. Helps in organizing and preparing for personal and professional events effectively. Whether for weddings, conferences, or product launches, it ensures better coordination and timely execution.

  • Legal & Compliance

Ensures deadlines for contracts, policies, or court filings are met. Prevents legal issues by keeping track of important legal and regulatory timeframes. It helps businesses and individuals avoid fines, penalties, or contract breaches due to missed deadlines.

How Many Days Between Dates?

To calculate the How many days between dates, you can use the following methods:

  • Manual Calculation: Subtract the earlier date from the later date. For example, if the dates are January 10, 2025, and January 27, 2025, the calculation is:
  • Using Excel/Spreadsheet And Power BI:
    • In Excel, you can directly subtract one date from another. For example, if A1 contains 01/10/2025 and B1 contains 01/27/2025, the formula would be: =B1 – A1
    • You can use DAX (Data Analysis Expressions) to calculate the difference between two dates. For example, if you have a column StartDate and EndDate in your data, you can create a new column with the following DAX formula:

                                    = DaysBetween = DATEDIFF(‘Table'[StartDate], ‘Table'[EndDate], DAY)

  • Using Python: You can use Python’s datetime module to calculate the days between 2 dates:
  • Using a Date Difference Calculator: Many online tools allow you to simply input two dates, and they will calculate the difference between two dates.

Formula to Calculate No of Days Between Dates

In Power BI, you can use this Formula to calculate the number of days between dates:

DAX

Days_Difference = DATEDIFF(Start_Date, End_Date, DAY)
This formula returns the number of days between Start_Date and End_Date in your dataset.

Calculator: How to calculate No of Days Between two Dates?

Here is the method to calculate no of days between two dates:

Step 1: Locate the Calculator

Open the Days Between Dates Calculator. You can find many online versions or use a specific one if available.

Step 2: Enter the First Date

Look for a field labeled “Start Date” or “From Date.”
Enter the earlier date (e.g., January 10, 2025).

Step 3: Enter the Second Date

Find the field labeled “End Date” or “To Date.”
Enter the later date (e.g., January 27, 2025).

Step 4: Calculate the Difference

After entering both dates, click the button to calculate the difference (often labeled “Calculate” or “Submit”).

Step 5: View the Result

The calculator will display the number of days between the two dates.
For example, the difference between January 10, 2025, and January 27, 2025, is 17 days.

Approximate Number of Days Calculators

Here are some approximate number of days calculators:

  • Power BI (DAX Formula)

In Power BI, you can use DAX (Data Analysis Expressions) to calculate the difference between two dates.

DAX Formula:  DaysDifference = DATEDIFF(‘Table'[Start Date], ‘Table'[End Date], DAY)

    • Replace ‘Table'[Start Date] and ‘Table'[End Date] with your actual column names.
    • This will return the number of days between the two dates.
  • Excel (Formula Approach)

In Excel, you can simply subtract the two dates:

  Basic Formula = EndDate – StartDate

Function for Finding the Number of Days Between Two Dates In Power BI

  • Open Power BI Desktop and load your dataset.
  • Add a New Column (optional):
    • If you want to create a new column in your table that calculates the days between two date columns, go to the Data view.
    • Click on Modeling > New Column.
  • Write the DAX Formula:
    • You can use the DATEDIFF function. The syntax is: = DaysBetween = DATEDIFF(‘Table'[StartDate], ‘Table'[EndDate], DAY)
    • ‘Table’ is the name of your table.
    • [StartDate] and [EndDate] are the names of the data columns you want to use.
    • DAY specifies that you want the result in days.
  • Press Enter:
    • After entering the formula, press Enter to create the column. Power Query days between two dates for each pair of dates.
  • View the Result:
    • The new column will appear in your table, showing the number of days between the dates for each row.

How Do You Count the Number of Days Between Two Dates in Power BI?

Counting the or calculator days between 2 dates is common in Power BI for various analytical and reporting purposes. Here’s a step-by-step guide on how to achieve this:

  1. Open your Power BI Desktop application and go to the data model view.
  2. Click on “New Table” in the modeling tab to create a new calculated table.
  3. In the formula bar, enter the following DAX formula:

DaysBetweenDates = DATEDIFF(‘Table'[StartDate], ‘Table'[EndDate], DAY)

  1. Replace ‘Table'[StartDate] and ‘Table'[EndDate] with the actual column names in your dataset containing the start and end dates, respectively.
  2. Click Enter to apply the formula. Power BI will create a new table with a column named DaysBetweenDates. This table will contain the number of days between the start and end dates for each row in your dataset.
  3. You can then use this new column in your Power BI reports for analysis, visualization, or further calculations.

Example Calculation For Number of Days Between Two Dates in Power BI

Examples of calculating duration between two dates in PBI?

In Power Query, you have the option to utilize either the Custom Column feature. Or the Advanced Editor to compute the disparity between two dates.

Using Add Columns

Adding Columns for No of Days Between Two Dates

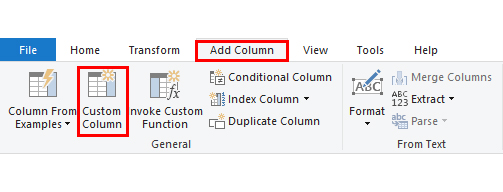
The Add Column feature in Power Query offers numerous functionalities for generating additional columns. When determining the difference between two dates, the Custom Column feature stands out as the preferred tool. It can compute the difference and allocate the resulting values to a new column, making it highly suitable for this task.

Here is an advantage of employing the Custom Column command: You can effortlessly compute the date difference while simultaneously establishing a dedicated column to house the computed values. This streamlined method eliminates the necessity for multiple steps and simplifies the entire procedure.

Custom Columns Formula for No of Days Between Two Dates

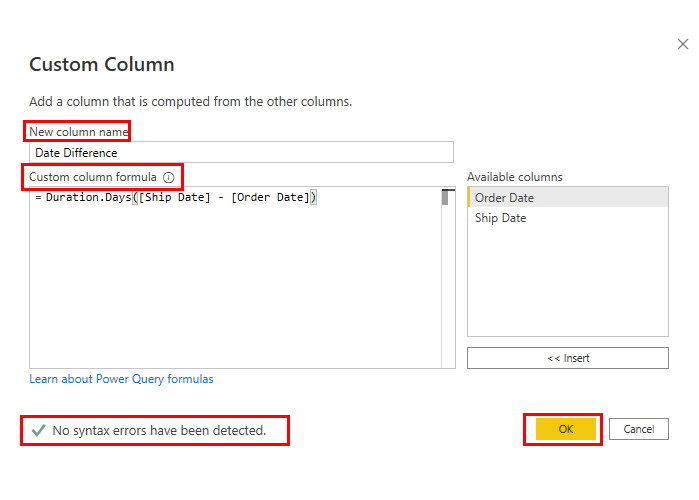
Duration.Days([Ship Date] – [Order Date])

When you click on Custom Column, a dialogue box labeled Custom Column opens up. Inside this dialogue box, you’ll see a formula box where you can copy and paste the provided syntax.

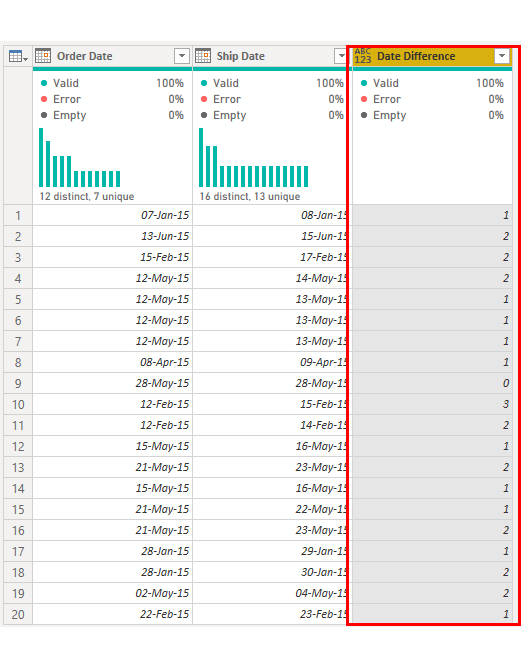
The syntax uses the Duration.Days M function to calculate the number of days between the Ship Date and Order Date for each row.

At the bottom left of the window, you’ll notice the statement “No syntax errors have been detected”. This statement acts as a helpful indicator to confirm the accuracy of your formula, ensuring there are no errors present.

After verifying and ensuring everything is correct, proceed by clicking the OK button.

Date Difference for No of Days Between Two Dates

Calculate the DAX days between two dates

The first step in creating a calculated column is importing your data into Power BI. This ensures that the required dataset is readily accessible for your computations.

DAX Window for No of Days Between Two Dates

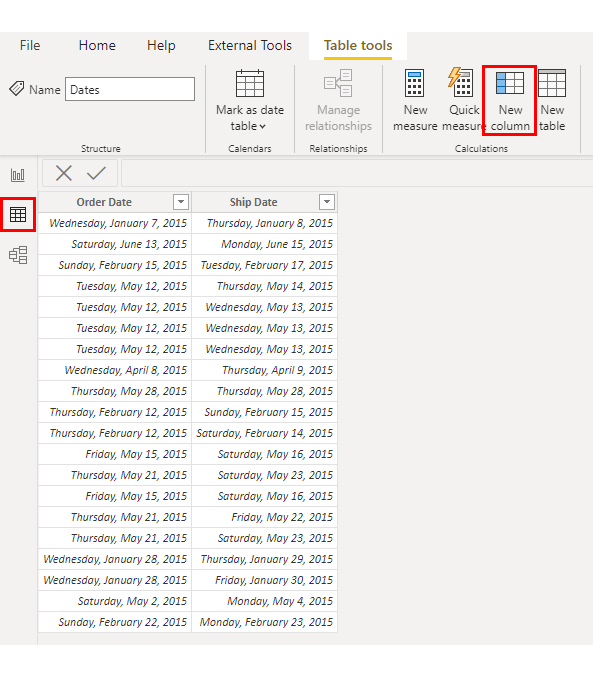
Following data importation, navigate to the table view by clicking on the grid icon. Then, access the Table tools tab and select “New column.”

New Column for No of Days Between Two Dates

Use Cases For Days Between Dates

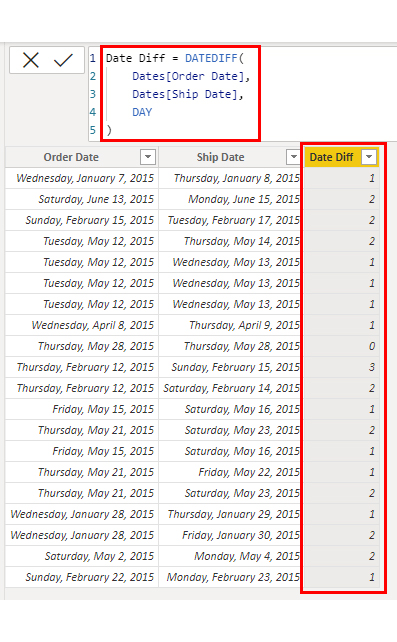
Here are five examples of the number of days between two dates:

  1. January 1, 2024 – March 15, 2024 → 74 days
  2. April 10, 2023 – October 25, 2023 → 198 days
  3. July 4, 2022 – December 31, 2022 → 180 days
  4. May 20, 2021 – August 10, 2021 → 82 days
  5. September 5, 2020 – February 15, 2021 → 163 days

How to Visualize the Number of Days Between 2 Dates in Power BI?

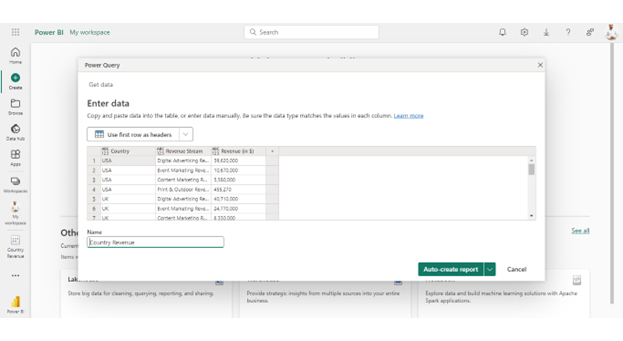
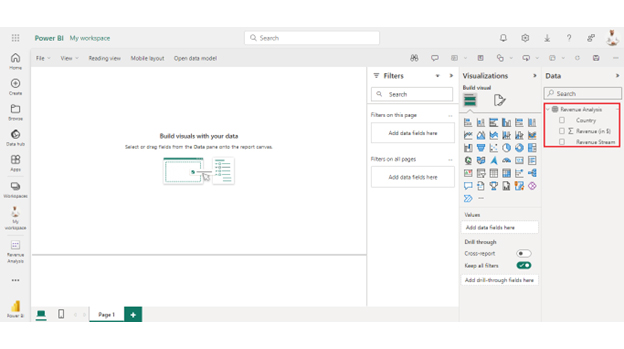
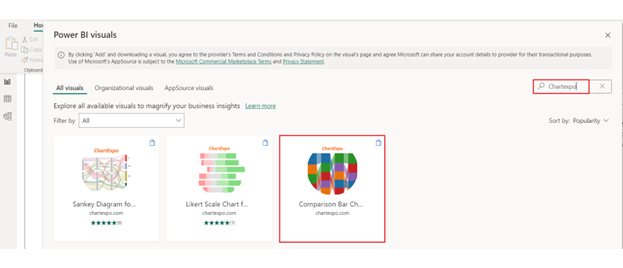
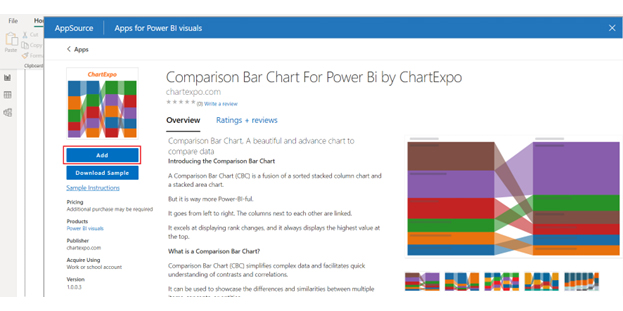
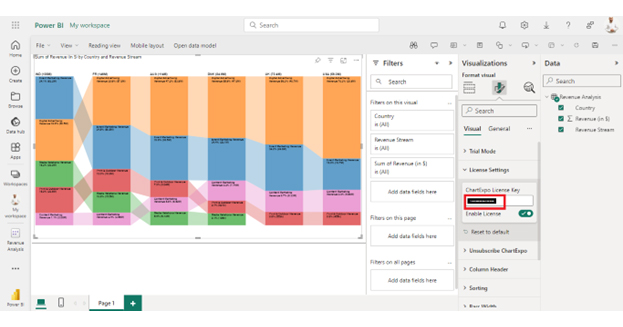
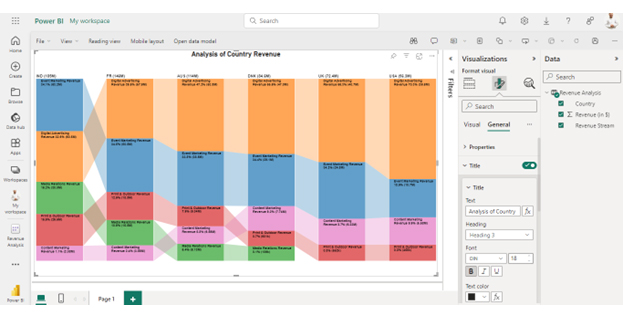
We’ve learned how to count the days between 2 dates using DAX DATEDIFF. Now, let’s learn how to visualize Power BI days between two dates.

Stage 1: Logging in to Power BI

  • Log in to Power BI.
  • Enter your email address and click the “Submit” button.
Enter email to login to Power BI
  • You are redirected to your Microsoft account.
  • Enter your password and click “Sign in“.
Enter Password to login to Power BI
  • You can choose whether to stay signed in.
Click on stay signed in
  • Once done, the Power BI home screen will open.

Stage 2: Creating a Data Set and Selecting the Data Set to Use in Your Chart

  • Go to the left-side menu and click the “Create” button.
  • Select “Paste or manually enter data“.
select Paste or manually enter data in Power BI ce487
  • We’ll use the sample data below for this example.
Country Revenue Stream Revenue  (in $)
USA Digital Advertising Revenue           39,620,000
USA Event Marketing Revenue           10,670,000
USA Content Marketing Revenue             5,580,000
USA Print & Outdoor Revenue                 455,270
UK Digital Advertising Revenue           40,710,000
UK Event Marketing Revenue           24,770,000
UK Content Marketing Revenue             6,330,000
UK Print & Outdoor Revenue                 552,190
DNK Digital Advertising Revenue           47,040,000
DNK Event Marketing Revenue           29,070,000
DNK Content Marketing Revenue             7,740,000
DNK Print & Outdoor Revenue                 600,690
DNK Media Relations Revenue                 106,430
AUS Digital Advertising Revenue           53,790,000
AUS Event Marketing Revenue           38,530,000
AUS Content Marketing Revenue             6,590,000
AUS Print & Outdoor Revenue             9,040,000
AUS Media Relations Revenue             6,130,000
FR Digital Advertising Revenue           57,860,000
FR Event Marketing Revenue           50,450,000
FR Content Marketing Revenue             3,560,000
FR Print & Outdoor Revenue           18,790,000
FR Media Relations Revenue           15,460,000
IND Digital Advertising Revenue           60,470,000
IND Event Marketing Revenue           63,200,000
IND Content Marketing Revenue             2,080,000
IND Print & Outdoor Revenue           29,500,000
IND Media Relations Revenue           30,020,000
  • Paste the above data table in the Power Query Window.
  • Select the “Create a dataset only” option.
Click Create a Data Set Only for No of Days Between Two Dates
  • On the left-side menu, click “Data Hub“.
  • Power BI populates the data set list. (If you have not created a data set, refer to the Error! Reference source not found section).
  • Click on the “Create a report” drop-down.
Create a Report for No of Days Between Two Dates
  • Click the “Expand All” button.
  • You can see your chart metrics:
Expand All for No of Days Between Two Dates
  • Click on “Get more visuals“.
  • Search for ChartExpo and select the Comparison Bar Chart:
Get More Visuals for No of Days Between Two Dates
  • Click the “Add” button.
Click Add Button for No of Days Between Two Dates
  • You can now see the Comparison Bar Chart in the visualizations list.
Comparison Bar Chart Icon for No of Days Between Two Dates
  • In Visual, click License Settings, add the key, and enable the license.
  • After adding the key, you can see the comparison bar chart.
Add License Key for No of Days Between Two Dates
  • The final Comparison Bar Chart in Power BI will appear as below.
Final No of Days Between Two Dates

Insights

  • India tops in total revenue, followed closely by France, Australia, and Denmark.
  • In most countries, “Digital Advertising” is a significant revenue contributor, but in India, “Event Marketing” leads.
  • “Media Relations” is missing in the US and UK.
  • France has less revenue from content marketing compared to other streams, while India has the lowest despite high overall revenue.

Challenges for Calculating the Number of Working Days Between Two Dates

The following challenges occur when we find out the Number of working days between two dates:

  • Public Holidays

Different countries and regions have unique public holidays, making it difficult to account for non-working days accurately.

  • Weekend Variations

While many countries consider Saturday and Sunday as weekends, others, like some Middle Eastern nations, observe Friday and Saturday as rest days.

  • Special Leave and Company Holidays

Organizations may have additional leave days, such as company-wide holidays or special events, affecting the actual number of working days.

  • Leap Years

Leap years add an extra day in February, which can impact date calculations if not accounted for properly.

Tips for Calculating No Days Between Two Dates

  1. Use a Reliable Calculator: Always use a trusted online tool or built-in functions in Excel, Power BI, or programming languages like DAX and SQL.
  2. Consider Weekends and Holidays: If calculating business days, exclude weekends and public holidays for accuracy.
  3. Account for Time Zones: If working with international dates, consider time differences to avoid miscalculations.
  4. Check for Leap Years: Leap years add an extra day in February, which can impact long-term date calculations.
  5. Use the Right Format: Ensure dates are in the correct format (YYYY-MM-DD or MM/DD/YYYY) to prevent errors.

Advantages of  Finding Duration Between Two Dates

  1. Project Management: Helps determine timelines, deadlines, and durations between milestones to keep a project on track.
  2. Financial Calculations: Essential for calculating interest, loan terms, or investment durations, ensuring accuracy in financial reports.
  3. Event Planning: Useful for tracking the time left until events, conferences, or other important deadlines.
  4. Personal Planning: Helps individuals track anniversaries, birthdays, and important milestones.
  5. Workplace Efficiency: Assists in tracking employee leaves, attendance, or the time taken for specific tasks to improve productivity.
  6. Legal and Contractual Purposes: Determines the duration of agreements, terms, or conditions that are bound by specific dates.
  7. Data Analysis: Used in statistics to measure durations between data points or trends, helping to conclude temporal patterns.

Disadvantages of Calculating the Difference Between Two Dates

  1. Does Not Consider Working Days: Simple date difference calculations include weekends and holidays, making them inaccurate for business or work-related planning.
  2. Ignores Time Differences: Date calculations do not factor in time zones, which can lead to scheduling conflicts in international operations.
  3. Cannot Factor in Special Holidays or Leaves: Public holidays, company-specific leaves, or unexpected office closures are not automatically considered, leading to miscalculations.
  4. Limited for Precise Duration Tracking: Basic date difference calculations do not account for partial days or hours, making them unsuitable for time-sensitive scheduling.
  5. Challenges with Leap Years: Leap years add an extra day in February, which can impact long-term date calculations if not accounted for properly.

No of Days Between Two Dates – FAQs

How does DAX return the number of days between two dates?

DAX returns the number of days between two dates using the DATEDIFF function. This function calculates the difference in days between the start and end dates specified. It gives the result as an integer value.

Is there a way to calculate the number of days between two dates?

Yes, you can calculate the number of days between two dates using the DATEDIFF function in DAX. This function computes the difference in days between two date columns or date values.

How do you count the number of months between two dates in Power BI?

Use the DATEDIFF function with the “month” interval parameter. This calculates the difference in months between the two dates and returns the result as an integer value.

Wrap Up

Calculating the duration between two dates holds significant importance in various contexts and industries. First, it allows for precise time-based analysis, enabling you to track trends, patterns, and performance over specific durations. This analysis aids in identifying seasonality, trends, and cycles in data, facilitating informed decision-making.

Second, it is critical for filtering and slicing data based on the date. Such data selection and analysis allow you to discover trends and anomalies by thoroughly examining the data from those periods. This culminates in more reliable reports and decisions.

Moreover, calculating durations between dates is crucial for various applications, such as project management and lead time analysis. It helps measure performance, set benchmarks, and improve efficiency in processes and operations. Ultimately, this enhances overall productivity and effectiveness.

Furthermore, accurate date calculations are indispensable for forecasting and planning activities. Forecasting future trends and anticipating resource needs based on historical data helps to develop strategic initiatives. Thus, you can allocate resources more effectively to ensure improved performance and competitiveness.

Lastly, calculating the number of days between dates ensures accurate adherence to reporting deadlines and regulatory requirements. Meeting reporting obligations promptly and accurately helps to maintain regulatory compliance, avoid penalties, and uphold brand reputation and integrity.

In conclusion, the importance of calculating days difference between two dates cannot be overstated. It facilitates time-based analysis, data filtering, performance measurement, forecasting, planning, and regulatory compliance.

Start leveraging accurate date calculations to gain insights, make informed decisions, and drive sustainable growth and success.

How much did you enjoy this article?

PBIAd1
Start Free Trial!
135219

Related articles

next previous
Data Analytics10 min read

Supplier Comparison Template: Download It Now

A supplier comparison template streamlines vendor evaluation by comparing cost and quality. Click here to learn its benefits and how to analyze them.

Data Analytics32 min read

Ecommerce Analytics: How to Fix What It Often Gets Wrong

Ecommerce analytics often lead to mixed signals and costly misreads. Fix attribution gaps, align teams, and act on the right data. Get started now!

Data Analytics30 min read

When Sales Funnel Breaks: Failures, Fixes, & Funnel Debt

Is your sales funnel hiding costly gaps? Learn how pipeline stalls, false metrics, and handoff chaos could be draining revenue. Get started now!

Data Analytics9 min read

Procurement Key Performance Indicators for Quick Insights

Procurement Key Performance Indicators track costs, efficiency, and supplier reliability. Learn to use these KPIs effectively, their importance, and examples.

Data Analytics29 min read

Correlation Analysis: Don’t Worship Correlation, Question It.

Correlation analysis helps spot patterns, avoid costly mistakes, and guide decisions with data that matters. Want smarter strategy? Get started now!

ChartExpo logo

Turn Data into Visual
Stories

CHARTEXPO

  • Home
  • Gallery
  • Videos
  • Services
  • Pricing
  • Contact us
  • FAQs
  • Privacy policy
  • Terms of Service
  • Sitemap

TOOLS

  • ChartExpo for Google Sheets
  • ChartExpo for Microsoft Excel
  • Power BI Custom Visuals by ChartExpo
  • Word Cloud

CATEGORIES

  • Bar Charts
  • Circle Graphs
  • Column Charts
  • Combo Charts
  • Comparison Charts
  • Line Graphs
  • PPC Charts
  • Sentiment Analysis Charts
  • Survey Charts

TOP CHARTS

  • Sankey Diagram
  • Likert Scale Chart
  • Comparison Bar Chart
  • Pareto Chart
  • Funnel Chart
  • Gauge Chart
  • Radar Chart
  • Radial Bar Chart
  • Sunburst Chart
  • see more
  • Scatter Plot Chart
  • CSAT Survey Bar Chart
  • CSAT Survey Chart
  • Dot Plot Chart
  • Double Bar Graph
  • Matrix Chart
  • Multi Axis Line Chart
  • Overlapping Bar Chart
  • Control Chart
  • Slope Chart
  • Clustered Bar Chart
  • Clustered Column Chart
  • Box and Whisker Plot
  • Tornado Chart
  • Waterfall Chart
  • Word Cloud
  • see less

RESOURCES

  • Blog
  • Resources
  • YouTube
SIGN UP FOR UPDATES

We wouldn't dream of spamming you or selling your info.

© 2025 ChartExpo, all rights reserved.