• Home
  • Tools dropdown img
    • Spreadsheet Charts

      • ChartExpo for Google Sheets
      • ChartExpo for Microsoft Excel
    • Power BI Charts

      • Power BI Custom Visuals by ChartExpo
    • Word Cloud

  • Charts dropdown img
    • Chart Category

      • Bar Charts
      • Circle Graphs
      • Column Charts
      • Combo Charts
      • Comparison Charts
      • Line Graphs
      • PPC Charts
      • Sentiment Analysis Charts
      • Survey Charts
    • Chart Type

      • Box and Whisker Plot
      • Clustered Bar Chart
      • Clustered Column Chart
      • Comparison Bar Chart
      • Control Chart
      • CSAT Survey Bar Chart
      • CSAT Survey Chart
      • Dot Plot Chart
      • Double Bar Graph
      • Funnel Chart
      • Gauge Chart
      • Likert Scale Chart
      • Matrix Chart
      • Multi Axis Line Chart
      • Overlapping Bar Chart
      • Pareto Chart
      • Radar Chart
      • Radial Bar Chart
      • Sankey Diagram
      • Scatter Plot Chart
      • Slope Chart
      • Sunburst Chart
      • Tornado Chart
      • Waterfall Chart
      • Word Cloud
    • Google Sheets
      Microsoft Excel
  • Services
  • Pricing
  • Contact us
  • Blog
  • Support dropdown img
      • Gallery
      • Videos
      • Contact us
      • FAQs
      • Resources
    • Please feel free to contact us

      atsupport@chartexpo.com

Categories
All Data Visualizations Data Analytics Surveys
Add-ons/
  • Google Sheets
  • Microsoft Excel
  • Power BI
All Data Visualizations Data Analytics Surveys
Add-ons
  • Google Sheets
  • Microsoft Excel
  • Power BI

We use cookies

This website uses cookies to provide better user experience and user's session management.
By continuing visiting this website you consent the use of these cookies.

Ok

ChartExpo Survey


Home > Blog > Microsoft Excel

KPIs for Manufacturing Industry: Top 15 Metrics & Insights

Key Performance Indicators (KPIs) for manufacturing industry are fundamental in evaluating and optimizing operational performance.

They offer insights into various facets of manufacturing operations, including production efficiency, quality control, and supply chain management. Leveraging the right KPIs can bolster productivity, reduce costs, and uphold rigorous product quality standards.

KPIs for Manufacturing Industry

The manufacturing industry is the linchpin of global economic activity. The sector contributes 16% of the global GDP, highlighting its pivotal role in the world economy.

Manufacturing has been a driving force behind technological progress and societal advancement. It has shaped the fabric of human civilization through pivotal eras such as the Industrial Revolution.

Metrics such as cycle time and first-pass yield are instrumental in gauging operational efficiency and identifying improvement areas. Additionally, manufacturing KPIs related to inventory turnover and customer satisfaction are indispensable for ensuring customer-centric manufacturing processes.

This blog post delves into the pivotal Key Performance Indicators (KPIs) for manufacturing industry. We’ll explore how they drive performance, foster continuous improvement, and propel businesses toward sustainable growth.

Table of Content:

  1. What are Key Performance Indicators for Manufacturing Industry?
  2. What are the Advantages of Manufacturing KPIs?
  3. How to Track Your Manufacturing KPIs?
  4. How to Visualize KPIs for the Manufacturing Industry?
  5. Wrap Up

Let’s get started.

What are Key Performance Indicators for Manufacturing Industry?

Definition: Key Performance Indicators for Manufacturing Industry are metrics that quantitatively measure the performance of processes, operations, and overall business activities. These indicators are crucial for assessing manufacturing operations’ efficiency, effectiveness, and overall health.

KPIs for Manufacturing Industry provide valuable insights into key areas such as production efficiency, product quality, and supply chain management. They serve as benchmarks to evaluate and improve processes, identify bottlenecks, and enhance productivity.

Effective KPIs contribute to better decision-making, allowing management to allocate resources strategically and optimize operational performance.

Key Performance Indicators for Manufacturing Industry examples include:

  • Overall Equipment Effectiveness (OEE): Measures equipment utilization efficiency by considering availability, performance, and quality. These key Performance Indicators for the Manufacturing Industry aid in identifying and addressing production inefficiencies.
  • Cycle Time: Evaluates the time taken to complete a specific manufacturing process, influencing production speed and responsiveness to market demands.
  • Quality Yield: Tracks the proportion of defect-free products, ensuring adherence to quality standards and minimizing rework or scrap costs.
  • Downtime: Measures the time production equipment is idle, helping identify and address operational continuity issues.
  • Inventory Turnover: Assesses how quickly inventory is used and replenished, impacting working capital and indicating production efficiency.
  • Lead Time: Evaluates the time taken from order placement to product delivery, influencing customer satisfaction and order fulfillment efficiency.
  • Scrap and Rework Rates: Monitors the percentage of defective products and the costs associated with reworking/scrapping items, guiding quality control efforts.
  • Capacity Utilization: Measures the extent to which a manufacturing facility is used efficiently, indicating resource optimization and potential for increased production.
  • Supplier Performance: Evaluates the effectiveness of suppliers in delivering quality materials on time, influencing the reliability of the supply chain.
  • Energy Consumption: Tracks the amount of energy used in manufacturing processes, guiding efforts to enhance sustainability and reduce operational costs.
  • Employee Productivity: Assesses labor efficiency in production, impacting overall operational efficiency and labor cost management.
  • On-Time Delivery: Measures the punctuality of delivering finished goods to customers, influencing customer satisfaction and loyalty.
  • Cost per Unit: Evaluates the average cost incurred to produce a single unit, influencing pricing strategies and overall profitability.
  • Maintenance Costs: Tracks expenses associated with equipment maintenance, aiding in budgeting and optimizing maintenance schedules.
  • Health and Safety Metrics: Monitors indicators related to workplace safety, ensuring compliance with regulations and fostering a secure working environment.

What are the Advantages of Manufacturing KPIs?

Manufacturing Key Performance Indicators (KPIs) play a pivotal role in enhancing the efficiency and effectiveness of manufacturing operations. Their advantages extend across various facets of the manufacturing process, contributing to the success and sustainability of businesses.

  • Performance Monitoring

KPIs enable real-time monitoring of key performance metrics for manufacturing industry, providing a comprehensive view of operational health. This continuous oversight facilitates timely intervention and corrective actions, ensuring production stays on course.

  • Efficiency Improvement

KPIs help identify areas for improvement by quantifying the performance of processes and equipment. Insights from metrics like cycle time allow you to optimize operational efficiency, reduce downtime, and enhance productivity.

  • Quality Assurance

Key Performance Indicators for Manufacturing Industry related to quality yield, scrap, and rework rates contribute to robust quality assurance. They empower you to maintain high standards, reduce defects, and meet or exceed customer expectations. This, as a result, fosters brand reputation and customer loyalty.

  • Cost Reduction

Efficiently managed manufacturing processes, guided by KPIs, lead to cost reduction. Monitoring metrics like cost per unit, inventory turnover, and maintenance costs enables you to identify inefficiencies. Then, implement cost-saving measures.

  • Strategic Decision-Making

KPIs for manufacturing industry provide valuable data for strategic decision-making. Aligning operational performance with organizational goals helps you make informed decisions on resource allocation, capacity planning, and technology investments. Consequently, this ensures long-term success.

  • Supply Chain Optimization

KPIs related to supplier performance, lead time, and inventory turnover contribute to a streamlined supply chain. You can optimize your supplier relationships, reduce lead times, and maintain efficient inventory levels. This will help you minimize disruptions and improve overall supply chain resilience.

  • Customer Satisfaction

Key Performance Indicators for Manufacturing Industry like on-time delivery and quality yield directly impact customer satisfaction. Meeting delivery commitments and providing high-quality products result in satisfied customers, which is critical for retention and positive word-of-mouth.

  • Risk Mitigation

Monitoring key performance metrics for manufacturing allows you to identify and address potential risks proactively. Whether related to equipment failures, supply chain disruptions, or quality issues, KPIs help mitigate risks before they escalate.

  • Continuous Improvement Culture

Key Performance Indicators for Manufacturing Industry foster a culture of continuous improvement. Regularly assessing and striving to exceed performance benchmarks helps create an improved environment. An environment where innovation, efficiency gains, and excellence become ingrained in the organizational culture.

  • Regulatory Compliance

This involves consistent monitoring of metrics related to health and safety, environmental impact, and other regulatory requirements. As a result, you can avoid legal issues and uphold ethical business practices.

How to Track Your Manufacturing KPIs?

Effective tracking of key performance indicators for the manufacturing industry is essential for optimizing operations and achieving strategic objectives. Implementing a robust tracking system involves a systematic approach to ensure accurate data collection, analysis, and informed decision-making.

  1. Define clear objectives: Define clear and specific objectives aligned with the overall business goals. Articulated objectives provide a framework for selecting relevant KPIs directly contributing to organizational success.
  2. Select appropriate KPIs: Choose KPIs directly reflecting the performance aspects critical to achieving the defined objectives. Consider metrics related to efficiency, quality, cost, and customer satisfaction. Also, ensure they are measurable and align with the company’s strategic priorities.
  3. Establish baselines: Establish baseline measurements for selected key performance indicators for the manufacturing industry to provide a reference point for performance evaluation. Baselines offer a starting point for improvement initiatives and help gauge the effectiveness of implemented changes.
  4. Implement data collection systems: Utilize data collection systems, such as IoT sensors, automation technologies, or integrated manufacturing software, to gather real-time, accurate data. Efficient data collection systems streamline the tracking process and reduce the likelihood of errors.
  5. Utilize manufacturing software: Invest in specialized manufacturing software that centralizes KPI tracking, facilitates data analysis, and provides comprehensive dashboards. Manufacturing software enhances the efficiency, accuracy, and accessibility of KPI data, promoting better decision-making.
  6. Ensure data accuracy: Implement rigorous quality control measures to ensure the accuracy and reliability of the collected data. Regularly audit data sources, validate data integrity, and address discrepancies to maintain the credibility of KPI tracking.
  7. Establish reporting mechanisms: Develop a reporting framework that communicates KPI insights clearly and concisely. Establish regular reporting schedules and formats that cater to different stakeholders, fostering transparency and accountability.
  8. Implement continuous monitoring: Adopt a real-time monitoring approach to track KPIs. Automated alerts for deviations from expected values enable proactive responses to address potential issues and prevent negative impacts.
  9. Analyze trends and patterns: Leverage data analytics tools to analyze trends, patterns, and correlations within the tracked KPIs. Identifying recurring patterns facilitates predictive analysis, enabling proactive decision-making to optimize manufacturing processes.
  10. Review and adjust: Regularly review KPI performance against established objectives. Conduct thorough analyses to identify areas for improvement and adjust strategies accordingly. Continuous evaluation allows for agile responses to changing market conditions or internal dynamics.
  11. Promote data-driven culture: Foster a data-driven culture within the organization by emphasizing the importance of KPIs in decision-making. Encourage employees to use data to solve problems, set performance targets, and drive continuous improvement initiatives.
  12. Training and Communication: Provide adequate training to personnel involved in the KPI tracking process. Effective communication ensures that all stakeholders understand the significance of KPIs, their role in achieving organizational objectives, and how their contributions impact overall performance.

How to Visualize KPIs for the Manufacturing Industry?

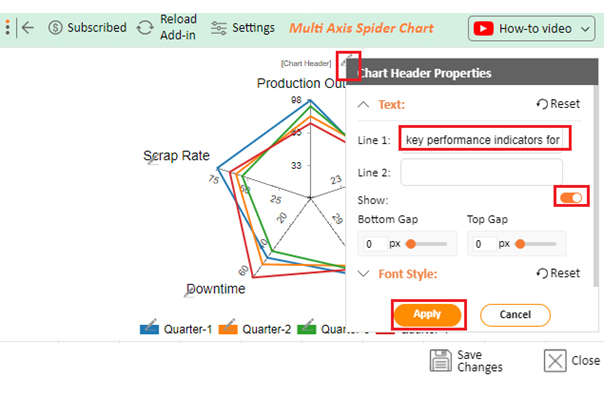
Visualizing key performance indicators (KPIs) is crucial for the manufacturing industry. It enables effective tracking of Metrics and KPIs extraction of valuable insights.

However, Excel’s limitations in data visualization often hinder the comprehensive representation of these critical KPIs. This is where ChartExpo comes into play, offering advanced data visualization capabilities to elevate the visualization of manufacturing KPIs.

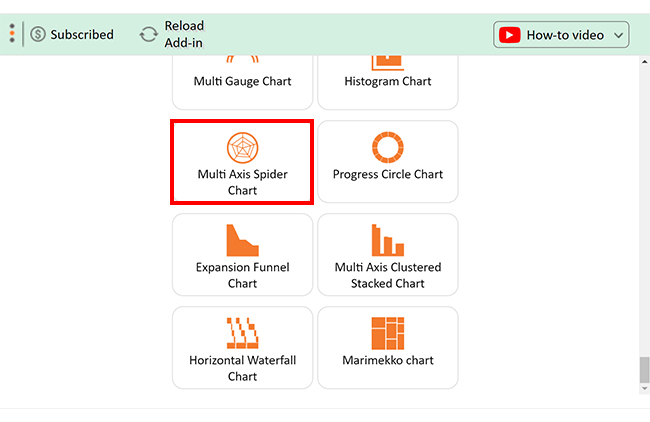
In this guide, we’ll explore how to visualize key performance indicators for the manufacturing industry using ChartExpo.

Let’s learn how to Install ChartExpo in Excel.

  1. Open your Excel application.
  2. Open the worksheet and click the “Insert” menu.
  3. You’ll see the “My Apps” option.
  4. In the office Add-ins window, click “Store” and search for ChartExpo on my Apps Store.
  5. Click the “Add” button to install ChartExpo in your Excel.

ChartExpo charts are available both in Google Sheets and Microsoft Excel. Please use the following CTA’s to install the tool of your choice and create beautiful visualizations in a few clicks in your favorite tool.

Example

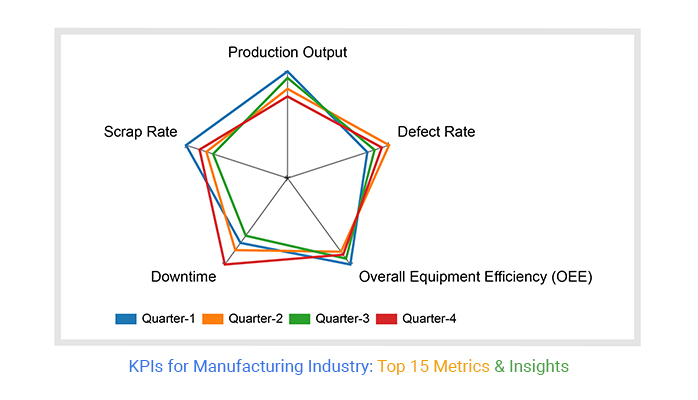
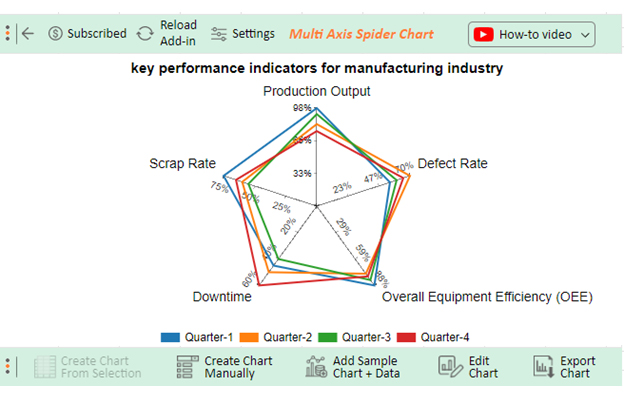
The table below contains sample manufacturing KPIs data.

Quarters Production Output Defect Rate Overall Equipment Efficiency (OEE) Downtime Scrap Rate
Quarter-1 98 55 88 45 75
Quarter-2 82 70 75 50 60
Quarter-3 92 60 82 40 55
Quarter-4 75 65 78 60 65

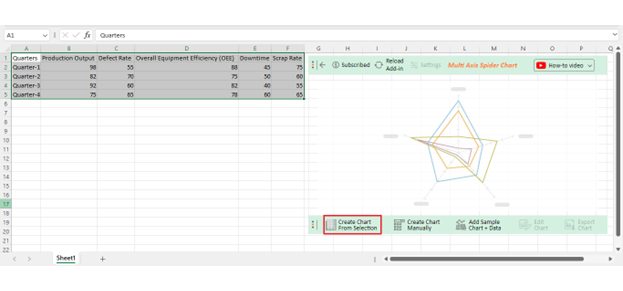
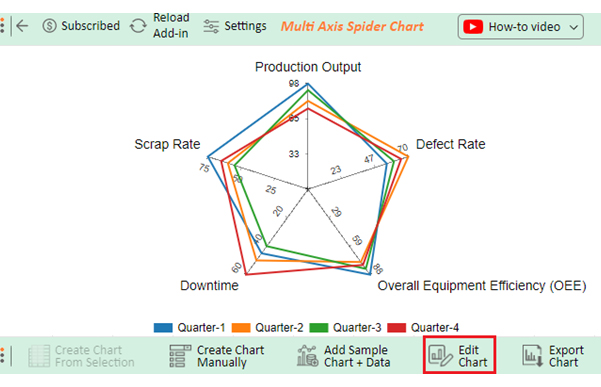
Let’s visualize this data in Excel using ChartExpo and glean valuable insights for informed decision-making.

  • To get started with ChartExpo, install ChartExpo in Excel.
  • Now Click on My Apps from the INSERT menu.
insert chartexpo in excel
  • Choose ChartExpo from My Apps, then click Insert.
open chartexpo in excel
  • Once it loads, scroll through the charts list to locate and choose the “Multi-Axis Spider Chart”.
Search Multi-Axis Spider Chart ce519
  • Click the “Create Chart From Selection” button after selecting the data from the sheet, as shown.
Create Chart From Selection ce519
  • ChartExpo will generate the visualization below for you.
KPIs for Manufacturing Industry Design Template
  • If you want to add anything to the chart, click the Edit Chart button:
  • Click the pencil icon next to the Chart Header to change the title.
  • It will open the properties dialog. Under the Text section, you can add a heading in Line 1 and enable Show.
  • Give the appropriate title of your chart and click the Apply button.
Apply Tittle on Chart ce519
  • Add the percentage sign with all values.
Add the percentage sign Ce519
  • Click the “Save Changes” button to persist the changes made to the chart.
Save Changes ce519
  • Your final Multi Axis Spider Chart will look like the one below.
Final KPIs for Manufacturing Industry

Insights

  • Quarter-1 production and OEE were robust at 98% and 88%, respectively. However, defects and scrap rates were notable at 55% and 75%.
  • Quarter 2 encountered challenges with increased defects at 70% and increased downtime at 50%.
  • Quarter 3 witnessed improved OEE at 82% and reduced scrap at 55%.
  • Quarter 4 saw increased downtime at 60%, impacting overall performance.

FAQs

What are the 5 KPIs for manufacturing?

The key performance indicators (KPIs) for manufacturing include:

  • Overall Equipment Effectiveness (OEE).
  • Cycle Time.
  • Quality Yield.
  • Inventory Turnover.

These metrics assess manufacturing processes’ efficiency, quality, production speed, and resource utilization.

What is the formula for KPI in manufacturing?

The formula for manufacturing KPIs varies based on the specific metric. Overall Equipment Effectiveness (OEE), being a crucial KPI, is calculated as OEE = Availability × Performance × Quality. Other KPIs like Downtime or Inventory Turnover have unique calculation formulas.

How do you track productivity in manufacturing?

To track productivity in manufacturing, monitor key metrics like Overall Equipment Effectiveness (OEE), cycle time, and output volume. Utilize manufacturing software, set performance targets, and regularly analyze data to identify improvement areas and enhance overall productivity.

Wrap Up

Key Performance Indicators (KPIs) for the manufacturing industry are essential for gauging and enhancing manufacturing efficiency. Each metric from OEE to Cycle Time, Quality Yield, Downtime, and Inventory Turnover provides valuable insights for optimization.

OEE measures the efficiency of machinery, while Cycle Time assesses the duration of production cycles. Quality Yield focuses on maintaining stringent quality standards, Downtime highlights operational interruptions, and Inventory Turnover manages stock dynamics.

Robust tracking systems and advanced software amplify these metrics’ potential for real-time monitoring. This not only allows you to respond swiftly to challenges but also fosters a culture of continuous improvement. Moreover, aligning each metric with organizational objectives enables adaptability and competitiveness.

Strategic incorporation of KPIs contributes to informed decision-making, efficient resource allocation, and the pursuit of operational excellence. This holistic approach makes manufacturing KPIs integral, driving a culture of continuous improvement and resilience.

ChartExpo proves invaluable in visualizing and comprehending key performance indicators (KPIs) for the manufacturing industry. By leveraging clear visualizations, such as charts and graphs, stakeholders gain actionable insights into the relevant metrics. This promotes informed decision-making and guides strategic improvements.

Do not hesitate.

Embrace the Key Performance Indicators for the manufacturing industry with ChartExpo to chart a course for sustainable growth.

How much did you enjoy this article?

ExcelAd1
Start Free Trial!
133593

Related articles

next previous
Microsoft Excel8 min read

Excel Task Tracker Template for Smarter Task Insights

Task tracker template in Excel organizes tasks, tracks deadlines, and boosts efficiency. Learn its benefits, and explore expert tips to simplify task management.

Microsoft Excel10 min read

Invoice Tracker Template in Excel for Better Insights

An invoice tracker Excel template helps track invoices, due dates, and payments. Learn how to use this template for better financial management.

Microsoft Excel12 min read

Key Performance Indicators in Healthcare for Better Insights

Key Performance Indicators in healthcare track patient care and efficiency. Learn about these KPIs, top examples, and how to use them to improve outcomes.

Microsoft Excel10 min read

BMI Calculation Formula in Excel for Better Fitness Insights

The BMI calculation formula in Excel helps track and analyze body mass index. Explore step-by-step instructions and tips to simplify BMI tracking in Excel.

Microsoft Excel29 min read

How to Create a Tornado Chart in Excel? A Complete Guide

Click to learn how to plot a Tornado Chart in Excel using easy-to-follow steps. Also, we’ll address the following question: what is a Tornado Diagram?

ChartExpo logo

Turn Data into Visual
Stories

CHARTEXPO

  • Home
  • Gallery
  • Videos
  • Services
  • Pricing
  • Contact us
  • FAQs
  • Privacy policy
  • Terms of Service
  • Sitemap

TOOLS

  • ChartExpo for Google Sheets
  • ChartExpo for Microsoft Excel
  • Power BI Custom Visuals by ChartExpo
  • Word Cloud

CATEGORIES

  • Bar Charts
  • Circle Graphs
  • Column Charts
  • Combo Charts
  • Comparison Charts
  • Line Graphs
  • PPC Charts
  • Sentiment Analysis Charts
  • Survey Charts

TOP CHARTS

  • Sankey Diagram
  • Likert Scale Chart
  • Comparison Bar Chart
  • Pareto Chart
  • Funnel Chart
  • Gauge Chart
  • Radar Chart
  • Radial Bar Chart
  • Sunburst Chart
  • see more
  • Scatter Plot Chart
  • CSAT Survey Bar Chart
  • CSAT Survey Chart
  • Dot Plot Chart
  • Double Bar Graph
  • Matrix Chart
  • Multi Axis Line Chart
  • Overlapping Bar Chart
  • Control Chart
  • Slope Chart
  • Clustered Bar Chart
  • Clustered Column Chart
  • Box and Whisker Plot
  • Tornado Chart
  • Waterfall Chart
  • Word Cloud
  • see less

RESOURCES

  • Blog
  • Resources
  • YouTube
SIGN UP FOR UPDATES

We wouldn't dream of spamming you or selling your info.

© 2025 ChartExpo, all rights reserved.