Categories
By ChartExpo Content Team
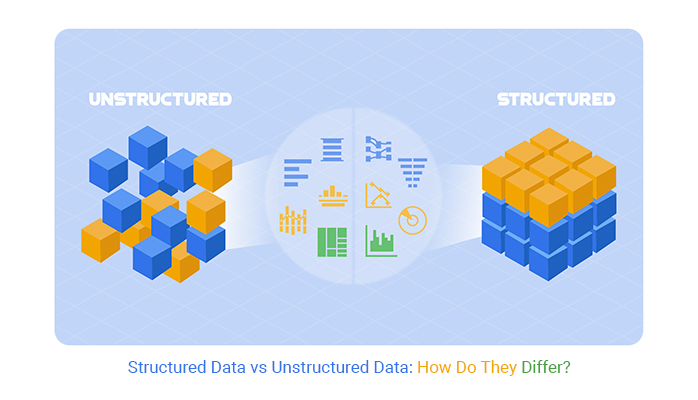
Think of your data as a kitchen. Structured data? That’s your organized spice rack. Everything has its label and spot. Unstructured data? That’s the junk drawer. Random tools, keys, and batteries jumbled together.
In business, you deal with both types constantly. Structured data vs unstructured data affects how you manage, store, and use information. One is neat and predictable. The other? Wild and flexible. Knowing the difference can be the edge you need to handle your data effectively.


But here’s the question: Are you using the right kind?
Structured data vs unstructured data isn’t a battle of which one is better. It’s about choosing the right tool for the job.
Understanding when to rely on clear-cut spreadsheets versus diving into the chaos of social media posts can change how you see your data.
So, what’s the deal with structured data vs unstructured data? Let’s break it down and figure out which one fits your needs — and how you can make both work for you.
First…
Structured data lives in a world of order. Imagine a well-organized filing cabinet, where everything is stored in predefined formats. Data is neatly tucked away in tables, rows, and columns, making it super easy to locate and retrieve.
You’ll find structured data in relational databases and spreadsheets. It’s like these tools were made for keeping data in line. Databases and spreadsheets use the structured format to let us quickly access and manipulate stored data with the precision of a surgeon.
Structured data shines when dealing with numbers and clear-cut data, like transactions, inventory, and financial records. It’s a star at tracking every detail, essential for sectors that rely on accuracy and speed.
Here, there are no rules. Unstructured data includes text, images, audio, and more. It’s like a bustling city market, full of different sights and sounds, each piece of data unique and unorganized.
This type of data finds its home in NoSQL databases, data lakes, and cloud-based data warehouses, places that welcome data in any form. These platforms don’t force data into predefined models, making them perfect for storing the messy reality of unstructured data.
Unstructured data is at its best when dealing with human-generated information like social media posts, product reviews, and multimedia content. It helps businesses tap into customer sentiments and trends that structured data might miss.
Relational databases are perfectly suited for structured data. They organize data into predefined models like tables, which makes data easy to access and manage. This structure allows for efficient querying with languages such as SQL, making them ideal for data that needs quick retrieval and robust transaction support.
SQL databases such as MySQL and PostgreSQL shine when handling structured data. They use schemas to define data structures and can quickly process SQL queries. This makes them incredibly fast and efficient, especially when dealing with large volumes of structured data.
SQL databases are optimized for operations on structured data. They can swiftly search through tables using indices, sort data, and join tables efficiently. These capabilities make SQL databases a powerhouse when speed and efficiency are paramount.
Unstructured data, which includes formats like emails, videos, and social media posts, doesn’t fit neatly into traditional database schemas. Instead, it finds a home in more adaptable environments.
NoSQL databases, data lakes, and file systems provide the flexibility unstructured data requires. NoSQL databases, for example, can handle a variety of data formats and structures, from JSON documents to key-value pairs.
Data lakes allow for the storage of raw data in its native format, and file systems manage data without imposing any structure, making them ideal for storing diverse data types.
Unstructured data storage is all about flexibility. Whether it’s handling rapid changes in data types or scaling to accommodate huge data volumes, these systems adjust easily. Their ability to evolve with the needs of the data they store makes them indispensable in today’s data-driven world, where effective data-driven decision-making relies on the seamless access and data analysis of diverse data sets.
Structured data sits neatly in databases, where each piece of data fits perfectly into predefined models. Think of it as data wearing a uniform, ready for inspection. SQL, or Structured Query Language, is the tool of choice here.
It’s like having a magic wand that lets you effortlessly call forth data with just a flick and a command. Need to find all customers who bought blue widgets last June? Just a few lines of SQL can make that data pop up like a well-trained rabbit from a hat.
Thanks to its organized nature, structured data allows for quick insights. You can use tools like Crosstab Charts to compare different data sets side by side. Imagine quickly spotting trends without digging through mountains of data. It’s like having a treasure map where X marks the spot of your needed insights.
Enter the realm of unstructured data: social media posts, images, videos, and more. This is where structured data tools fall short. But fear not, because here come the big guns: Natural Language Processing (NLP) and image recognition.
NLP reads and understands human language the way you decode a secret note from a friend, while image recognition allows computers to identify and react to visuals. It’s not just seeing; it’s understanding what’s seen, like recognizing faces in a crowd. Together, these technologies enhance data interpretation by turning complex data into meaningful insights, making it easier to interpret and act on information in both text and images.
Diving into unstructured data requires more than the usual tools – you need advanced software that can handle the complexity of human language and visuals.
This might involve using Heatmaps to track eye movements on a website or employing a Mosaic Plot to visualize complex market trends. These aren’t your everyday tools; they’re the high-tech gadgets that make sense of the chaos. Think of them as the superhero gear needed to tackle a villainous heap of raw, unstructured data.
Structured data remains organized due to its predefined model. It fits neatly into tables and follows specific schemas that dictate the format and type of data stored.
Think of it as a well-organized filing cabinet, where everything has a label and a specific place. This methodical organization reduces clutter and simplifies data management tasks.
Because structured data is so orderly, storing and maintaining it is a breeze. Databases designed for structured data use less space and processing power, making operations like searching, updating, and indexing fast and efficient.
Imagine trying to find a book in a small, well-sorted library versus a vast warehouse of books piled randomly. The former is much quicker, right?
Unstructured data is a wild beast. It includes everything from emails and videos to social media posts.
Unlike structured data, there’s no clear format or order, making it bulky and cumbersome to manage. Picture trying to organize a huge crowd of people from multiple backgrounds speaking different languages. It’s a bit chaotic!
To manage the surge in unstructured data, innovative strategies and technologies are necessary. Tools like data lakes are employed to store vast amounts of raw data in its native format.
Think of a data lake as a big container where you can dump all sorts of things, and then later decide how to sort them out.
Additionally, using a Mosaic Plot or a Tree Map can help visualize such complex data patterns, making them easier to understand and analyze. These visual tools allow us to see connections and patterns that might not be obvious at first glance.
The following video will help you to create a Mosaic Plot in Microsoft Excel.


The following video will help you to create a Mosaic Plot in Google Sheets.
Imagine a business that juggles thousands of transactions every hour. Here, structured data acts as the backbone. Each transaction is logged with precise details: who bought what, when, and for how much?
This data fits neatly into tables and databases, making it a breeze to track, analyze, and audit. In inventory systems, structured data helps keep tabs on stock levels, ensuring shelves are never empty and storage costs are kept in check. Organizing this information effectively, simplifies analyzing and interpreting data, allowing businesses to make informed decisions and optimize operations.
In banking, structured data is indispensable. Banks need to manage accounts, transactions, and customer data with pinpoint accuracy. Think about the last time you checked your bank balance online. That quick, accurate response is powered by structured data.
Retail giants, meanwhile, use structured data to manage everything from pricing to purchasing patterns, helping them predict what products will fly off the shelves next season. By leveraging predictive analytics, they can forecast trends more accurately, optimizing inventory and maximizing sales.
Switch gears to unstructured data, where context is king. Social media posts, loaded with slang and emojis, don’t fit neatly into traditional databases but they’re gold mines for sentiment analysis.
Customer feedbacks, similarly, offer raw, unfiltered feedback that can shape product development and marketing strategies.
Image recognition, too, relies on unstructured data; it allows computers to understand and categorize content in photos and videos just like a human would.
Marketing teams thrive on unstructured data. They use insights from social media to craft campaigns that resonate on a personal level with consumers.
Customer service departments analyze transcripts from support calls and online chats to identify common pain points, turning every complaint into an opportunity to improve.
These examples show how unstructured data allows for a deeper, more nuanced understanding of human behavior and preferences, enabling more effective customer behavior analytics to drive personalized experiences and targeted strategies.
Structured data lives in a world of strict order. Think of it as the neatly arranged cubicles in an office. Each piece of data has its precise place and format, from dates and names to numbers. This rigid structure is a huge plus for maintaining data quality.
It’s like having a detailed map where every item is exactly where you expect it to be, making it easier to spot and fix any errors. Errors shout out, “Hey, look here!” because they disrupt the pattern.
To keep structured data clean, follow these best practices: automate data validation to catch errors early, use consistent data entry formats, and regularly audit your data.
Think of it as routine maintenance for your car. Regular checks and alignments keep it running smoothly. Using tools like Crosstab Charts can help visualize discrepancies in data for quick corrections.
Unstructured data is like your home’s junk drawer. It’s filled with various items — texts, images, audio files — without a specific order.
Cleaning this can be tough because there’s no clear starting point. Texts can have slang or typos, images might be of varying qualities and formats, and audio could have background noise. Each type requires unique cleaning strategies, such as data cleansing techniques, which makes standardization a challenge.
To manage this chaos, focus on creating metadata for files, which acts like labels on your spice jars — helping you quickly identify what you’re looking at.
Use machine learning algorithms to categorize and extract useful information from unstructured data. Techniques like clustering help group similar items together, bringing some order to the mess.
Visual aids like Heatmaps can show where most of the ‘dirty’ data accumulates, guiding cleanup efforts more effectively.
When it comes to handling data, structured data stands out for its speed. Why? It’s all about the format. Structured data is organized in rows and columns, making it a breeze for database systems to locate and access.
Think of it as having a well-organized toolbox where every tool has its spot. You don’t waste time searching—it’s right there!
This organization allows for quicker queries. For example, if you need to pull up all transactions from a specific date, a SQL query can retrieve this information almost instantly. It’s like asking a well-prepared librarian for a book who knows exactly where it is on the shelf.
Visualizing this efficiency can be demonstrated through a Pareto chart, where the majority of processing time benefits are clearly prioritized and shown to stem from organized data handling.
Now, unstructured data is a different beast. It includes everything from emails and videos to social media posts. It’s messy and doesn’t fit neatly into traditional databases. Imagine trying to find a specific tool in a shed where everything is just thrown in randomly. It takes longer, right?
The complexity and sheer volume of unstructured data means processing it requires more steps and more sophisticated techniques. For example, to analyze sentiment from customer feedback on social media, you first need to use algorithms to interpret and categorize the data—processes that take time.
A Heatmap can be useful here to show where most data processing efforts are concentrated, highlighting the areas that slow down the workflow. This data visualization helps in understanding which parts of the data handling need more attention to improve efficiency.
Think about structured data as the neat kid on the block. It loves order, everything has a place, and it sticks to a strict format that database systems just adore.
This makes structured data a breeze when it comes to indexing. Imagine you’re looking for a friend’s phone number in a well-organized address book, where everything is indexed alphabetically. That’s how structured data treats its entries – easy to find, no fuss.
Structured data operates on what we call “simple keys” which are the golden tickets for quick data retrieval. These keys are unique identifiers that act like shortcuts to help you jump straight to the data you need without sifting through heaps of irrelevant information.
This setup is perfect for high-speed lookups, making it a go-to for tasks needing rapid access to data.
Now, let’s flip the script and talk about unstructured data. This is the wild child of the data world. It doesn’t follow a specific format or structure, which makes it trickier to index.
Imagine trying to find a snippet of information in a giant, messy room where nothing is labeled. You might find what you need, but it’s going to take a lot more effort and a bit of luck.
Because unstructured data includes everything from emails and videos to images and text documents, indexing it requires some nifty techniques.
Software solutions today use sophisticated algorithms and artificial intelligence to make sense of this chaos. Techniques like natural language processing help in understanding and categorizing text, while image recognition tools can analyze and tag visual content.
Indexing unstructured data might not be straightforward, but with the right tools, it’s not impossible!
For instance, a scatter plot can brilliantly showcase the relationships and patterns within unstructured data, providing insights that might not be obvious at first glance. This visualization not only supports the indexing process but also adds a layer of understanding by mapping out the complexities in a visually digestible format.
Structured data operates within predefined schemas. Think of it as organizing books by a strict system: genre, author, then publication date.
What happens when a new category bursts onto the scene? Adjustments aren’t just tricky; they require remodeling the entire library! Now, imagine scaling this in a business. You need more shelves (storage) and more librarians (processors) as data grows. But there’s a limit; eventually, you’ll run out of space or the system becomes too slow, stalling further growth.
Consider a Mekko Chart here, where each segment could represent data categories and their corresponding resource allocation, visually emphasizing the scalability challenge.
Unstructured data is the wild child of data types. It’s all those emails, videos, and social media posts with no strict format. Scaling here? It’s like expanding a digital playground. As more kids (data) show up, you add more swings and slides (servers) without worrying about rearranging the existing setup.
This flexibility comes from technologies like NoSQL databases, which can handle various data types and massive volumes without a hitch.
Visualize this using a Tree Map, where each data type dynamically adjusts its size based on volume, clearly showing how unstructured data accommodates growth without breaking a sweat.
In the bustling world of data management, opting for a schema-first approach in handling structured data is akin to assembling a detailed blueprint before constructing a building. Imagine diving into a complex project without a clear plan. Chaos ensues, right?
Similarly, structured data requires a predefined schema to ensure that data is organized and consistent from the start. This method supports efficient data processing, querying, and maintenance, preventing the headaches of data anomalies and data integrity issues.
A defined structure upfront allows businesses to set clear rules for data entry, ensuring all incoming data fits neatly into the established categories. This can be incredibly beneficial in scenarios where precision is paramount, such as financial reporting or inventory management.
Think of it as setting the stage for a play—every actor knows exactly where to stand and what to say, reducing confusion and ensuring a smooth performance.
On the flip side of the coin, we have the schema-on-the-fly approach, a less rigid path often associated with unstructured data. Here, the data lands in storage with minimal initial processing, resembling a free-form jazz improvisation more than a classical symphony.
This flexibility is perfect for dealing with diverse data types—from social media posts to multimedia—and allows for the incorporation of data that does not fit neatly into predefined categories.
The magic happens in the post-storage phase, where tools and technologies such as machine learning algorithms can classify and analyze this eclectic data mix. This approach is not just about storing data; it’s about making sense of it in retrospect. It’s perfect for environments where data inputs are highly variable or evolving rapidly, and where agility trumps the order.
Imagine a historian trying to make sense of a newly discovered ancient manuscript. They don’t know in advance what information the manuscript contains but must decipher, categorize, and analyze the content to fit it into the broader historical knowledge.
Similarly, schema-on-the-fly allows businesses to remain flexible and responsive, adapting their data structures as new information becomes available or as business needs evolve.
In both scenarios, visualization tools play a crucial role. For instance, a Mosaic Plot or a Heatmap can be instrumental in revealing patterns and relationships in both structured and unstructured data, offering insights that might not be apparent from raw data alone.
Structured data operates within strict frameworks. Think of it as data with a tight suit and tie, always needing to look the part. It lives in predefined models like databases where every piece of data has its place. Don’t fit the mold? Well, you’re not getting in.
Changing this setup isn’t just a stroll in the park. It’s more like planning a big event. You need the right tools, the right people, and yes, it costs money.
Imagine wanting to add a new guest to a sold-out concert. You’d need to rearrange seating, print new tickets, maybe even hire extra staff. Similarly, adjusting structured data systems often requires rewriting code or altering database schemas. It’s a process that demands both time and resources.
Now, let’s chat about unstructured data. This is the cool, casual cousin that shows up to the family BBQ in flip-flops and a Hawaiian shirt. It’s flexible, free-form data like emails, videos, or social media posts. It doesn’t require a strict format or predefined model to exist.
Adding new types of data here? It’s a breeze. No need for intense planning or high costs. It’s akin to sketching on a big, blank canvas where your imagination is the limit. Whether it’s a new form of customer feedback or a different kind of multimedia file, unstructured data systems welcome it with open arms.
Let’s say you want to start capturing data through customer video testimonials. No need for a big setup; just start collecting and storing. It’s that adaptable. This flexibility is why industries that deal with diverse data types, like media or research, thrive on unstructured data systems. They can grow and evolve without the constant need to restructure the underlying systems.
In visualizing this, imagine a Scatter Plot where each dot represents a different data type. In unstructured systems, you can keep adding dots without needing to redraw the entire plot. This visual can show how unstructured data accommodates diversity without the need for significant changes to the existing setup.
In the world of structured data, things are pretty neat. Imagine a well-organized filing cabinet where every document has its place. That’s structured data for you. It lives in tables, and each column and row has a strict role to play.
Think of a school register where each student’s name is linked to a unique ID, class, and birthdate. It’s all very orderly.
Now, let’s talk about keys and constraints. They’re the heroes that maintain order in the database world.
Primary keys? They ensure every record is unique.
Foreign keys? They’re like the secret agents that link tables together, making sure data across the database makes sense.
Constraints? They set the rules, like a strict teacher ensuring students can’t be younger than five or older than 20 in a primary school register. In essence, these elements make navigating through structured data a walk in the park.
Switching gears to unstructured data—it’s the wild child. This data doesn’t fit neatly into tables. It’s all those emails, social media posts, videos, and articles floating around. Finding relationships here is more like detective work, without the obvious clues that structured data provides.
To make sense of unstructured data, think of using a magnifying glass to spot hidden connections. Metadata is your best friend here. It’s data about data. Think about a photo with tags or a document with author information.
Content analysis is another ace up the sleeve. It involves algorithms to sift through text, identify themes, or even sentiment. Imagine scanning through thousands of tweets to gauge public opinion on a new product.
And when visualizing these relationships, forget the usual pie charts. A Heatmap or a Co-occurrence Chart works wonders. A Heatmap can show you where the hotspots are in your data, and a Co-occurrence Chart? It’s perfect for spotting patterns in unstructured data, like which words or phrases commonly appear together in tweets or reviews.
Structured data and visualization are a match made in heaven. Think of structured data as a well-organized pantry. Everything’s labeled and stored in its place. Now, when you’re trying to whip up a meal—or a graph—the process is straightforward.
For structured data, a Sunburst Chart or a Tree Map works wonders. These charts show hierarchies and relationships, letting you see the big picture at a glance. It’s like having a map when you’re on a road trip. You know exactly where you’re going and how everything connects.
Now, unstructured data is a different beast. It’s messy, like trying to find your way in a city with no street signs.
To start making sense of this chaos, you often need to do some clean-up first. Think of it as gathering all the random notes scattered across your desk and sorting them into neat piles. Once you’ve got some order, a Mosaic Plot or a Heatmap can help visualize this type of data.
These visual tools help spot patterns and anomalies in the data, turning a wild mess into insights you can actually use. It’s not just about seeing the data but making it tell its story.
When we talk about structured data, think of it as the neat freak of data. Everything has its place. This data abides by a strict schema, meaning it follows a predefined format and organization. Think rows and columns in spreadsheets. This setup is a game-saver when you’re on the lookout for blips.
Why? Because any data that doesn’t fit this mold sticks out like a sore thumb. Misspelled words, incorrect numbers, or even misplaced data points—spotting these errors becomes a breeze. Imagine trying to find a red sock in a drawer of white socks. Pretty easy to spot, right? That’s what it’s like with structured data. Errors practically wave at you, begging to be corrected.
Now, let’s chat about unstructured data. This is the wild child of data. It doesn’t follow a clear structure or order—think texts, videos, and social media posts. Detecting errors here? It’s like finding a needle in a haystack. A big, messy, ever-changing haystack.
The complexity of unstructured data means mistakes are well-hidden. You might have typos in text or inconsistencies in information spread across different formats. And because there’s no clear structure, these errors don’t stick out.
You really have to dig deep and sometimes use advanced tools like Natural Language Processing (NLP) or a cleverly designed Pareto Chart to prioritize which errors are causing the most trouble.
Structured data vs unstructured data isn’t a choice between good or bad. It’s about using the right type for the right job. Structured data offers order, speed, and accuracy for clear-cut tasks like tracking transactions and inventory. Unstructured data, on the other hand, helps you understand the messier parts of business—customer reviews, social media trends, and multimedia content.
Both have their place. In fact, many businesses rely on both types to get a full picture of their operations. Financial data in spreadsheets keeps things organized, while feedback from social media adds context. When you know how to manage each type, you can make decisions based on facts and insights.
So, ask yourself: Are you handling your data effectively? Knowing the strengths of structured data and unstructured data helps you stay on top of both. The goal isn’t to pick one. It’s to know when to use each one to keep your business sharp and responsive.
Data doesn’t have to be confusing. It can work for you—if you know how to work with it.
How much did you enjoy this article?


Calculate accounts receivable turnover ratio to measure credit collection speed, improve cash flow, and strengthen your financial strategy. Read on!

Change Management KPIs are the key to tracking adoption, performance, and ROI during transitions. Find out which metrics matter. Read on!

Data collection methods and techniques determine the quality of every insight you act on. Explore key approaches for gathering reliable data. Read on!


