• Home
  • Tools dropdown img
    • Spreadsheet Charts

      • ChartExpo for Google Sheets
      • ChartExpo for Microsoft Excel
    • Power BI Charts

      • Power BI Custom Visuals by ChartExpo
    • Word Cloud

  • Charts dropdown img
    • Chart Category

      • Bar Charts
      • Circle Graphs
      • Column Charts
      • Combo Charts
      • Comparison Charts
      • Line Graphs
      • PPC Charts
      • Sentiment Analysis Charts
      • Survey Charts
    • Chart Type

      • Box and Whisker Plot
      • Clustered Bar Chart
      • Clustered Column Chart
      • Comparison Bar Chart
      • Control Chart
      • CSAT Survey Bar Chart
      • CSAT Survey Chart
      • Dot Plot Chart
      • Double Bar Graph
      • Funnel Chart
      • Gauge Chart
      • Likert Scale Chart
      • Matrix Chart
      • Multi Axis Line Chart
      • Overlapping Bar Chart
      • Pareto Chart
      • Radar Chart
      • Radial Bar Chart
      • Sankey Diagram
      • Scatter Plot Chart
      • Slope Chart
      • Sunburst Chart
      • Tornado Chart
      • Waterfall Chart
      • Word Cloud
    • Google Sheets
      Microsoft Excel
  • Services
  • Pricing
  • Contact us
  • Blog
  • Support dropdown img
      • Gallery
      • Videos
      • Contact us
      • FAQs
      • Resources
    • Please feel free to contact us

      atsupport@chartexpo.com

Categories
All Data Visualizations Data Analytics Surveys
Add-ons/
  • Google Sheets
  • Microsoft Excel
  • Power BI
All Data Visualizations Data Analytics Surveys
Add-ons
  • Google Sheets
  • Microsoft Excel
  • Power BI

We use cookies

This website uses cookies to provide better user experience and user's session management.
By continuing visiting this website you consent the use of these cookies.

Ok

ChartExpo Survey


Home > Blog > Power BI

What is a Data Lake in Power BI? Benefits & Use Cases

What is a data lake? Is it a lake where you bring your fishing gear and catch data fish?

No – it’s not that kind of lake. A data lake is a repository for storing vast amounts of raw data in its native format. Think of it as a big, messy pond where data from different sources can swim together.

What is a Data Lake

Data lakes are like a playground for data scientists and analysts. You can dive into the lake, explore the depths, and fish out the information you need.

The beauty of a data lake is that it doesn’t discriminate. It accepts all types of data, structured or unstructured, from traditional databases to social media feeds.

But beware: The data lake can quickly become a data swamp if not managed properly. Without proper governance and organization, the data can become murky and hard to navigate. Therefore, it’s essential to have a strategy in place to keep the lake clean and ensure the data stays fresh and valuable.

So, join us as we dive into the world of data lakes and explore their mysteries, challenges, and potential.

Table of Content:

  1. What is a Data Lake?
  2. Understanding Data Lake in Power BI
  3. Why are Data Lakes Important For Businesses?
  4. When you Should Use a Data Lake?
  5. How Do Data Lakes Work?
  6. Data Lake Architecture
  7. Data Lake Features
  8. 4 Main Types of Data Lake
  9. Data Lake Use Cases in Power BI
  10. Data Lake Tools
  11. How Do You Deploy Data Lakes in the Cloud?
  12. Data Lake Example in Power BI
  13. How to Do Data Lake Analysis in Power BI?
  14. Data Lake Challenges
  15. Benefits of Data Lakes
  16. Best Practices For Data Lakes
  17. Data Lake Solutions in Power BI
  18. Data Lake – FAQs
  19. Wrap Up

What is a Data Lake?

Data Lake Definition

Definition: A data lake is a centralized repository that stores vast structured and unstructured data at any scale. Unlike traditional databases, it accommodates diverse data types and formats.

Organizations use data lakes to store raw, unprocessed data, enabling more flexible and comprehensive analytics. This reservoir-like storage system facilitates data exploration and analysis without predefined structures or schemas.

Understanding Data Lake in Power BI

A Data Lake in Power BI is a centralized repository that stores large volumes of raw, structured, and unstructured data. It enables efficient data storage, processing, and analytics, allowing Power BI to access and transform vast datasets for advanced reporting and visualization.

Why are Data Lakes Important For Businesses?

Data lakes are essential for businesses as they provide a centralized storage system for structured and unstructured data. They enable scalability, flexibility, and cost-effective data management, allowing organizations to analyze vast datasets for insights.

With support for AI, machine learning, and real-time analytics, data lakes help businesses make data-driven decisions, improve operations, and enhance customer experiences.

When you Should Use a Data Lake?

You should use a data lake when your business needs to store and analyze large volumes of structured and unstructured data from multiple sources. It is ideal for organizations leveraging big data, AI, or machine learning for advanced analytics.

Data lakes are also useful when scalability, cost-effectiveness, and real-time data access are priorities, enabling better decision-making and innovation.

How Do Data Lakes Work?

Data Lakes stores raw, structured, and unstructured data in its native format. They ingest data from multiple sources, organize it in a scalable repository, process it with analytics tools, and allow businesses to extract insights using platforms like Power BI.

Data Lake Architecture

Data lake architecture is designed to store, manage, and process large volumes of raw data from various sources. It typically consists of the following layers:

  1. Ingestion Layer – Collects data from multiple sources, including databases, IoT devices, and cloud services.
  2. Storage Layer – Stores raw, structured, and unstructured data in a scalable and cost-effective manner.
  3. Processing Layer – Uses big data frameworks like Apache Spark to clean, transform, and analyze data.
  4. Governance & Security Layer – Ensures data quality, access control, and compliance with regulations.
  5. Consumption Layer – Provides access to data for analytics, reporting, AI, and machine learning applications.

Data Lake Features

Here are the key characteristics that make data lakes a force to be reckoned with in big data.

  • Scalability: Data lakes should seamlessly scale to accommodate increasing volumes of data. This scalability ensures the data lake can handle growing datasets without compromising performance. Thus, it is suitable for evolving business needs.
  • Flexibility: Data lakes should be capable of storing diverse data types and formats. This allows you to ingest and analyze various data sources, promoting a comprehensive view of analytics and insights.
  • Centralized storage: Data lakes provide a centralized repository for storing vast amounts of data. This centralized storage simplifies data management and accessibility, reducing data silos and enhancing collaboration.
  • Cost-effective storage: Data lakes offer cost-effective storage solutions for large-scale data. Cost efficiency is crucial for handling massive datasets without incurring high storage expenses.
  • Schema-on-read: Unlike traditional databases, data lakes adopt a schema-on-read approach. This allows you to interpret and structure the data during the analysis phase. Thus, it eliminates the need for a predefined schema during data ingestion.
  • Data governance and security: Data lakes implement robust governance and security measures. Data integrity, compliance, and security are paramount to protecting sensitive information stored in the data lake.
  • Integration with analytics tools: Data lakes seamlessly integrate with various analytics tools and platforms. This integration supports efficient data processing, analysis, and visualization, facilitating actionable insights for users.
  • Support for big data technologies: Data lakes are designed to support big data technologies and frameworks. This enables the processing of large datasets using technologies like Hadoop and Spark, enhancing analytics capabilities.
  • Metadata management: Data lakes incorporate robust metadata management capabilities. Efficient metadata management helps you discover and understand the data stored, enhancing data governance and usability.
  • Versioning and lifecycle management: Data lakes support data versioning and lifecycle management. Version control ensures traceability and accuracy. On the other hand, lifecycle management helps to handle data efficiently throughout its lifespan.

4 Main Types of Data Lake

There are four main types of data lakes based on how they are structured and managed:

  1. On-Premises Data Lake – Hosted within a company’s data centers, offering full control but requiring high maintenance.
  2. Cloud Data Lake – Stored on cloud platforms like AWS, Azure, or Google Cloud, providing scalability, flexibility, and cost-effectiveness.
  3. Hybrid Data Lake – A mix of on-premises and cloud storage, allowing businesses to balance control and scalability.
  4. Multi-Cloud Data Lake – Uses multiple cloud providers to avoid vendor lock-in and improve resilience.

Data Lake Use Cases in Power BI

Let’s explore the use cases and limitless possibilities of data lakes.

  • Big Data Analytics

Data lakes facilitate storing and analyzing large volumes of structured and unstructured data. This facilitates comprehensive analytics and uncovering valuable insights from diverse data sources.

  • Data Warehousing

Data lakes complement traditional data warehouses for enhanced data storage and analytics. Integrating data lakes with data warehouses helps to store raw, unstructured data in the lake. Then, process curated data in the warehouse, optimizing cost and performance.

  • Machine Learning and AI

Data lakes play a crucial role in supporting machine learning (ML) and artificial intelligence (AI) applications. ML and AI algorithms benefit from the vast and varied datasets in data lakes. This enables more accurate model training, prediction, and decision-making.

  • IoT Data Storage and Analysis

IoT devices generate massive amounts of data. Data lakes offer a flexible and cost-effective platform to store, process, and derive actionable insights from this data.

  • Log and Event Data Analysis

Storing logs and event data in a data lake allows organizations to perform in-depth analysis and troubleshoot issues. Ultimately, gain visibility into system behavior and performance.

Data Lake Tools

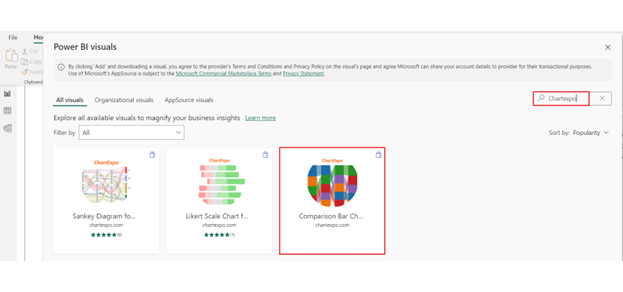
Data lakes use a variety of tools for storage, processing, integration, analytics, and governance. Power BI plays a crucial role in visualizing and analyzing data stored in data lakes.

1. Storage Tools

  • Azure Data Lake Storage (ADLS) – Microsoft’s scalable, cloud-based data lake solution.
  • Amazon S3 – AWS’s object storage for data lakes.
  • Google Cloud Storage – Google’s data lake storage solution.

2. Data Processing & Querying

  • Apache Spark – Open-source framework for big data processing.
  • Databricks – Unified analytics platform optimized for ADLS and AWS S3.
  • Presto & Hive – SQL-based querying tools for data lakes.

3. Data Integration

  • Azure Data Factory – ETL tool to ingest and transform data for Power BI.
  • AWS Glue – Serverless data integration service.
  • Apache NiFi & Talend – Data flow and ETL tools.

4. Analytics & Visualization (Including Power BI)

  • Power BI – Microsoft’s business intelligence tool that connects directly to data lakes, enabling real-time insights and reporting.
  • Tableau & Apache Superset – Other visualization tools used for BI reporting.

5. Governance & Security

  • Azure Purview – Data cataloging and governance for ADLS.
  • AWS Lake Formation – Security and access control for AWS-based data lakes.
  • Apache Ranger – Open-source data security tool.

How Do You Deploy Data Lakes in the Cloud?

Before you begin, ensure you have an Azure subscription, a Data Lake storage account, and a Power BI Desktop.

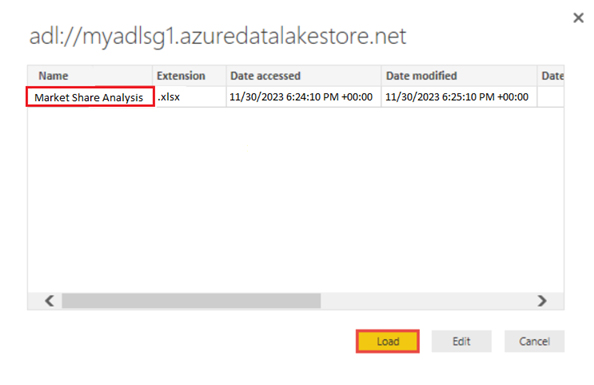
I assume you have already created a Data Lake Storage account called myadlsg1. Also, you have uploaded a sample data file (Market Share Analysis.xlsx) to it.

Follow these steps to connect with the data lake.

  • Launch Power BI Desktop.
  • From the Home ribbon, click Get Data, and then click More.
  • In the Get Data dialog box, click Azure, then click Azure Data Lake Store, and finally, click Connect.
Connect Data Source ce481
  • In the Azure Data Lake Store dialog box, provide your Data Lake Storage Gen1 account URL. Then click OK.
Gen 1 Account URL ce481
  • In the next dialog box, click Sign in to sign into the Data Lake Storage Gen1 account.
  • You will be redirected to your organization’s sign-in page.
  • Follow the prompts to sign into the account.
Sign into the data lake ce481
  • Once you have successfully signed in, click Connect.
Now Connect Data Lake ce481
  • The next dialog box shows the file you uploaded to your Data Lake Storage Gen1 account. Verify the info and click Load.
Dialog Box Shows The File ce481

Data Lake Example in Power BI

  • We’ll use the following data for this example.
Quarters Vendors Market Share
Q1 Samsung 27.69
Q1 Apple 28.45
Q1 Xiaomi 11.8
Q1 Huawei 6.53
Q1 Oppo 5.3
Q1 Vivo 4.19
Q2 Samsung 28.14
Q2 Apple 27.58
Q2 Xiaomi 12.62
Q2 Huawei 6.17
Q2 Oppo 5.5
Q2 Vivo 4.21
Q3 Samsung 28.45
Q3 Apple 27.71
Q3 Xiaomi 12.9
Q3 Huawei 6
Q3 Oppo 5.29
Q3 Vivo 4.17
Q4 Samsung 27.97
Q4 Apple 27.62
Q4 Xiaomi 12.68
Q4 Huawei 5.17
Q4 Oppo 6.07
Q4 Vivo 4.66
  • After the data has been successfully loaded into Power BI, you will see the following fields in the Fields tab.
Data Has Been Successfully Loaded ce481
  • Click on “Get more visuals“.
Get More Visuals ce481
  • Search for ChartExpo and select the Comparison Bar Chart:
Select The Comparison Bar Chart ce481
  • Click the “Add” button.
Click the Add button ce481
  • You can now see the Comparison Bar Chart in the visualizations list. Click on this icon.
Now See The Comparison Bar Chart ce481
  • Now, you can expand your chart space.
Expand Your Chart Space ce481
  • Select the fields of your data.
Select The Field of Your Data ce481
  • Click the Format visuals icon and click on Visual:
Click the Format Visuals Icon ce481
  • In Visual, click License Settings, add the key, and enable the license.
  • After adding the key, you can see the comparison bar chart.
Click License Setting ce481
  • Click the General tab to add the header text.
  • Add the header text in the Title.
Add Tittle on Chart ce481
  • The final Comparison Bar Chart in Power BI will appear as below.
Final What is a Data Lake

Insights

  • Samsung and Apple consistently maintain the leading market shares in each quarter.
  • Xiaomi demonstrates a stable market share across the quarters, albeit trailing behind Samsung and Apple.
  • Huawei sustains a consistent market share in the first three quarters but experiences a decline in market share in the fourth quarter.
  • Oppo and Vivo both sustain relatively steady shares with minor fluctuations. Yet, they show little growth compared to Samsung, Apple, and Xiaomi.

How to Do Data Lake Analysis in Power BI?

  1. Open your Power BI Desktop or Web.
  2. From the Power BI Visualizations pane, expand three dots at the bottom and select “Get more visuals”.
  3. Search for “Comparison Bar Chart by ChartExpo” on the AppSource.
  4. Add the custom visual.
  5. Select your data and configure the chart settings to create the chart.
  6. Customize your chart properties to add header, axis, legends, and other required information.
  7. Share the chart with your audience.

The following video will help you with Data Lake Analysis in Microsoft Power BI.

Data Lake Challenges

Diving into a data lake may sound like a refreshing adventure. But don’t be fooled by the serene surface. Beneath the calm waters lie a multitude of challenges waiting to test even the bravest of data explorers.

  • Data Quality and Governance

The sheer diversity of data in a lake can lead to information overload and compromise its quality, necessitating robust governance policies. Implementing stringent data quality checks is crucial to monitor and ensure the reliability of the stored information.

  • Data Security and Privacy

Data security and privacy pose significant challenges due to the open and accessible nature of data lakes. Safeguarding sensitive information demands the implementation of encryption, access controls, and monitoring mechanisms. Adherence to security and privacy policies is essential to mitigate potential unauthorized access or data breach risks.

  • Metadata Management

Efficiently managing metadata within a data lake is a pivotal challenge. Establishing effective metadata management practices is essential for facilitating seamless data discovery, comprehension, and utilization. A well-managed metadata framework enhances the overall usability of the diverse datasets stored in the lake, contributing to the success of analytics endeavors.

  • Data Silos and Fragmentation

Data silos and fragmentation can impede collaboration and data utilization if not addressed proactively. To overcome this challenge, you need a unified data architecture. You also need robust governance practices encouraging data sharing and collaboration among different teams.

  • Complexity of Querying and Analysis

The complexity of querying and analysis arises from the sheer volume and variety of data within a lake. You should invest in powerful querying and analytics tools to streamline these processes. Also, leverage data indexing and implement data virtualization techniques for simplified access and analysis.

  • Scalability Issues

Scalability issues can hamper the performance and responsiveness of data lakes as the volume of stored data grows. You should ensure the data lake infrastructure can handle increasing demands. You can achieve this by planning for scalability, adopting distributed storage and processing, and leveraging cloud-based solutions.

  • Integration with Existing Systems

Integrating data lakes with existing systems can be a nuanced and intricate process. Seamless integration with other data storage and processing systems is crucial to maintaining consistency and compatibility. This requires meticulous planning, strategic alignment, and a deep understanding of the existing technological landscape.

  • Cost Management

Cost management is a significant concern, especially for cloud-based data lakes. You must monitor and optimize storage, processing, and data transfer costs. Utilize cost management tools and regularly reassess infrastructure needs to ensure efficient resource allocation.

  • Skills and Expertise Gap

A skills and expertise Gap can hinder the effective implementation and maintenance of a data lake. To address this challenge, you should invest in training programs, hire experienced professionals, and consider external consulting services. This will help bridge skill gaps and ensure the successful management of the data lake environment.

  • Data Lake Overload

Data lake overload is a risk associated with accumulating excessive data without a clear strategy. To mitigate this, define a concise data strategy, prioritize relevant data, and implement regular reviews and management practices. This will help ensure alignment with overarching business objectives.

Benefits of Data Lakes

  1. Scalability – Easily store and manage vast amounts of structured and unstructured data.
  2. Cost-Effective – Uses low-cost storage solutions, especially in cloud environments.
  3. Flexibility – Stores raw data without predefined schemas, allowing future analysis.
  4. Advanced Analytics – Supports AI, machine learning, and big data analytics.
  5. Real-Time Insights – Enables faster data processing for real-time decision-making.
  6. Data Integration – Collects data from multiple sources for a unified view.
  7. Improved Business Intelligence – Enhances reporting, forecasting, and innovation.

Best Practices For Data Lakes

  1. Use a Unified Storage Layer – Combine the best of data lakes and data warehouses for structured and unstructured data.
  2. Implement Strong Data Governance – Ensure access control, data quality, and compliance with regulations.
  3. Optimize Data Processing – Use ETL/ELT processes and big data frameworks like Apache Spark for efficient analytics.
  4. Enable Schema Enforcement – Maintain structured formats while allowing flexibility for raw data.
  5. Ensure Scalability & Performance – Leverage cloud solutions and caching for faster query performance.
  6. Support Real-Time & Batch Processing – Allow real-time analytics alongside traditional batch workloads.
  7. Use Open Standards – Adopt open-source formats like Parquet, Delta Lake, or Iceberg for interoperability.

Data Lake Solutions in Power BI

Power BI integrates with Azure Data Lake to provide scalable storage and advanced analytics. Key solutions include:

  • Azure Data Lake Storage (ADLS) – A secure, cloud-based repository for storing and managing large datasets.
  • Power BI Dataflows – Enables data transformation and storage in ADLS for better reusability.
  • Azure Synapse Analytics – Connects with Data Lake for large-scale data processing and reporting.
  • Direct Query & Data Connectors – Allows Power BI to retrieve and analyze real-time data from a Data Lake.

Data Lake – FAQs

What is the one lake in Power BI?

The “OneDrive” is a designated data lake in Power BI. OneDrive for Business is a cloud-based storage solution that enables you to seamlessly upload, share, and access data files. This enhances collaboration and data integration capabilities within Power BI.

What is the difference between a data lake and a data warehouse?

A data lake stores raw, unstructured data at scale, supporting diverse analytics. A data warehouse structures and organizes data for efficient querying and reporting. While data lakes handle varied datasets, data warehouses focus on structured, processed data for business intelligence and analytics.

What is an example of a data lake?

Amazon S3, part of Amazon Web Services (AWS), is an example of a data lake. It allows organizations to store and retrieve large amounts of data flexibly. Moreover, it supports diverse data types and enables efficient analysis through various analytics and machine-learning tools.

Wrap Up

What is a data lake?

A data lake is a flexible repository for diverse data types. It stores raw, unstructured, and structured data in a centralized pool. Unlike traditional databases, data lakes adapt to evolving data without predefined structures. Thus, they provide unparalleled agility in handling evolving and diverse data sources.

The significance of data lakes lies in their scalable infrastructure. They are capable of collecting, processing, and analyzing massive datasets. Moreover, they empower advanced analytics, machine learning, and business intelligence. Breaking down silos, data lakes provide a holistic view of the data landscape, fostering collaboration and comprehensive insights.

However, successfully implementing a data lake demands thoughtful consideration of various challenges. Data governance is critical to maintaining the stored data’s quality, privacy, and integrity. Robust governance policies, metadata management practices, and security measures help ensure the effectiveness of a data lake.

Ultimately, data lakes propel organizations toward a data-driven future. They facilitate the extraction of actionable insights from vast datasets. Embrace them to navigate and harness the potential of vast information reservoirs.

How much did you enjoy this article?

PBIAd1
Start Free Trial!
131658

Related articles

next previous
Power BI12 min read

How to Create Sankey Diagram in Microsoft Power BI?

Learn How to Create Sankey Diagram in Microsoft Power BI using Desktop & Web Service. What they are and how to use them effectively.

Power BI8 min read

Power BI Artificial Intelligence: Insights Using Visuals

Discover all there is to know about the Power BI artificial intelligence. You'll also discover how AI is used in Power BI, and how to use it for analysis and more.

Power BI9 min read

Budgeting in Healthcare: Use Visuals to Spot Budget Gaps

This guide helps you discover what budgeting in healthcare is. You'll also discover the factors that affect hospital budgets and types of budgeting in healthcare.

Power BI9 min read

Predictive Analytics in Power BI for Making Insightful Visuals

This guide shows you everything you need to know about Predictive Analytics in Power BI. It also shows you how it works, and how to interpret the results.

Power BI8 min read

Quarterly Business Review Template for Optimum Reports

Discover what the quarterly business review template is. This guide also shows you the best practices to consider when using the QBR template.

ChartExpo logo

Turn Data into Visual
Stories

CHARTEXPO

  • Home
  • Gallery
  • Videos
  • Services
  • Pricing
  • Contact us
  • FAQs
  • Privacy policy
  • Terms of Service
  • Sitemap

TOOLS

  • ChartExpo for Google Sheets
  • ChartExpo for Microsoft Excel
  • Power BI Custom Visuals by ChartExpo
  • Word Cloud

CATEGORIES

  • Bar Charts
  • Circle Graphs
  • Column Charts
  • Combo Charts
  • Comparison Charts
  • Line Graphs
  • PPC Charts
  • Sentiment Analysis Charts
  • Survey Charts

TOP CHARTS

  • Sankey Diagram
  • Likert Scale Chart
  • Comparison Bar Chart
  • Pareto Chart
  • Funnel Chart
  • Gauge Chart
  • Radar Chart
  • Radial Bar Chart
  • Sunburst Chart
  • see more
  • Scatter Plot Chart
  • CSAT Survey Bar Chart
  • CSAT Survey Chart
  • Dot Plot Chart
  • Double Bar Graph
  • Matrix Chart
  • Multi Axis Line Chart
  • Overlapping Bar Chart
  • Control Chart
  • Slope Chart
  • Clustered Bar Chart
  • Clustered Column Chart
  • Box and Whisker Plot
  • Tornado Chart
  • Waterfall Chart
  • Word Cloud
  • see less

RESOURCES

  • Blog
  • Resources
  • YouTube
SIGN UP FOR UPDATES

We wouldn't dream of spamming you or selling your info.

© 2025 ChartExpo, all rights reserved.