Categories
By ChartExpo Content Team
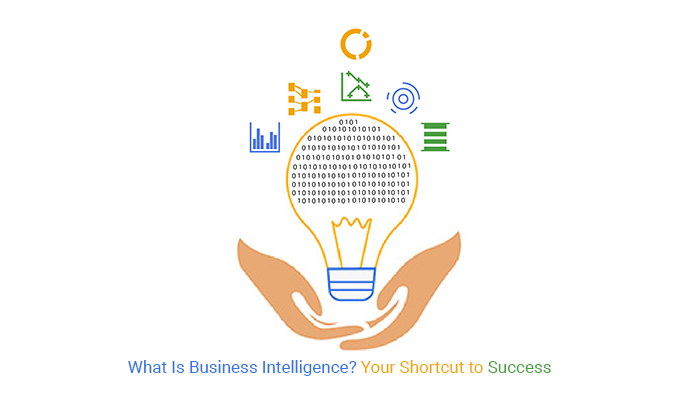
Let’s talk about the powerhouse behind modern business decision-making: Business Intelligence (BI). So, what is business intelligence? In the simplest terms, it’s a system that helps organizations turn raw data into actionable insights. With the right BI tools, businesses can stop guessing and start making informed decisions based on facts, trends, and predictions.
But here’s where it gets even better. What is business intelligence really doing behind the scenes? It gathers and analyzes data from different sources, then delivers it to the people who need it fast. Imagine you’re running a business and instead of sifting through mountains of data, you have a system that pulls out the gold nuggets of information you need in seconds. That’s what BI does. It’s the shortcut to smart, data-driven decisions.


Now, let’s zoom out a bit. You might wonder, what is business intelligence doing for the future of companies? It’s not just about making decisions in the moment. It’s about predicting what’s coming next. With BI, businesses can spot trends, forecast demand, and stay ahead of the competition. You’re not just reacting; you’re shaping the future.
In today’s fast-paced world, BI isn’t a luxury. It’s a necessity.
First…
Ever wondered how companies make smart decisions so quickly? That’s where Business Intelligence, or BI, jumps in. Imagine having a superpower that lets you see everything important about your business in one go. That’s BI for you. It helps businesses use their data to get insights that drive smart decisions.
At its core, BI involves tools and systems that play a key role in the strategic planning process of a corporation. These systems allow a company to gather, store, access, and analyze corporate data to aid in decision-making. Think of BI as the brain behind decision-making processes. It’s all about getting the right info to the right people at the right time. And by info, we mean data turned into valuable insights.
So, how does BI flip the script on decision-making? It’s simple. BI systems speed up how you get your data and turn it into insights. No more guessing games. With BI, businesses can see patterns from past data and make predictions about the future. It’s like having a crystal ball but way more reliable. This means decisions are faster and better informed. In short, BI helps a business move from reactive to proactive and predictive modes.
In today’s fast-paced world, going with your gut doesn’t cut it anymore. You need BI to stay ahead. It’s essential because it lets businesses be more strategic and efficient.
With BI, you can spot trends, identify inefficiencies, and find solutions quickly. It’s not just about having data but making the best out of it. That’s why BI is not just nice to have; it’s a must-have for data-driven success.
When you hook up your BI tools to your company’s goals, magic happens. Think of BI as the trusty sidekick helping your business reach its superhero potential. It’s all about using data to make smarter decisions that directly impact your business’s success.
First off, figure out what you need from your BI tools. What big wins are you aiming for? Is it to increase sales, improve customer satisfaction, or something else? Once you nail down your objectives, you can set up your BI tools to track and analyze the right data. It’s like setting up waypoints on your trek to success.
Your BI software should be best buddies with your company’s KPIs. By linking BI to these key performance indicators, you ensure that every type of chart, graph, and report produced is relevant and useful. It’s about keeping everyone on the same page, focused on the same targets.
Get everyone on board with data. When each department leverages BI tools, data becomes a common language spoken across the company. It’s about breaking down silos and making sure that from marketing to sales to customer service, everyone is making decisions based on solid data. Think of it as creating a playbook where everyone knows the plays and how to execute them flawlessly.
Data quality problems can tank the trust users place in BI tools. To fix these issues, start by identifying what’s wrong. Use data profiling to pinpoint errors like duplicates or inconsistencies. Once you spot these issues, it’s time to clean things up.
Implement automated processes that standardize and clean data before it hits your BI software. This ensures only high-quality information is used for analysis.
When data is wrong, decisions based on that data go wrong too. Users rely on BI tools for accurate insights. If the data is off, trust erodes fast. Ensure your data is correct from the get-go to maintain confidence in your BI tools.
Set up a solid data quality framework to keep your BI tools sharp. Define clear rules for what counts as ‘quality data’. Use software that automatically checks data against these rules. Regular audits and updates to the framework keep it strong and relevant.
Data profiling isn’t just a one-time task. It’s an ongoing strategy. Consistently check and recheck your data. Look for new types of errors as your business grows and evolves. This keeps your data clean and your BI tools effective.
Standardize data to avoid mismatches. For example, ensure dates are in the same format across all sources. Cleaning data involves removing or correcting data that is incorrect. Tools that automate these processes save time and boost accuracy.
Catch errors as they happen by setting up real-time validation. This means checking data for errors as it enters your system. It’s easier to fix issues at the entry point than after they’ve messed up your database.
Best-designed dashboards are great for keeping an eye on what’s happening. They help you spot trends and changes in real time. Set up dashboards to monitor key metrics for your business. This helps you react quickly to changes, keeping your operations smooth.
Pick keen-eyed team members to act as data stewards. Their job is to oversee data quality. They ensure the data cleaning and validation processes are up to scratch and evolve as needed. Having dedicated personnel for this role keeps your data management on point.
Tired of juggling spreadsheets? BI tools are your new best friend. They turn mountains of data into clear reports. Imagine clicking a button and getting the insights you need – no more hair-pulling!
Manual reporting can be a mess. Errors creep in, and it’s slow as molasses. BI tools automate this task, ensuring accuracy and speed. Say goodbye to the headache of manual errors and hello to smooth, automated processes.
Old-school reports look like they belong in a museum. BI solutions bring your data to life with dashboards that are easy on the eyes and even easier to understand. It’s like giving your reports a tech makeover!
Ever get tired of the same old data? Automating data refreshes in your BI dashboards means you’re always in the know. Fresh data, no effort. It’s like your dashboard drinks a cup of coffee every morning!
Waiting for queries is like watching paint dry. In-memory analytics makes your BI tools quick and nimble. Get answers fast – no more twiddling your thumbs waiting for insights.
Keep your reports in check with BI governance. It’s like having a rule book for your data, ensuring everything is tidy and in line. No more wild west of data – just clean, organized reports ready for action.
Visual aids transform raw data into clear, easy-to-understand formats. Charts, graphs, and maps turn numbers into stories. They reveal trends, highlight key facts, and support decision-making. With visual analytics, businesses can spot sales patterns, understand market dynamics, and make informed choices swiftly.
Data visualization tools are vital in business intelligence. They help firms see the bigger picture by converting data into visual reports. This approach aids in spotting connections and patterns that text-based data can’t show. It makes complex data accessible to all team members, promoting a data-driven culture.
Keep visuals simple and focused. Use colors and shapes to guide the viewer’s eye to the most important data. Ensure graphs are scaled correctly to reflect accurate comparisons. Labels should be clear and legible, making the visuals easy to understand at a glance.
Dashboards with interactive features empower users to explore data on their terms. Filters allow users to drill down into specifics, like time periods or geographic regions. This hands-on approach helps users uncover their own insights and fosters a deeper understanding of the data.
ChartExpo offers an array of data visualization options with easy-to-use interfaces. Whether it’s pie charts for market share analysis or line graphs for trend tracking, ChartExpo makes it simple. This tool helps create visuals that are not only informative but also appealing.
In retail, geospatial visuals map out store performance across different regions. They help identify high-performing areas and pinpoint regions that may require more attention. This spatial analysis is key to optimizing resource allocation and enhancing regional strategies.
The following video will help you create the Sankey Chart in Microsoft Excel.


The following video will help you create the Sankey Chart in Google Sheets.
Imagine you’re on the go and need quick access to your business insights. That’s where mobile access for BI tools steps in! It’s about making sure you can check those vital stats and data dashboards right from your phone or tablet, no matter where you are. Think about how handy it is to have all that info at your fingertips, ready whenever you need it.
Why do businesses need mobile BI? Simple. Speed and accessibility. In today’s fast-paced world, decisions need to be quick and informed.
Having access to BI tools on mobile devices means you can make smart, data-driven decisions on the fly. It’s not just convenient; it’s a major advantage for any business.
When it comes to mobile dashboards, think clean and simple. You want the most important data to stand out without the fuss. Big, clear charts and minimal text help make sure you don’t miss out on anything important because you’re squinting at your screen. It’s all about getting the full picture at a glance.
Widgets are your best friends in mobile BI. They help you keep an eye on key metrics without diving deep into full apps. A widget could show you real-time sales data or inventory levels – just a quick glance, and you’re updated. It’s the perfect tool for staying on top of things without getting bogged down.
For businesses to thrive with BI tools, user adoption is key. Start by explaining the benefits clearly. Show how these tools solve problems and improve daily tasks. Provide training sessions to make users comfortable and confident. Keep support ongoing to address any hitches quickly.
To increase adoption rates, make the software appealing. Introduce it as a solution that simplifies tasks, not another complicated tool to learn. Use regular feedback loops to improve features based on user input. Recognize and reward high adoption rates within teams to encourage others.
Role-based dashboards are a game-changer. They show only the data relevant to a user’s role, making the software intuitive and efficient. Start by understanding different roles in your company and the specific data they need. This targeted approach prevents information overload and boosts productivity.
Gamification makes learning fun and engaging. Integrate elements like points, badges, and leaderboards to motivate users to interact with the BI dashboard. Set clear goals and rewards that encourage users to explore deeper insights and make data-driven decisions.
A BI champions program can drive adoption and expertise across your organization. Select enthusiastic users from different departments to be champions. Equip them with advanced training and allow them to lead workshops and help sessions. Their enthusiasm and knowledge will inspire others to integrate BI tools into their daily routines.
In today’s fast-paced market, businesses need more than just basic data reports. They need deep insights that can guide decision-making and strategic planning. This demand has pushed the expansion of analytics capabilities in business intelligence (BI) and analytics platforms. These platforms now integrate advanced tools that can handle large volumes of data and provide actionable insights quickly.
Gone are the days when businesses relied solely on simple data reports. Now, BI and analytics go hand in hand to not only report data but also to analyze it for patterns, trends, and predictions. This integration allows businesses to anticipate market changes and consumer behavior, giving them a competitive edge.
Predictive modeling and machine learning have revolutionized BI platforms. These technologies forecast future trends based on historical data, making predictions more accurate than ever. Businesses can use these insights to make informed decisions, optimize operations, and increase profitability.
AutoML has made predictive analytics accessible to non-experts, democratizing data analysis. Now, even those without a deep background in data science can use predictive tools to gain insights and make data-driven decisions. This accessibility is transforming how businesses approach BI.
BI software solutions now often include reusable analytical components. These modules can be used across different projects, saving time and resources. They provide a consistent approach to data analysis, ensuring reliability and accuracy in insights across various applications.
How do you know if you’re getting your money’s worth from your Business Intelligence (BI) tools? It’s all about the return on investment (ROI). Start by setting clear financial goals.
Look at the costs saved and the extra revenue generated from using these tools. Track these against the initial and ongoing costs of the BI tools. This straightforward approach lets you see if the investment pays off.
Measuring the impact of BI tools isn’t always easy. One big hurdle? Figuring out what success looks like. You need to define what outcome you expect from these tools. Is it faster report generation? Better decision-making? Once you set these benchmarks, measuring impact becomes clearer but still takes effort and time.
What are the key performance indicators (KPIs) for a BI program? Think about what’s important for your business. It could be the speed of processing data, the accuracy of insights, or user satisfaction. Make sure these KPIs are easy to measure and directly tied to business outcomes. This helps in evaluating the BI program’s effectiveness.
Speed is everything in today’s business world. With BI and reporting tools, you can track how fast decisions are made. Look at the time it takes from data gathering to decision. Faster decisions can lead to better outcomes and give you a competitive edge. Monitor this speed over time to see if your BI tools are helping.
In the realm of business intelligence (BI), the story is king. Why? Because dry numbers and raw data won’t inspire action. Instead, imagine transforming those figures into a compelling narrative. This is where BI tools step in, turning data into stories that not only inform but also inspire strategic decisions.
Let’s face it – data alone can be pretty dull. It’s the story behind the data that grabs attention and drives action. A well-crafted narrative can highlight trends, explain changes, and predict future outcomes. This isn’t about making data exciting; it’s about making it understandable and actionable.
First off, know your audience. Are they tech-savvy or not? Next, choose the right visuals. A complex graph might confuse some, while a simple bar chart could do the trick.
Then, keep it straightforward. Focus on key points: What’s happening? Why does it matter? Lastly, keep it flowing. A good story moves smoothly from start to finish, keeping readers hooked till the end.
Visual aids are not just pretty decorations; they’re tools to help your audience grasp complicated data quickly.
Use best colors for graphs to categorize, charts to summarize, and diagrams to show relationships. Each visual should serve a clear purpose. Remember, the goal is to make data accessible, not overwhelming.
Never underestimate the power of a second pair of eyes. Peer reviews help catch errors and unclear sections that you might overlook. They ensure your BI reports are not only accurate but also crystal clear. Think of it as a test run before the real presentation. If your peers get it, your audience will too.
Managing data in BI tools can be a bit of a puzzle, but who doesn’t love a good challenge? First up, it’s all about getting your data in line. Think of it as organizing a messy drawer. You want everything neat so you can find what you need without a fuss.
Ah, hierarchical data. It sounds fancy, but it’s just data that’s stacked in levels, kind of like a family tree. The tricky part? BI tools often get a bit overwhelmed by all the layers. It’s like trying to read a map with too many roads. The solution? Flatten those layers where you can, making the data easier to navigate.
Data modeling is not about fashion; it’s about making your data strut its stuff. By using smart modeling techniques, you can show off your data in ways that make sense and deliver insights. Think of it as teaching your data to speak clearly in the boardroom.
Simplifying data structures is like turning a wild garden into a neat veggie patch. You want your BI tools to access the goodies without getting tangled in the weeds. By simplifying, you make sure that your tools can pick up the data they need quickly and without hassle.
Data warehousing is the secret sauce to keeping your BI tools well-fed. It’s about storing your data efficiently so that when you ask a question, the answer comes back fast. Imagine a library where every book is exactly where it should be – that’s your goal.
In the world of Business Intelligence (BI), quick data retrieval isn’t just nice, it’s essential. Picture this: you’re in a meeting, and you need the latest figures to make a critical decision. Who has time to wait?
By optimizing the underlying databases and streamlining the data structures, BI platforms can fetch data faster than you can say “show me the stats!”
Think of queries as the little engines that could. When they’re tuned up and optimized, they zip through data, bringing you what you need at breakneck speed. Indexing? It’s your best pal here. It organizes the data so your queries can skip the fluff and get straight to the point. And remember, simpler is often better. Simplify your queries and watch them fly!
Cloud solutions are like magic carpets for data – they make it soar high and fast, giving you real-time insights. Why wait for traditional processing when the cloud offers speed and scale? It’s like having a superpower that lets you see the business landscape and make decisions on the fly!
Immediate insights are the name of the game, and real-time processing is the MVP. It’s all about now! No delays, no waiting. This tech takes in data, chews it up, and spits out insights faster than you can blink. It’s like having a conversation with your data, and who doesn’t want that?
How do you know if your business is winning? Enter Business Intelligence (BI) dashboards. They’re your scoreboard. These dashboards show you key metrics at a glance, helping you track performance and make smart decisions quickly. Think of them as your business’s health monitor, always on, always helping.
What makes a small business tick? Key Performance Indicators (KPIs), that’s what! Setting KPIs in your BI tools isn’t just smart; it’s essential. They help you focus on what matters most to your business. Whether it’s sales growth, customer satisfaction, or operational efficiency, KPIs keep you targeted on your goals.
Each department in your company has its own vibe. Why should they all use the same BI tools? They shouldn’t! Custom dashboards for each department mean that everyone gets exactly what they need. Marketing can watch their campaign performance, while finance keeps an eye on the budget. It’s like giving everyone the perfect set of tools for their job.
Retail moves fast, and you’ve got to keep up. Automated tracking in your BI tools does just that. It keeps tabs on sales, inventory, and customer trends without missing a beat. It’s like having a super-efficient assistant who never sleeps, making sure you always know how your business is doing.
In today’s fast-paced world, waiting to make decisions just doesn’t cut it. Real-time dashboards in your BI platform offer immediate insights. It’s like having a crystal ball, but better. You see what’s happening now, not hours or days later, allowing you to act fast and stay ahead.
Without BI, businesses are flying blind. BI gives you clear insights into your operations, showing you trends and patterns you’d miss otherwise. With this information, you can make informed decisions and get ahead of the competition.
BI tools collect data from different places like sales, customer interactions, or inventory. Then, they sort through it and make sense of it. You get easy-to-read reports and dashboards that tell you what’s working and what’s not.
Absolutely! BI isn’t only for big companies. Small businesses can use BI to track performance, understand customers better, and find ways to grow. It helps them stay competitive and make smarter decisions with their limited resources.
BI can look at all sorts of data – sales, customer feedback, website traffic, social media interactions, and more. It pulls in data from different sources and puts it in one place, making it easy to see the bigger picture.
Not really. Many BI tools are designed to be user-friendly. You don’t need to be a tech expert to get the hang of it. Plus, most tools offer tutorials and support to help you along the way.
Start by figuring out what data you already have. Choose a BI tool that fits your business needs and budget. Then, set it up to collect and analyze your data. Soon, you’ll have insights that help you run your business more efficiently.
One mistake is relying on bad or outdated data. If your data isn’t accurate, your insights won’t be either. Another mistake is not using the data once you have it. BI only works if you act on the insights it gives you.
BI takes the guesswork out of decision-making. Instead of making choices based on gut feeling, you’re making them based on facts. BI tools show you patterns, helping you predict what might happen next and plan accordingly.
BI isn’t a crystal ball, but it can help you forecast based on past data. It shows trends that help you understand what might come next. It’s not about guessing – it’s about making educated decisions based on what the data tells you.
BI focuses on understanding what’s happening in your business right now and what’s happened in the past. Analytics digs deeper to explain why things happened and helps predict what could happen next. They’re both useful, but BI is usually the first step before diving into deeper analytics.
BI is a tool, not a replacement. It’s there to help people make better decisions, not take over their jobs. People still need to interpret the data and decide what actions to take. BI just makes that process easier and more accurate.
Business Intelligence (BI) is more than a tool; it’s the key to transforming data into actionable insights. With BI, you’re able to streamline decision-making, improve efficiency, and drive your business forward. No more second-guessing or relying on instincts – BI lets you predict trends, adjust strategies, and stay ahead.
As businesses grow, data becomes increasingly complex. BI tools simplify this complexity by organizing, analyzing, and presenting data in ways that make sense. It’s all about using data to make better choices, faster.
Adopting BI isn’t just about implementing technology – it’s about building a culture of data-driven decisions. From automating reports to improving data quality, BI ensures your team stays aligned and informed. You’re not only solving today’s problems but preparing for the future.
The power of BI lies in its ability to turn data into a competitive advantage. Embrace it, and let data guide every decision you make.
How much did you enjoy this article?


Calculate accounts receivable turnover ratio to measure credit collection speed, improve cash flow, and strengthen your financial strategy. Read on!

Change Management KPIs are the key to tracking adoption, performance, and ROI during transitions. Find out which metrics matter. Read on!

Data collection methods and techniques determine the quality of every insight you act on. Explore key approaches for gathering reliable data. Read on!


